The article delves into the 2025 price prediction for Moonwalk Fitness (MF), a Solana-based gamified fitness platform. It focuses on MF’s market positioning, detailed price history, and current market status, providing an expert analysis of macroeconomic factors and their impact on price trends through 2030. The piece will guide investors by offering insights into potential price trajectories, investment strategies, and risk management tailored for different investor types, including institutional and retail. The report enhances understanding of MF's unique tokenomics, market dynamics, and essential strategies for informed investment decisions.
Introduction: MF's Market Position and Investment Value
Moonwalk Fitness (MF) is a gamified fitness platform that transforms step goals into social competitions by integrating with major wearables like Apple Watch, Fitbit, and Garmin. Powered by the Solana blockchain, MF enables users to deposit cryptocurrency or credits and earn rewards for achieving daily step targets, creating a unique intersection of fitness, gaming, and decentralized finance. As of December 25, 2025, MF has achieved a market capitalization of approximately $1.91 million with a circulating supply of 168 million tokens, trading at $0.01141 per token. This innovative fitness-to-earn asset is playing an increasingly important role in the intersection of health incentivization and blockchain technology.
This article will comprehensively analyze MF's price trajectory through 2030, integrating historical price patterns, market supply and demand dynamics, ecosystem development, and macroeconomic factors to provide investors with professional price forecasts and practical investment strategies.
Moonwalk Fitness (MF) Market Analysis Report
I. MF Price History Review and Current Market Status
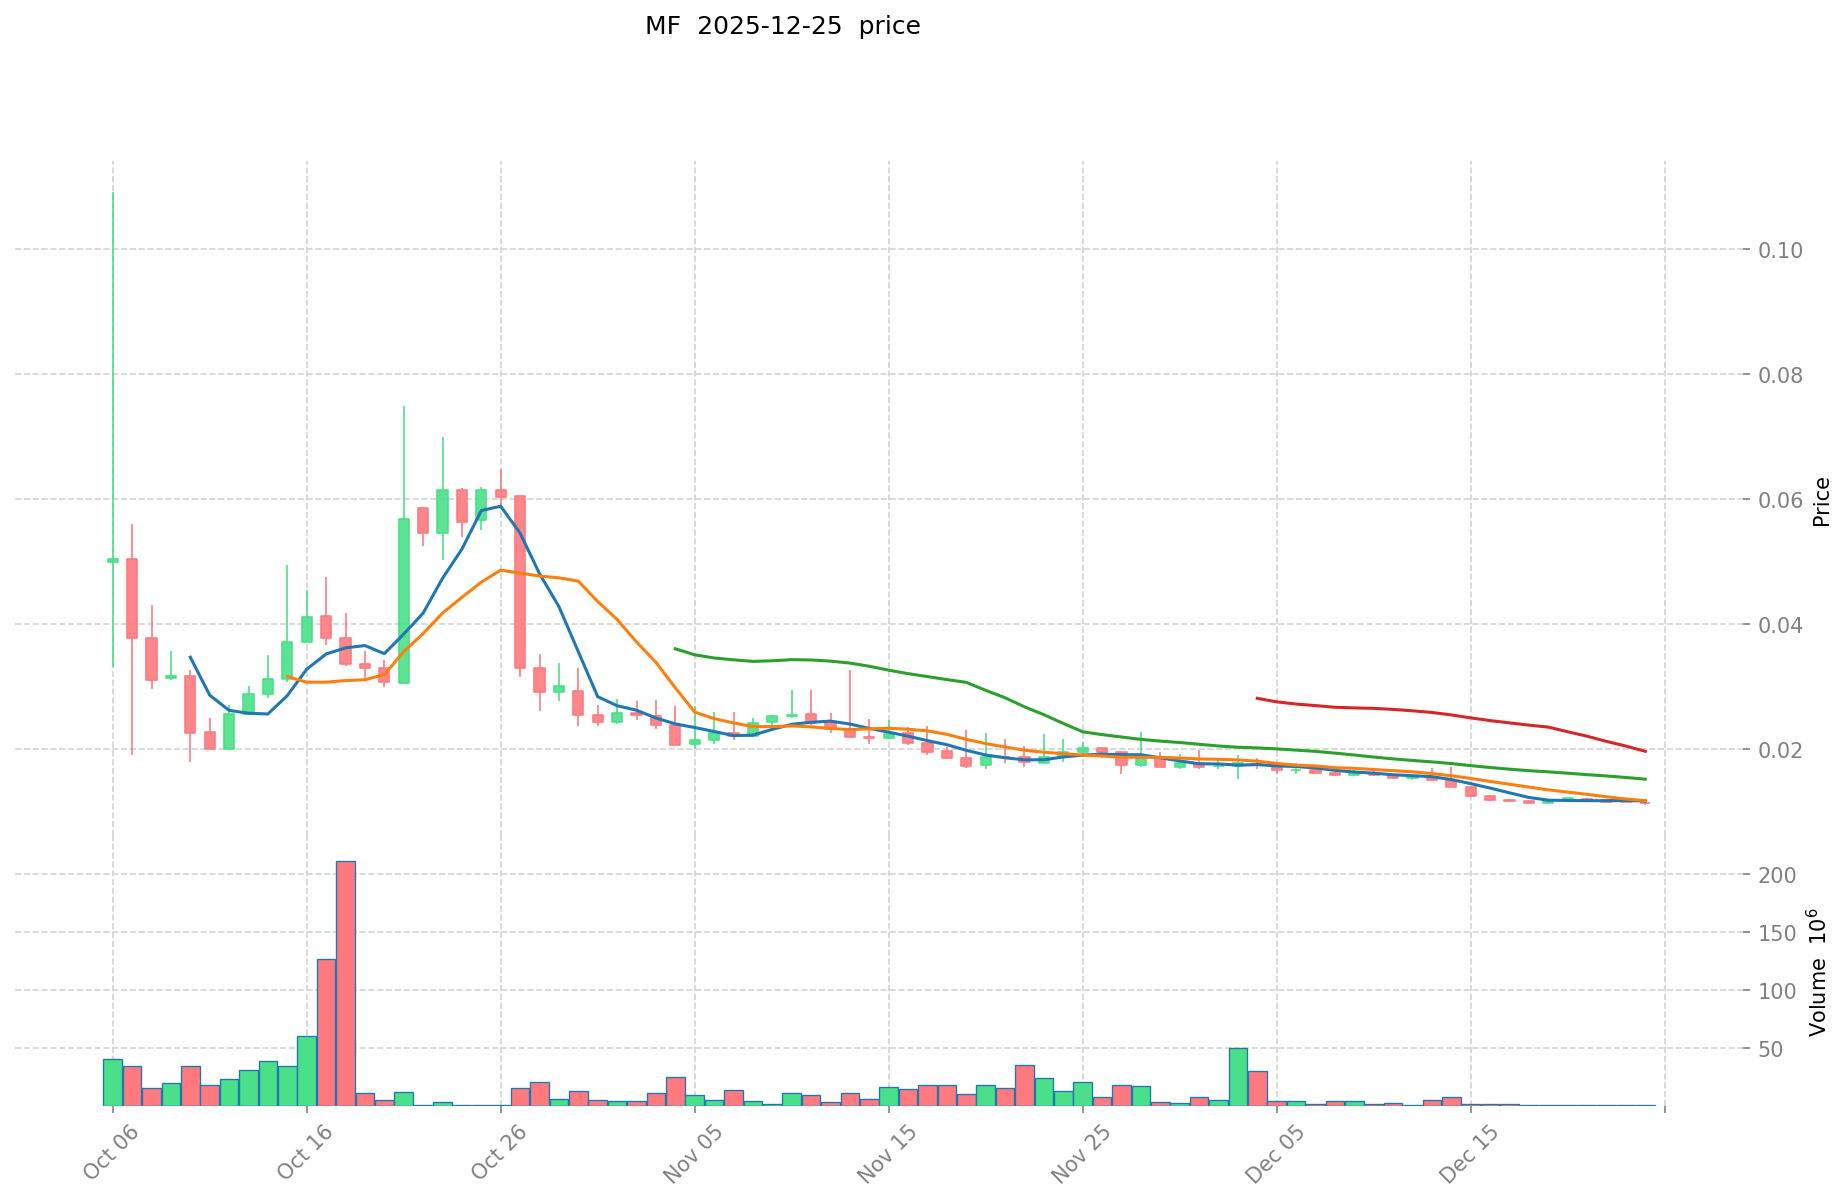
MF Historical Price Movement Trajectory
Based on available data, Moonwalk Fitness has demonstrated notable price volatility since its launch:
- October 2025: Project reached its all-time high (ATH) of $0.10922, marking the peak investor enthusiasm period.
- December 2025: Token experienced significant decline, with the all-time low (ATL) of $0.01099 recorded on December 24, 2025, representing a drawdown of approximately 89.9% from its peak.
MF Current Market Situation
As of December 25, 2025, Moonwalk Fitness token is trading at $0.01141, reflecting modest short-term price movements:
Price Performance Across Multiple Timeframes:
- 1-Hour Change: -0.35%
- 24-Hour Change: -0.08%
- 7-Day Change: -0.52%
- 30-Day Change: -41.25%
Market Capitalization Metrics:
- Current Market Cap: $1,916,880
- Fully Diluted Valuation (FDV): $11,410,000
- Market Cap to FDV Ratio: 16.8%
- 24-Hour Trading Volume: $14,876.99
- Market Dominance: 0.00035%
Token Supply Structure:
- Circulating Supply: 168,000,000 MF (16.8% of total supply)
- Total Supply: 1,000,000,000 MF
- Maximum Supply: 1,000,000,000 MF
- Active Token Holders: 3,318
Current Market Conditions:
The token operates on the Solana blockchain (SPL standard) and is listed on 3 exchanges. Current market sentiment indicates "Extreme Fear" with a VIX reading of 23, suggesting heightened market uncertainty. The 30-day price decline of 41.25% indicates significant downward pressure since early December, though the token has stabilized near its recent lows.
Click to view current MF market price
MF Market Sentiment Index
2025-12-25 Fear and Greed Index: 23 (Extreme Fear)
Click to view current Fear & Greed Index
The crypto market is experiencing extreme fear with an index reading of 23. This indicates significant market pessimism and heightened anxiety among investors. During such periods, assets are often heavily sold off, creating potential buying opportunities for contrarian traders. However, extreme fear also signals elevated risk, requiring careful portfolio management and thorough risk assessment. Monitor market developments closely and consider your investment strategy carefully. On Gate.com, you can track real-time market sentiment and make informed trading decisions.

MF Holdings Distribution
The address holdings distribution represents the concentration of MF tokens across major wallet addresses on the blockchain. This metric provides critical insights into the tokenomics structure, ownership concentration, and potential market dynamics by identifying how the total supply is distributed among key stakeholders. By analyzing the top holders and their respective percentages, investors and analysts can assess the decentralization level and vulnerability to potential price manipulation or coordinated market movements.
The current distribution of MF exhibits significant concentration characteristics, with the top five addresses collectively controlling 78.12% of the total supply. The leading address alone commands 35.48% of all tokens, representing a dominant position that substantially exceeds typical healthy decentralization benchmarks. The second and third largest holders maintain 17.00% and 15.00% respectively, further consolidating control among a limited number of stakeholders. This hierarchical distribution pattern indicates pronounced centralization, where a small cluster of addresses holds the majority voting power and liquidity control, creating structural imbalances in the token ecosystem.
Such extreme concentration raises material concerns regarding market resilience and fairness. The asymmetric holdings distribution suggests elevated susceptibility to price volatility, potential wash trading, or coordinated liquidation events initiated by major holders. The remaining 21.88% dispersed across other addresses demonstrates limited retail participation and community ownership, which typically correlates with reduced organic market support and lower ecosystem decentralization. This tokenomics structure reflects a top-heavy ownership model that may constrain long-term market stability and broader stakeholder engagement in governance mechanisms.
Click to view the current MF Holdings Distribution
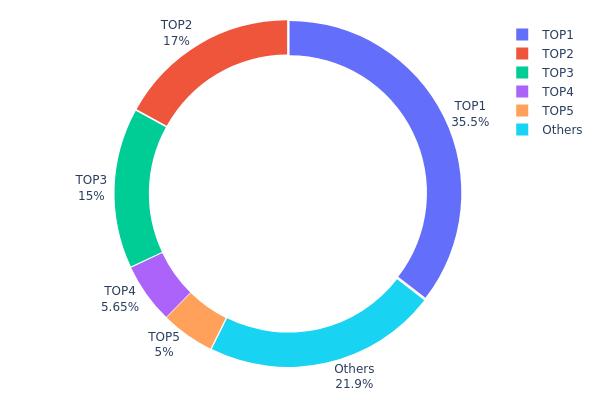
| Top |
Address |
Holding Qty |
Holding (%) |
| 1 |
ES4cxN...KL2sWB |
354807.70K |
35.48% |
| 2 |
8oUSXe...5zFyRs |
170000.00K |
17.00% |
| 3 |
3sxwPD...omNH7g |
150000.00K |
15.00% |
| 4 |
7Jf1DB...73fTkb |
56461.97K |
5.64% |
| 5 |
EVm7Pd...U7WX7J |
50000.00K |
5.00% |
| - |
Others |
218729.88K |
21.88% |
II. Core Factors Affecting MF's Future Price
Supply Mechanism
-
Token Distribution: MF has a total supply of 1 billion tokens with current circulation of approximately 16.8 million tokens (1.68% of total supply). This indicates significant room for future token release, which could impact price dynamics as circulation increases.
-
Current Impact: The highly concentrated token distribution presents both opportunities and risks. The top 5 addresses hold 78.40% of tokens, with the largest single address controlling 36.90%. As the project matures and token circulation expands, the potential for price volatility exists depending on how early holders distribute their positions.
Institutional and Whale Dynamics
- Whale Concentration: MF exhibits high token concentration among large holders. The top address holds 36.90% of total supply, indicating significant influence by major stakeholders on price movements. This concentration level suggests that large holder actions could substantially impact market sentiment and price direction.
Macroeconomic Environment
-
Monetary Policy Impact: Changes in monetary policy and interest rate fluctuations affect investment attractiveness for MF as a digital asset. In rising rate environments, cryptocurrency assets may face headwinds, while in accommodative policy conditions, investors may increase allocations to alternative assets.
-
Inflation Hedge Characteristics: MF possesses "digital gold" potential in inflationary environments. As a blockchain-based asset, it can serve as a hedge against currency devaluation, particularly during periods of elevated inflation or currency instability.
-
Geopolitical Factors: International geopolitical uncertainty may increase investment demand for MF as investors seek exposure to decentralized digital assets that are less subject to traditional geopolitical and policy risks.
III. 2025-2030 MF Price Forecast
2025 Outlook
- Conservative Forecast: $0.00705 - $0.01137
- Neutral Forecast: $0.01137
- Bullish Forecast: $0.01433 (requires sustained market demand and positive regulatory developments)
2026-2028 Medium-term Outlook
- Market Stage Expectations: Gradual recovery and consolidation phase with incremental gains as adoption metrics improve
- Price Range Predictions:
- 2026: $0.00989 - $0.01734
- 2027: $0.01042 - $0.01676
- 2028: $0.01258 - $0.02341
- Key Catalysts: Ecosystem expansion, institutional interest, technological upgrades, and increased utility adoption across decentralized platforms
2029-2030 Long-term Outlook
- Base Case: $0.01023 - $0.02459 in 2029, reaching $0.0177 - $0.02633 by 2030 (assumes steady market growth and mainstream adoption progression)
- Optimistic Case: $0.02459 - $0.02633 range by 2030 (contingent on accelerated DeFi adoption and strategic partnerships)
- Transformative Case: Potential to exceed $0.02633 with significant regulatory clarity, major enterprise integration, and breakthrough technological innovations
- 2030-12-25: MF trading at approximately +93% cumulative appreciation from 2025 baseline (bullish momentum sustained through sustained ecosystem development)
| 年份 |
预测最高价 |
预测平均价格 |
预测最低价 |
涨跌幅 |
| 2025 |
0.01433 |
0.01137 |
0.00705 |
0 |
| 2026 |
0.01734 |
0.01285 |
0.00989 |
12 |
| 2027 |
0.01676 |
0.0151 |
0.01042 |
32 |
| 2028 |
0.02341 |
0.01593 |
0.01258 |
39 |
| 2029 |
0.02459 |
0.01967 |
0.01023 |
72 |
| 2030 |
0.02633 |
0.02213 |
0.0177 |
93 |
Moonwalk Fitness (MF) Token: Professional Investment Strategy and Risk Management Report
Overview of Moonwalk Fitness (MF)
Project Basics:
- Token Name: Moonwalk Fitness
- Token Symbol: MF
- Current Price: $0.01141
- Market Capitalization: $1,916,880
- Fully Diluted Valuation: $11,410,000
- Circulating Supply: 168,000,000 MF
- Total Supply: 1,000,000,000 MF
- Blockchain: Solana (SPL Token)
- Market Rank: #2160
- Current Date: December 25, 2025
Project Description:
Moonwalk Fitness gamifies your fitness journey by turning step goals into social competitions. Users join group games, deposit cryptocurrency or credits, and earn rewards for hitting their daily step targets. Missed goals lead to lost deposits redistributed to successful players, creating accountability and motivation. Integrated with major wearables like Apple Watch, Fitbit, and Garmin, Moonwalk offers leaderboards, XP rewards through its Ascent system, and even spectator modes for risk-free participation—all powered by Solana blockchain for transparent, seamless transactions.
Four: MF Professional Investment Strategy and Risk Management
MF Investment Methodology
(1) Long-term Holding Strategy
Target Audience:
- Fitness enthusiasts seeking long-term exposure to Web3 fitness projects
- Investors believing in the sustainability of move-to-earn ecosystems
- Community-focused participants interested in fitness gamification
Operational Recommendations:
- Accumulate MF tokens during periods of market decline, particularly when 30-day performance shows weakness (currently down 41.25%)
- Participate actively in the Moonwalk community through group games to understand the tokenomics and ecosystem engagement
- Hold tokens through market cycles while monitoring the project's development roadmap and wearable device integrations
Storage Solutions:
- Utilize Gate.com's Web3 wallet for secure token storage with easy access for ecosystem participation
- Maintain seed phrases and private keys in secure, offline locations
- Consider splitting holdings between exchange wallet and self-custody solutions for optimal security
(2) Active Trading Strategy
Technical Analysis Considerations:
- Price Movement Observation: Monitor the token's price trends across multiple timeframes (currently showing -0.35% in 1H, -0.08% in 24H, -0.52% in 7D)
- Historical Price Levels: All-Time High of $0.10922 (October 6, 2025) and recent low of $0.01099 (December 24, 2025) establish key resistance and support levels
- Volume Analysis: 24-hour trading volume of $14,876.99 indicates moderate liquidity; track volume changes to identify potential breakout opportunities
Wave Trading Key Points:
- Capitalize on the significant 30-day decline of 41.25% by identifying reversal signals at support levels
- Use the $0.01099 level as a critical support point; positions above this level suggest accumulation phases
- Scale trading positions during periods of increased volatility to manage risk exposure effectively
Five: MF Potential Risks and Challenges
MF Market Risks
-
Low Market Liquidity: With only 3 trading exchanges and moderate 24-hour volume, MF faces liquidity challenges that could result in slippage during large transactions and difficulty executing exit strategies during market downturns.
-
Significant Price Volatility: The token experienced a 41.25% decline over 30 days and trades substantially below its all-time high, indicating high price volatility that can lead to unexpected losses for unprepared investors.
-
Market Concentration Risk: With 3,318 token holders, the distribution may be concentrated among early adopters or whale accounts, creating potential for sudden price movements driven by large sales or coordinated exits.
MF Monitoring and Operational Risks
-
User Adoption Uncertainty: The success of Moonwalk Fitness depends on sustained user engagement and adoption across multiple wearable platforms; declining activity metrics could negatively impact token demand and price.
-
Competitive Pressure: The move-to-earn and fitness gamification space continues to attract new projects; increased competition could fragment user bases and reduce MF's competitive advantages.
-
Ecosystem Dependency: The project's reliance on Solana blockchain means it faces indirect risks from Solana network issues, congestion, or security incidents that could disrupt Moonwalk operations.
MF Technical Risks
-
Smart Contract Vulnerabilities: Despite Solana's security track record, any undetected vulnerabilities in Moonwalk's smart contracts could compromise user funds or tokenomics integrity.
-
Wearable Device Integration Failures: The project's dependence on accurate data feeds from Apple Watch, Fitbit, and Garmin introduces technical risk; integration failures could disrupt reward distribution mechanisms.
-
Blockchain Dependency: Any significant issues with the Solana network could directly impact transaction settlements, reward distribution, and overall ecosystem functionality.
Six: Conclusion and Action Recommendations
MF Investment Value Assessment
Moonwalk Fitness represents an innovative convergence of fitness gamification and blockchain technology, leveraging the growing move-to-earn sector. However, the project faces notable challenges including limited market liquidity, significant recent price decline (41.25% over 30 days), and dependency on sustained user adoption across wearable platforms. The token's market capitalization of $1.9 million and rank at #2160 suggest an early-stage project with both substantial growth potential and significant risk factors. Investors should carefully evaluate the project's development progress, community engagement metrics, and competitive positioning within the fitness-to-earn ecosystem before committing capital.
MF Investment Recommendations
✅ For Beginners:
Start with small position sizes during established support levels. Allocate only capital you can afford to lose completely. Use dollar-cost averaging to enter positions gradually over several weeks. Ensure full understanding of the ecosystem mechanics and wearable device integrations before significant investment.
✅ For Experienced Investors:
Implement technical analysis-based strategies using the established resistance at $0.10922 and support at $0.01099. Monitor development milestones, user adoption metrics, and ecosystem partnerships. Consider scaling positions based on volume increases and reversal signals from the 41.25% monthly decline.
✅ For Institutional Investors:
Conduct thorough due diligence on tokenomics sustainability, smart contract security audits, and competitive positioning. Evaluate partnership opportunities with wearable manufacturers. Consider strategic positions with extended holding periods focused on ecosystem maturation and user base expansion.
MF Trading Participation Methods
-
Gate.com Spot Trading: Access MF trading pairs directly on Gate.com, benefiting from the platform's user-friendly interface and robust security infrastructure.
-
Community Participation: Engage directly with Moonwalk Fitness group games through the official platform to gain firsthand experience with ecosystem mechanics while potentially earning rewards.
-
Wearable Device Integration: Connect supported devices (Apple Watch, Fitbit, Garmin) to the Moonwalk platform to participate in step-goal competitions and assess product-market fit before making larger investment decisions.
Cryptocurrency investment carries extremely high risk and is not suitable for all investors. This report does not constitute investment advice. Investors should make decisions based on their own risk tolerance and financial situation. It is strongly recommended to consult with a professional financial advisor before making any investment decisions. Never invest more capital than you can afford to lose completely.
FAQ
What is the price prediction for MFI stock?
The price prediction for MFI stock is $22.846 in 14 days, based on current market analysis and technical indicators. Monitor market trends for updated forecasts.
How to predict if a stock will go up?
Analyze price trends, trading volume, and market sentiment. Use technical indicators like moving averages and candlestick patterns. Study fundamental factors affecting the asset. Monitor support and resistance levels for entry signals.
What factors influence MF stock price movements?
MF price movements are driven by market demand, trading volume, investor sentiment, and overall cryptocurrency market trends. Regulatory news, Bitcoin correlation, and macroeconomic factors also significantly impact price dynamics.
MF reached an all-time high of $98.32 on April 22, 2024. The 52-week high stands at $60.73. Historical data shows significant volatility with notable price fluctuations throughout its trading history, reflecting market dynamics and investor sentiment shifts.
What are the risks associated with MF stock price prediction?
MF price prediction involves market volatility, unpredictable external factors, and overbought signals indicating potential pullbacks. Accurate forecasts remain challenging due to complex market dynamics and sudden price fluctuations.
* The information is not intended to be and does not constitute financial advice or any other recommendation of any sort offered or endorsed by Gate.