# 2025 MILK Price Prediction: Expert Analysis and Market Forecast for the Upcoming Year
## Article Overview
This comprehensive MILK price prediction report delivers professional market analysis and investment guidance for Milkyway (MILK), the leading liquid staking and restaking protocol in the modular ecosystem. The report examines MILK's current market position at $0.005108 with a $1.22M capitalization, analyzes historical price patterns showing a -97.76% year-to-date decline, and provides detailed price forecasts spanning 2025-2030. Designed for investors ranging from beginners to institutional traders, this guide addresses critical questions about MILK's market viability, investment timing, and risk management strategies while offering actionable trading recommendations on Gate. Whether you seek speculative opportunities or long-term ecosystem exposure, this report equips you with data-driven insights to navigate MILK's volatile market dynamics.
---
## Article Structure Overview
**I. Market Foundatio
Introduction: Market Position and Investment Value of MILK
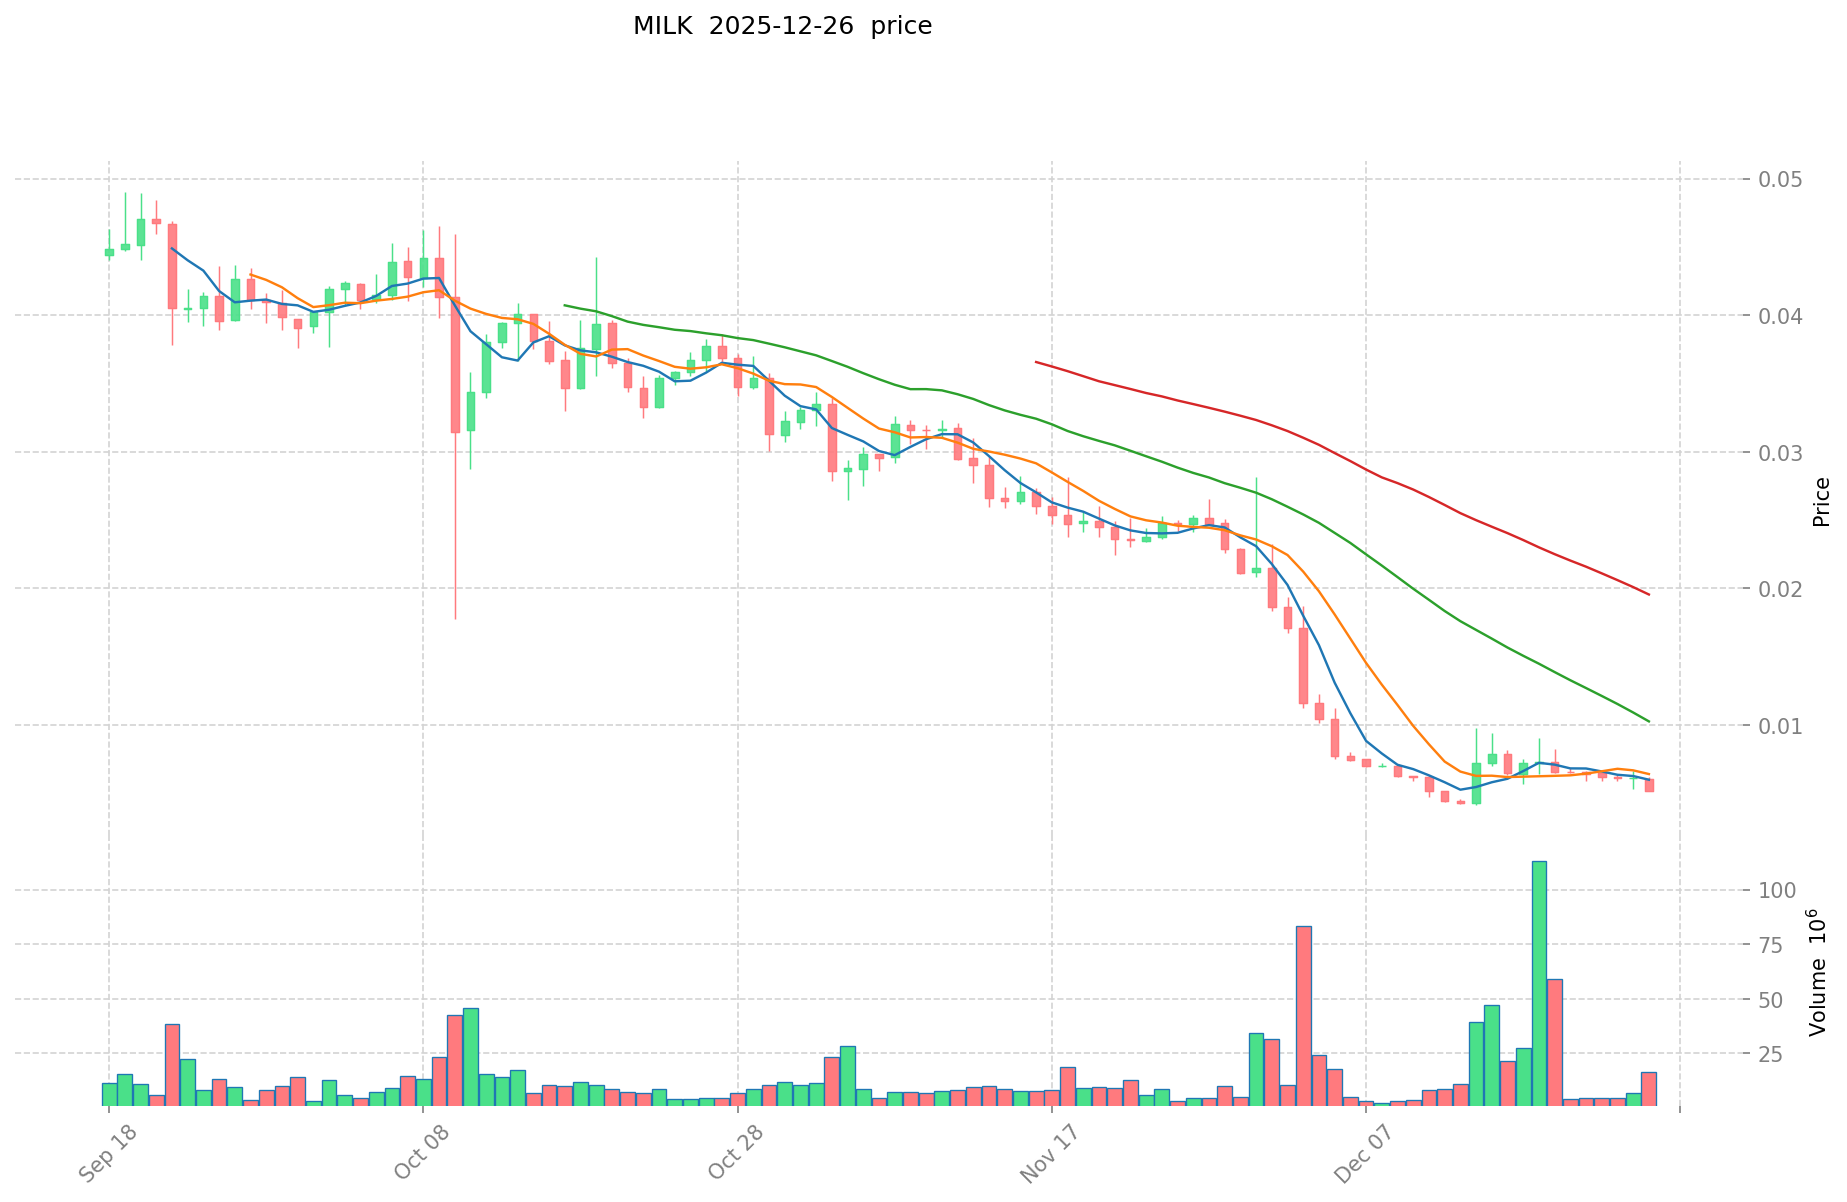
Milkyway (MILK) operates as the first and largest liquid staking and restaking protocol in the modular ecosystem. Since its launch in April 2025, MILK has established itself as a key infrastructure asset within its sector. As of December 26, 2025, MILK maintains a market capitalization of approximately $1.22 million, with a circulating supply of 238.9 million tokens and a current price of $0.005108. This innovative protocol is playing an increasingly critical role in the liquid staking and restaking landscape.
This article provides a comprehensive analysis of MILK's price trajectory and market dynamics, incorporating historical price patterns, supply-demand factors, ecosystem developments, and macroeconomic conditions to deliver professional price forecasts and actionable investment guidance for the period from 2025 through 2030.
Milkyway (MILK) Market Analysis Report
I. MILK Price History Review and Current Market Status
MILK Historical Price Evolution
-
April 29, 2025: MILK reached its all-time high of $0.2919, marking the peak of its market performance during the period covered by available data.
-
December 14, 2025: MILK hit its all-time low of $0.004107, representing a significant decline from previous highs.
-
2025 Overall Trajectory: MILK experienced severe downward pressure throughout 2025, with a year-to-date decline of -97.76%, dropping from higher valuations to current levels.
MILK Current Market Status
As of December 26, 2025, MILK is trading at $0.005108, reflecting ongoing bearish market conditions. The token has experienced significant short-term volatility:
- 24-hour performance: -10.76% decline
- 7-day performance: -27.27% decline
- 30-day performance: -78.81% decline
- 1-hour performance: -0.16% decline
The 24-hour trading range spans from $0.0051 to $0.005882, with a 24-hour volume of approximately 221,109 MILK tokens. The current market capitalization stands at $1,220,301.20, with a fully diluted valuation of $5,108,000.00. MILK maintains a market dominance of 0.00015%, ranking #2487 across all cryptocurrencies.
With 238,900,000 tokens in circulation out of a total supply of 1,000,000,000 and a maximum supply capped at 1,200,000,000, the circulating supply represents approximately 19.91% of the fully diluted valuation. The token is currently trading at 98.51% below its all-time high, indicating substantial downward price pressure from peak valuations.
Market sentiment remains highly negative, with the broader market experiencing extreme fear conditions as indicated by current volatility metrics.
Click to view current MILK market price
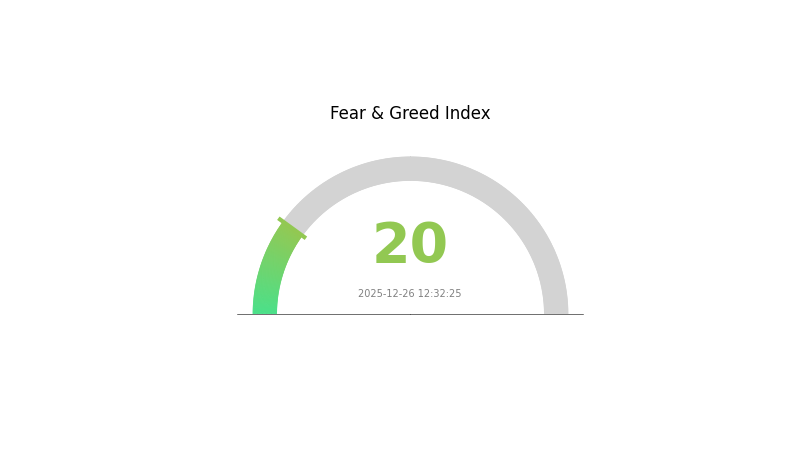
MILK Market Sentiment Indicator
2025-12-26 Fear and Greed Index: 20 (Extreme Fear)
Click to view current Fear & Greed Index
The cryptocurrency market is currently experiencing extreme fear, with the index hitting 20 points. This indicates significant market pessimism and heightened investor anxiety. During such periods, market volatility tends to increase substantially, presenting both risks and opportunities. Conservative investors may adopt a wait-and-see approach, while experienced traders might view extreme fear as a potential buying opportunity for long-term positions. It's crucial to conduct thorough research and risk assessment before making investment decisions on Gate.com during this volatile period.
MILK Holdings Distribution
The holdings distribution map illustrates the concentration and dispersal of MILK tokens across different wallet addresses, serving as a critical indicator of market structure health and decentralization levels. This metric reveals the distribution pattern of token ownership among top holders and provides insights into potential market concentration risks and price stability factors.
Without specific quantitative data from the provided table, a comprehensive analysis of MILK's current concentration characteristics cannot be conclusively determined. However, the holdings distribution framework remains essential for evaluating whether token ownership exhibits excessive centralization or maintains a healthy dispersal pattern. Typically, tokens with highly concentrated holdings among a limited number of addresses face elevated risks of market manipulation, sudden price volatility, and reduced trading liquidity. Conversely, tokens demonstrating more distributed ownership structures tend to exhibit greater resilience and more stable price discovery mechanisms.
The address distribution pattern directly influences market microstructure dynamics, including potential price fluctuations, trading depth, and the likelihood of coordinated large-scale token movements. A fragmented holder base generally supports healthier on-chain ecosystems with reduced manipulation vectors, while concentrated holdings among prominent addresses may introduce asymmetric information advantages and heightened systemic risks. By monitoring the evolving distribution of MILK holdings, market participants can better assess the token's decentralization trajectory and the relative stability of its underlying blockchain ecosystem infrastructure.
Click to view current MILK Holdings Distribution

| Top |
Address |
Holding Qty |
Holding (%) |
Core Factors Influencing Raw Milk Future Price Trends
Supply Mechanism
-
Dairy Cattle Production Cycle: Raw milk production is fundamentally constrained by the biological production cycle of dairy cattle. From birth to productive lactation, dairy cows require approximately two years of development. This extended timeline creates significant supply rigidity, as capacity adjustments cannot respond quickly to price changes. Once dairy cattle are culled during low-price periods, rebuilding herd size requires a minimum of two years to generate new productive capacity.
-
Historical Supply Patterns: Since 2008, China's raw milk market has experienced three major adjustment cycles. The current downturn began in September 2021 and has persisted for over 40 months, representing the longest adjustment period in recent history. Previous cycles lasted 1-4 years, with upward cycles typically spanning 2-3 years driven by the natural constraints of cattle breeding timelines.
-
Current Supply Status: As of 2024, raw milk supply remains in significant oversupply. Total raw milk supply is estimated at approximately 14% above 2019 baseline levels. However, by late 2024, dairy cattle inventory began declining at accelerating rates, with December 2024 showing year-on-year declines of 4.5%. Industry projections suggest that supply-demand rebalancing could occur by H2 2025 if this downward production trajectory continues.
Macroeconomic Environment
-
Feed Cost Dynamics: Feed costs represent approximately 65-70% of total dairy cattle rearing expenses. In 2024, corn and soybean meal prices declined 14.8% and 21.3% respectively, reducing production costs to 3.46 yuan/kilogram. However, raw milk prices fell to 3.11-3.32 yuan/kilogram, creating severe losses across the industry with over 80% of farms operating unprofitably.
-
Import Price Competition: International dairy product prices have strengthened in 2024, increasing from their 2020-2023 lows. Imported bulk powder, when converted to raw milk equivalent, reached prices exceeding domestic raw milk prices by May 2024 for the first time in over a decade. This shift reduces import pressure on domestic prices and supports gradual price recovery.
Global Market Factors
-
International Supply Trends: Global dairy cattle inventory showed minimal growth in 2024 at +0.24%, with projections for 2025 indicating slight declines of -0.18%. Key exporting regions including the EU, New Zealand, and the US experienced herd reductions of -0.74%, -0.86%, and -0.44% respectively. This global supply tightening supports medium-term price stability.
-
Export Market Dynamics: New Zealand and the EU dominate global dairy exports, accounting for 32% and 31% of market share respectively. New Zealand supplies 82% of China's bulk powder imports. Global dairy product auction prices have shown strength since Q4 2024, with most products maintaining upward momentum into 2025.
Industry Profitability and Capacity Adjustment
-
Economic Viability Threshold: Historical data shows that when dairy farming achieves profitability above production costs, industry expansion continues despite cycle downturns. However, when losses exceed 3% of costs (as seen in mid-2024), rapid capacity culling accelerates. Current pricing at or marginally above cost levels (0.62% premium as of November 2024) indicates imminent inflection points.
-
Dairy Enterprise Consolidation: Leading dairy enterprises control approximately 40% of domestic supply through company-owned and controlled farms. These consolidated operations demonstrate greater resilience during downturns, tolerating price levels that force independent social farms into exit. This structural bifurcation affects both supply dynamics and price floors.
The convergence of extended production cycles, declining global inventories, improved import pricing, and industry-wide losses creates preconditions for supply-demand rebalancing in the second half of 2025, with potential for raw milk price recovery if demand stabilizes or improves.
III. 2025-2030 MILK Price Forecast
2025 Outlook
- Conservative Forecast: $0.00303 - $0.00513
- Base Case Forecast: $0.00513
- Optimistic Forecast: $0.0058 (requires sustained ecosystem development and increased adoption)
2026-2028 Mid-term Outlook
- Market Stage Expectation: Gradual recovery phase with consolidation patterns, characterized by incremental adoption growth and market sentiment stabilization.
- Price Range Forecast:
- 2026: $0.00317 - $0.00814 (6% upside potential)
- 2027: $0.00347 - $0.0081 (33% cumulative gain)
- 2028: $0.00648 - $0.00924 (45% cumulative gain)
- Key Catalysts: Enhanced protocol functionality, expanded partnerships, improved liquidity conditions on platforms like Gate.com, and broader market recovery cycles.
2029-2030 Long-term Outlook
- Base Case Scenario: $0.00751 - $0.00926 (63% cumulative gain by 2029; continued appreciation trajectory)
- Optimistic Scenario: $0.00836 - $0.0125 (72% cumulative gain by 2030; assumes sustained positive market conditions and ecosystem expansion)
- Transformative Scenario: $0.0125+ (extreme favorable conditions including mainstream institutional adoption, major network upgrades, and significant increases in protocol utility and market demand)
Note: All price forecasts are subject to high volatility and should be evaluated alongside comprehensive market analysis. Past performance does not guarantee future results.
| 年份 |
预测最高价 |
预测平均价格 |
预测最低价 |
涨跌幅 |
| 2025 |
0.0058 |
0.00513 |
0.00303 |
0 |
| 2026 |
0.00814 |
0.00546 |
0.00317 |
6 |
| 2027 |
0.0081 |
0.0068 |
0.00347 |
33 |
| 2028 |
0.00924 |
0.00745 |
0.00648 |
45 |
| 2029 |
0.00926 |
0.00834 |
0.00751 |
63 |
| 2030 |
0.0125 |
0.0088 |
0.00836 |
72 |
MILK Token Investment Analysis Report
IV. MILK Professional Investment Strategy and Risk Management
MILK Investment Methodology
(1) Long-term Holding Strategy
- Suitable investors: Believers in modular ecosystem development and liquid staking protocols
- Operational suggestions:
- Accumulate MILK during market downturns when price volatility is high
- Hold through market cycles to benefit from protocol adoption growth in the modular ecosystem
- Set clear entry and exit targets based on project milestones and ecosystem developments
(2) Active Trading Strategy
- Technical analysis tools:
- Support and Resistance Levels: Use historical price points at $0.005108 (current support) and $0.005882 (24h resistance) to identify entry and exit opportunities
- Trend Analysis: Monitor the 7-day (-27.27%) and 30-day (-78.81%) price trends to identify reversal patterns and trading momentum
- Wave operation key points:
- Trade during high volume periods to ensure liquidity (24h volume: 221,109 MILK)
- Establish stop-loss orders at previous local lows to protect capital during sharp downturns
MILK Risk Management Framework
(1) Asset Allocation Principles
- Conservative investors: 1-3% of portfolio
- Aggressive investors: 3-8% of portfolio
- Professional investors: 5-15% of portfolio (with hedging strategies)
(2) Risk Hedging Solutions
- Diversification strategy: Balance MILK holdings with other established assets in the modular ecosystem sector
- Position sizing: Use dollar-cost averaging to reduce timing risk across multiple purchase points
(3) Security Storage Solutions
- Hot wallet method: Gate.com Web3 Wallet for active trading and frequent transactions
- Security precautions: Enable two-factor authentication, use hardware-level encryption, never share private keys or seed phrases, regularly audit wallet activity for unauthorized access
V. MILK Potential Risks and Challenges
MILK Market Risk
- Extreme price volatility: MILK has experienced a -97.76% decline over the past year and -78.81% in the past month, indicating extreme market sensitivity and potential for further downside
- Liquidity concentration: With only 9 exchanges currently listing MILK and a 24h volume of 221,109 tokens, market liquidity remains limited, increasing slippage risk during large trades
- Market sentiment deterioration: Current market emotion score of 2 (on a negative scale) suggests weak investor confidence and potential for continued selling pressure
MILK Regulatory Risk
- Emerging protocol status: As a relatively new liquid staking and restaking protocol, MILK may face evolving regulatory scrutiny regarding DeFi protocols and staking mechanisms
- Jurisdictional uncertainty: Regulatory frameworks for modular ecosystems and restaking protocols are still developing across major markets, creating potential compliance risks
- Policy changes: Changes in cryptocurrency regulations or staking protocol regulations could negatively impact MILK's operational model
MILK Technical Risk
- Protocol execution risk: As a liquid staking and restaking protocol, technical vulnerabilities in smart contracts could result in loss of user funds or protocol compromise
- Modular ecosystem dependency: MILK's value proposition is tied to the adoption and success of the broader modular ecosystem; failure or delays in this ecosystem could diminish MILK's utility
- Smart contract audit concerns: Continuous monitoring is required to ensure protocol security and identify potential vulnerabilities before they become critical issues
VI. Conclusions and Action Recommendations
MILK Investment Value Assessment
MILK operates in the promising modular ecosystem and liquid staking space, positioning it as a potential beneficiary of DeFi innovation. However, the token faces significant headwinds including catastrophic year-over-year losses (-97.76%), extreme recent declines (-78.81% in 30 days), weak market sentiment, and limited exchange availability. While the underlying protocol shows structural promise, current market conditions and price action suggest extreme caution. This token represents a high-risk, speculative opportunity suited only for risk-tolerant investors conducting thorough due diligence.
MILK Investment Recommendations
✅ Beginners: Avoid or allocate only minimal capital (under 1% of portfolio) until you fully understand modular ecosystems and restaking mechanisms; consider studying the project documentation first
✅ Experienced traders: Monitor technical levels closely; consider small speculative positions only during oversold conditions with strict stop-losses at key support levels
✅ Institutional investors: Conduct comprehensive technical audits of the MILK protocol, evaluate team credentials, and assess regulatory compliance before any significant allocation
MILK Trading Participation Methods
- Gate.com Spot Trading: Purchase MILK directly through Gate.com's spot trading market with real-time price discovery and secure settlement
- Gate.com Wallet Integration: Store purchased MILK securely using Gate Web3 Wallet while maintaining withdrawal flexibility
- Dollar-Cost Averaging: Execute multiple smaller purchases over time through Gate.com to reduce timing risk and average entry costs
Cryptocurrency investment carries extreme risk. This report does not constitute investment advice. Investors should make decisions based on their individual risk tolerance and financial situation. Always consult with a professional financial advisor before making significant investment decisions. Never invest more capital than you can afford to lose completely.
FAQ
What is the future outlook for milk prices?
Milk prices are projected to rise moderately due to increased herd sizes and higher milk production. The USDA forecasts larger dairy herds through 2035, with growing output potentially creating upward price pressures in the medium to long term.
Will milk prices go up in 2025?
Yes. The dairy forecast for 2025 is positive, with the national all-milk price projected to average $21.60/cwt. Prices are expected to rebound starting June 2025 with new federal order pricing, and feed costs are projected to stabilize for the remainder of the year.
Will milk prices go down?
Milk prices are likely to decline or remain flat through 2026 due to increasing global supplies and tight producer margins. Growing milk production outpaces steady demand, while strong competition keeps downward pressure on prices.
Why the average price of milk increased from $3.00 last year to $3.50 this year?
The milk price increase from $3.00 to $3.50 reflects inflation and rising production costs. Supply chain pressures, feed costs, and increased demand have collectively driven up dairy prices across the market this year.
* The information is not intended to be and does not constitute financial advice or any other recommendation of any sort offered or endorsed by Gate.