This comprehensive guide provides expert analysis and market forecasts for MOVE token through 2031. Movement Network, a modular Move-based blockchain ecosystem bridging Move and EVM ecosystems, offers significant investment potential despite its -95.36% decline from launch highs. The article examines MOVE's current market position at $0.0388, analyzing historical price evolution and supply dynamics. Core sections deliver 2026-2031 price predictions ranging from conservative to optimistic scenarios, alongside professional investment strategies including long-term holding and active trading approaches. Risk management frameworks address asset allocation, portfolio diversification, and secure storage solutions via Gate Web3 Wallet. The analysis identifies key catalysts including institutional adoption, technological advancement, and ecosystem development while highlighting volatility risks and regulatory uncertainties. Tailored recommendations suit beginners, experienced traders, and institutions, emphasizing do
Introduction: MOVE's Market Position and Investment Value
Movement Network (MOVE), positioned as a modular Move-based blockchain ecosystem bridging Move and EVM ecosystems, has demonstrated notable development since its launch in December 2024. As of January 2026, MOVE maintains a market capitalization of approximately $123.42 million, with a circulating supply of around 3.179 billion tokens and a price hovering near $0.0388. This asset, characterized as an innovative blockchain infrastructure solution, is playing an increasingly significant role in facilitating secure and performant blockchain application development.
This article will comprehensively analyze MOVE's price trajectory from 2026 to 2031, combining historical patterns, market supply and demand dynamics, ecosystem development, and macroeconomic conditions to provide professional price forecasts and practical investment strategies for investors.
I. MOVE Price History Review and Market Status
MOVE Historical Price Evolution Trajectory
- December 2024: Movement Network launched its token on December 9, 2024, with an initial trading price of approximately 0.3325, reaching a peak of 1.34 during its early trading period
- 2025: Throughout the year, MOVE experienced significant price volatility, declining from its historical high and entering a prolonged consolidation phase with prices fluctuating in lower ranges
- October 2025: The token reached its historical low point of 0.03033 on October 10, 2025, representing a substantial decline from its launch price
MOVE Current Market Status
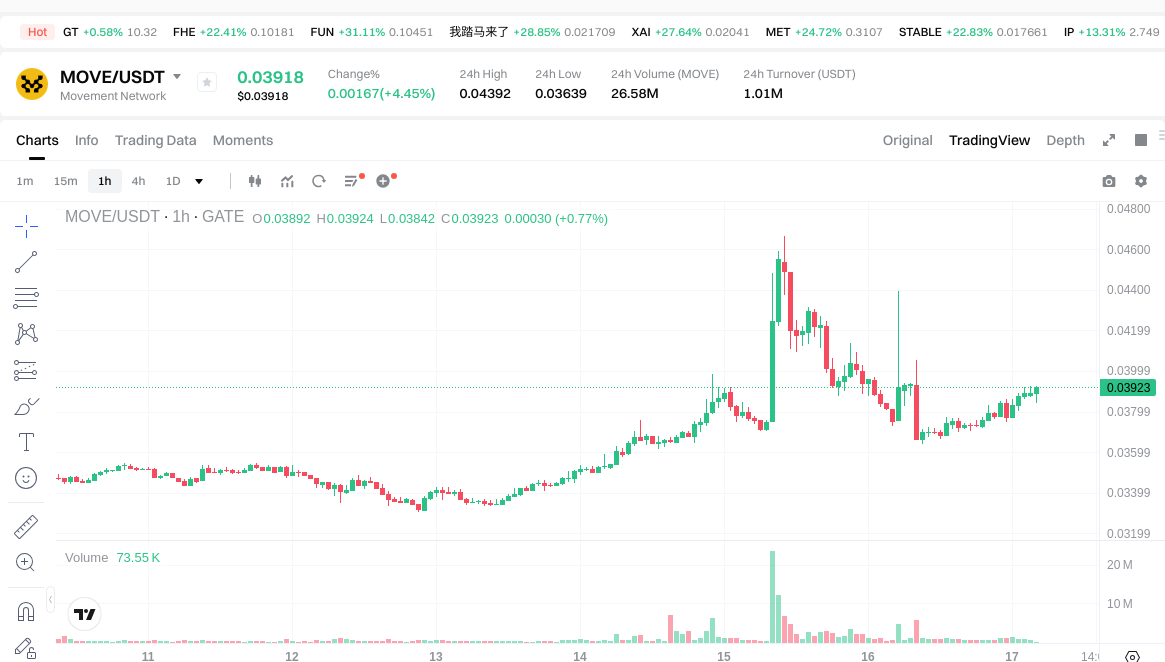
As of January 17, 2026, MOVE is trading at 0.03882, showing a 1.49% increase over the past 24 hours. The token's 24-hour trading range spans from 0.03639 to 0.04392, with a total trading volume of approximately 1.02 million. Over the past week, MOVE has demonstrated positive momentum with an 11.91% gain, while the 30-day performance shows an 11.20% increase.
The current market capitalization stands at approximately 123.42 million, with a circulating supply of 3.18 billion tokens out of a maximum supply of 10 billion tokens, representing a circulation ratio of 31.79%. The fully diluted market cap is estimated at 388.2 million. MOVE currently ranks 326th in the overall cryptocurrency market with a market dominance of 0.011%.
Movement Network has established presence across 38 cryptocurrency exchanges and maintains a holder base of approximately 39,257 addresses. The token operates on the Ethereum blockchain under the ERC20 standard, with its contract address at 0x3073f7aaa4db83f95e9fff17424f71d4751a3073.
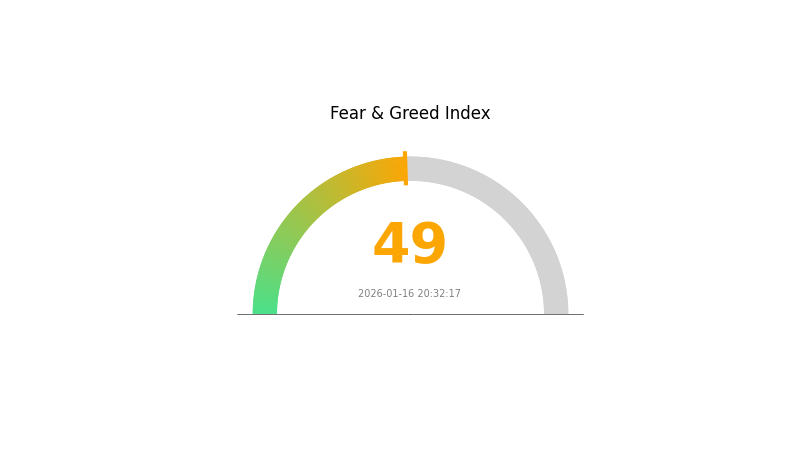
The current market sentiment indicator shows a neutral reading at 49 on the VIX scale, suggesting balanced market conditions without extreme fear or greed dominating investor behavior.
Click to view current MOVE market price
MOVE Market Sentiment Indicator
2026-01-16 Fear & Greed Index: 49 (Neutral)
Click to view the current Fear & Greed Index
The crypto market is currently in a neutral sentiment state with a Fear & Greed Index of 49. This balanced reading indicates that market participants are neither excessively fearful nor overly greedy. Investors should maintain a measured approach, avoiding impulsive decisions driven by extreme emotions. Such neutral conditions often present opportunities for strategic positioning and careful portfolio assessment. Monitor market developments closely as sentiment can shift rapidly in response to macroeconomic factors and industry news.
MOVE Holding Distribution
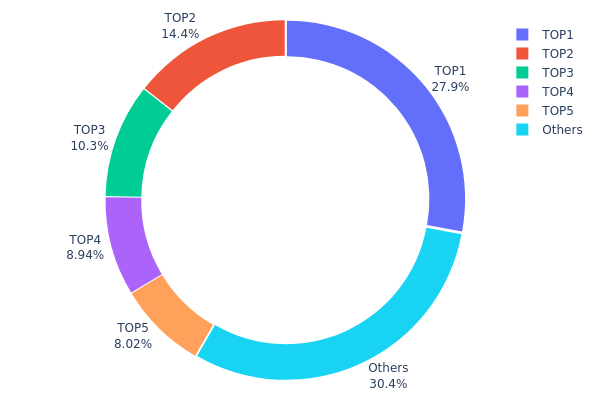
The holding distribution chart illustrates the concentration of MOVE tokens across different wallet addresses, providing insights into the decentralization level and potential market control by large holders. This metric is crucial for understanding the token's distribution structure and assessing the risk of price manipulation by whale addresses.
Based on the current data, MOVE exhibits a relatively high concentration pattern. The top holder controls 27.94% of the total supply (2.79 billion tokens), while the top five addresses collectively hold 69.60% of all circulating tokens. This concentration level indicates significant centralization risk, as a small number of entities possess substantial market power. The remaining 30.4% distributed among other addresses suggests limited token dispersion across the broader community.
Such concentration poses several implications for market stability. Large holders can exert considerable influence on price movements through coordinated selling or buying pressure. The substantial holdings by top addresses may limit liquidity during volatile periods and increase the potential for sudden price swings. However, if these addresses belong to project treasuries, exchanges, or institutional stakeholders with long-term commitments, the concentration might reflect strategic allocation rather than manipulation risk. From a structural perspective, this distribution pattern suggests MOVE remains in an early adoption phase with limited retail participation, which could evolve as the project matures and token distribution broadens through ecosystem activities and trading volume expansion.
Click to view current MOVE Holding Distribution
| Top |
Address |
Holding Qty |
Holding (%) |
| 1 |
0xe3e8...5f4f25 |
2794019.14K |
27.94% |
| 2 |
0xb3a9...94e51e |
1439320.11K |
14.39% |
| 3 |
0xe67a...610d9b |
1031221.65K |
10.31% |
| 4 |
0xf1df...2cbe0f |
894111.67K |
8.94% |
| 5 |
0x5098...4295eb |
802296.89K |
8.02% |
| - |
Others |
3039030.54K |
30.4% |
II. Core Factors Influencing MOVE's Future Price
Supply Mechanism
-
Market Supply and Demand Dynamics: The fundamental price movement of MOVE is governed by the interplay between market supply and demand. When demand for MOVE increases while supply remains constrained, upward price pressure typically emerges. Conversely, oversupply relative to demand may lead to price corrections.
-
Historical Patterns: Historical data suggests that cryptocurrency prices often exhibit cyclical patterns influenced by supply adjustments and demand fluctuations. During periods of heightened market activity, increased trading volumes and investor interest have historically contributed to price appreciation.
-
Current Influence: Market participants should monitor ongoing supply dynamics and investor sentiment. Shifts in trading volume, liquidity conditions, and holder behavior may signal potential price movements in the near term.
Institutional and Major Holder Activity
-
Institutional Positioning: Institutional interest in digital assets continues to shape market dynamics. While specific institutional holdings in MOVE were not detailed in available materials, broader trends indicate that institutional participation can provide price support and enhance market stability.
-
Corporate Adoption: The adoption of blockchain technology and digital assets by corporations remains a key factor in long-term value creation. Although specific enterprise partnerships involving MOVE were not mentioned, the overall growth of Web3 ecosystems and decentralized applications may indirectly benefit related tokens.
-
Government Policy: Regulatory frameworks and government policies play a significant role in shaping market conditions. Policy shifts related to cryptocurrency oversight, taxation, and international trade may influence investor confidence and market liquidity.
Macroeconomic Environment
-
Monetary Policy Impact: Central bank policies, particularly those related to interest rates and liquidity conditions, have historically influenced risk asset valuations. Expectations of accommodative monetary policy may support demand for alternative assets, while tightening cycles could introduce headwinds.
-
Inflation Hedge Characteristics: Digital assets have occasionally been viewed as hedges against inflation, particularly during periods of currency devaluation or fiscal expansion. However, the effectiveness of this hedge varies depending on broader market conditions and investor sentiment.
-
Geopolitical Factors: International political developments, including trade policies, regulatory coordination, and geopolitical tensions, may impact capital flows and risk appetite. Strategic resource considerations and cross-border policy changes could contribute to volatility in digital asset markets.
Technological Development and Ecosystem Building
-
Technological Progress: Advances in blockchain technology, including improvements in transaction efficiency, scalability, and security, may enhance the utility and adoption of digital assets. Continued innovation in decentralized infrastructure could support long-term ecosystem growth.
-
Ecosystem Applications: The expansion of decentralized applications (DApps) and the broader Web3 ecosystem may drive increased demand for underlying tokens. Growth in areas such as decentralized finance, digital identity, and on-chain governance could contribute to network effects and sustained user engagement.
Investors should consider these multifaceted factors when evaluating MOVE's price trajectory, recognizing that market outcomes depend on the complex interaction of supply dynamics, institutional behavior, macroeconomic conditions, and technological evolution.
III. 2026-2031 MOVE Price Prediction
2026 Outlook
- Conservative Forecast: $0.02466 - $0.03915
- Neutral Forecast: $0.03915 average trading range
- Optimistic Forecast: $0.04894 (requires sustained market momentum and positive adoption trends)
2027-2029 Mid-term Outlook
- Market Stage Expectation: Gradual maturation phase with increasing institutional interest and ecosystem development
- Price Range Forecast:
- 2027: $0.03127 - $0.05858
- 2028: $0.04977 - $0.0626
- 2029: $0.04841 - $0.08372
- Key Catalysts: Network upgrades, strategic partnerships, growing DeFi integration, and broader market recovery trends
2030-2031 Long-term Outlook
- Baseline Scenario: $0.05909 - $0.07034 (assuming stable market conditions and continued ecosystem growth)
- Optimistic Scenario: $0.07034 - $0.07315 (contingent on significant technological breakthroughs and mass adoption)
- Transformative Scenario: $0.05883 - $0.09327 (requires exceptional market conditions, major institutional adoption, and breakthrough use cases)
- 2026-01-17: MOVE demonstrates early-stage growth potential with projected average price around $0.03915
| Year |
Predicted High Price |
Predicted Average Price |
Predicted Low Price |
Price Change |
| 2026 |
0.04894 |
0.03915 |
0.02466 |
1 |
| 2027 |
0.05858 |
0.04404 |
0.03127 |
14 |
| 2028 |
0.0626 |
0.05131 |
0.04977 |
32 |
| 2029 |
0.08372 |
0.05696 |
0.04841 |
47 |
| 2030 |
0.07315 |
0.07034 |
0.05909 |
82 |
| 2031 |
0.09327 |
0.07175 |
0.05883 |
85 |
IV. MOVE Professional Investment Strategies and Risk Management
MOVE Investment Methodology
(1) Long-Term Holding Strategy
- Target Investors: Investors seeking exposure to modular blockchain infrastructure and Move-based ecosystem development
- Operational Recommendations:
- Consider accumulating positions during periods of lower volatility, given the current trading range between $0.03639 and $0.04392
- Implement dollar-cost averaging to mitigate timing risk, particularly given the -95.36% decline from launch price
- Storage Solution: Utilize Gate Web3 Wallet for secure custody with multi-signature protection and regular security audits
(2) Active Trading Strategy
- Technical Analysis Tools:
- Volume Analysis: Monitor the 24-hour trading volume of approximately $1.02 million to identify liquidity trends and potential breakout signals
- Moving Averages: Track short-term (7-day: +11.91%) and medium-term (30-day: +11.20%) momentum indicators to identify entry and exit points
- Swing Trading Key Points:
- Set stop-loss orders around recent support levels near $0.03639 to protect capital
- Take profit targets can be established near the 24-hour high of $0.04392 or psychological resistance levels
MOVE Risk Management Framework
(1) Asset Allocation Principles
- Conservative Investors: 1-3% of crypto portfolio allocation
- Aggressive Investors: 5-8% of crypto portfolio allocation
- Professional Investors: 10-15% with active hedging strategies
(2) Risk Hedging Solutions
- Portfolio Diversification: Balance MOVE exposure with established assets to reduce concentration risk
- Position Sizing: Limit individual position size based on the token's current market cap of approximately $123.4 million and relatively low market dominance of 0.011%
(3) Secure Storage Solutions
- Hot Wallet Recommendation: Gate Web3 Wallet for active trading and quick access to liquidity
- Cold Storage Solution: Hardware wallet solutions for long-term holdings exceeding short-term trading needs
- Security Precautions: Enable two-factor authentication, regularly update security protocols, and never share private keys or seed phrases
V. MOVE Potential Risks and Challenges
MOVE Market Risks
- High Volatility: The token has experienced a 95.36% decline from its all-time high of $1.34, indicating significant price volatility and downside risk
- Limited Liquidity: With a circulating supply representing only 31.79% of total supply and relatively modest trading volume, large transactions may face slippage
- Market Cap Concentration: The low market dominance of 0.011% suggests limited institutional adoption and potential susceptibility to broader market movements
MOVE Regulatory Risks
- Blockchain Infrastructure Oversight: Emerging regulations around modular blockchain architectures may impact operational flexibility
- Token Classification Uncertainty: Evolving regulatory frameworks may affect the classification and trading status of infrastructure tokens
- Cross-Chain Compliance: The project's focus on bridging Move and EVM ecosystems may face complex multi-jurisdictional regulatory requirements
MOVE Technical Risks
- Ecosystem Development Risk: As a relatively new project (launched December 2024), the network's security and performance claims require validation through sustained operational history
- Interoperability Challenges: The technical complexity of bridging different blockchain architectures may encounter unforeseen technical obstacles
- Smart Contract Vulnerabilities: Despite Move's security focus, smart contract risks remain inherent to blockchain systems
VI. Conclusion and Action Recommendations
MOVE Investment Value Assessment
Movement Network presents an interesting proposition within the modular blockchain infrastructure space, particularly with its focus on bridging Move and EVM ecosystems. The project's value proposition centers on enabling developers to build secure, performant, and interoperable applications. However, the significant decline from launch price (-95.36%) and limited market dominance (0.011%) indicate substantial early-stage risks. Recent positive momentum (7-day: +11.91%, 30-day: +11.20%) suggests potential stabilization, but investors should carefully weigh the speculative nature of this investment against established blockchain infrastructure alternatives.
MOVE Investment Recommendations
✅ Beginners: Consider waiting for clearer adoption metrics and ecosystem development milestones before allocating capital; if participating, limit exposure to less than 2% of crypto portfolio
✅ Experienced Investors: Employ dollar-cost averaging strategies with strict position sizing rules; monitor development progress and ecosystem growth metrics closely
✅ Institutional Investors: Conduct thorough due diligence on technical architecture and team credentials; consider pilot allocations with comprehensive risk hedging protocols
MOVE Trading Participation Methods
- Spot Trading: Direct purchase and holding through Gate.com with limit orders to optimize entry prices
- Portfolio Integration: Include MOVE as part of a diversified blockchain infrastructure allocation strategy
- Research-Driven Approach: Monitor project development milestones, partnership announcements, and ecosystem adoption metrics before increasing position sizes
Cryptocurrency investment carries extremely high risks, and this article does not constitute investment advice. Investors should make cautious decisions based on their own risk tolerance and are advised to consult professional financial advisors. Never invest more than you can afford to lose.
FAQ
What is MOVE token? What are its practical applications and value?
MOVE is the utility token of Movement Network ecosystem, used to pay network fees and incentivize participants. It drives network development and maintenance, enabling long-term growth of the Movement Network platform through various applications.
How to analyze MOVE token price trends? What technical indicators and fundamental factors should be monitored?
Focus on technical indicators like moving averages, RSI, and MACD for price signals. Monitor trading volume, market sentiment, and ecosystem developments. Track support/resistance levels and trend formations for optimal entry/exit points.
What are the risk factors for MOVE token price prediction? What should I pay attention to before investing?
MOVE price is influenced by market volatility, technology development, and regulatory changes. Monitor market sentiment, token supply dynamics, trading volume, and adoption trends before investing.
What are the differences and advantages of MOVE token compared to other mainstream cryptocurrencies?
MOVE token excels in interoperability between Move and EVM ecosystems with superior security architecture. Its innovative DeFi solutions and unique positioning provide significant competitive advantages in the blockchain market.
MOVE代币未来的市场前景和发展潜力如何?
MOVE代币具有强大的技术创新基础和生态发展潜力。随着区块链应用场景扩展,MOVE的跨链兼容性和代币经济学设计将驱动长期增长,市场前景看好。
* The information is not intended to be and does not constitute financial advice or any other recommendation of any sort offered or endorsed by Gate.