This article analyzes the NanoByte (NBT) price trends from 2025 to 2030, offering expert insights and market forecasts to guide investors. It examines historical price evolution, current market status, and factors influencing future prices. Key sections include NBT's investment strategies and risk management, highlighting market risks, regulatory concerns, and technical challenges. Ideal for investors interested in DeFi integration with traditional finance, the report leverages analysis tools, market sentiment, and strategic frameworks. Discover trading strategies and forecast scenarios on Gate's platform, ensuring informed decision-making.
Introduction: NBT's Market Position and Investment Value
NanoByte (NBT), a bridge token connecting cryptocurrency with real-world financial applications, has been operating since its launch in March 2022. As of December 2025, NBT has achieved a market capitalization of $2,037,527.51, with a circulating supply of approximately 1.29 billion tokens, currently trading at $0.0015796. This innovative asset, designed to integrate cryptocurrency with FIAT products such as electronic currency, credit cards, insurance, and other investments, is increasingly playing a key role in making decentralized finance mainstream and legitimate.
This article will comprehensively analyze NBT's price trends from 2025 to 2030, integrating historical patterns, market supply and demand dynamics, ecosystem development, and macroeconomic factors to provide investors with professional price forecasts and practical investment strategies.
I. NBT Price History Review and Current Market Status
NBT Historical Price Evolution Trajectory
- March 2022: NBT reached its all-time high of $0.057054, marking the peak of the token's value since launch.
- November 2025: NBT reached its all-time low of $0.00070979, representing a significant decline from historical highs.
- 2022-2025: The token has experienced a prolonged bear market cycle, depreciating approximately 98.76% from its peak to current levels.
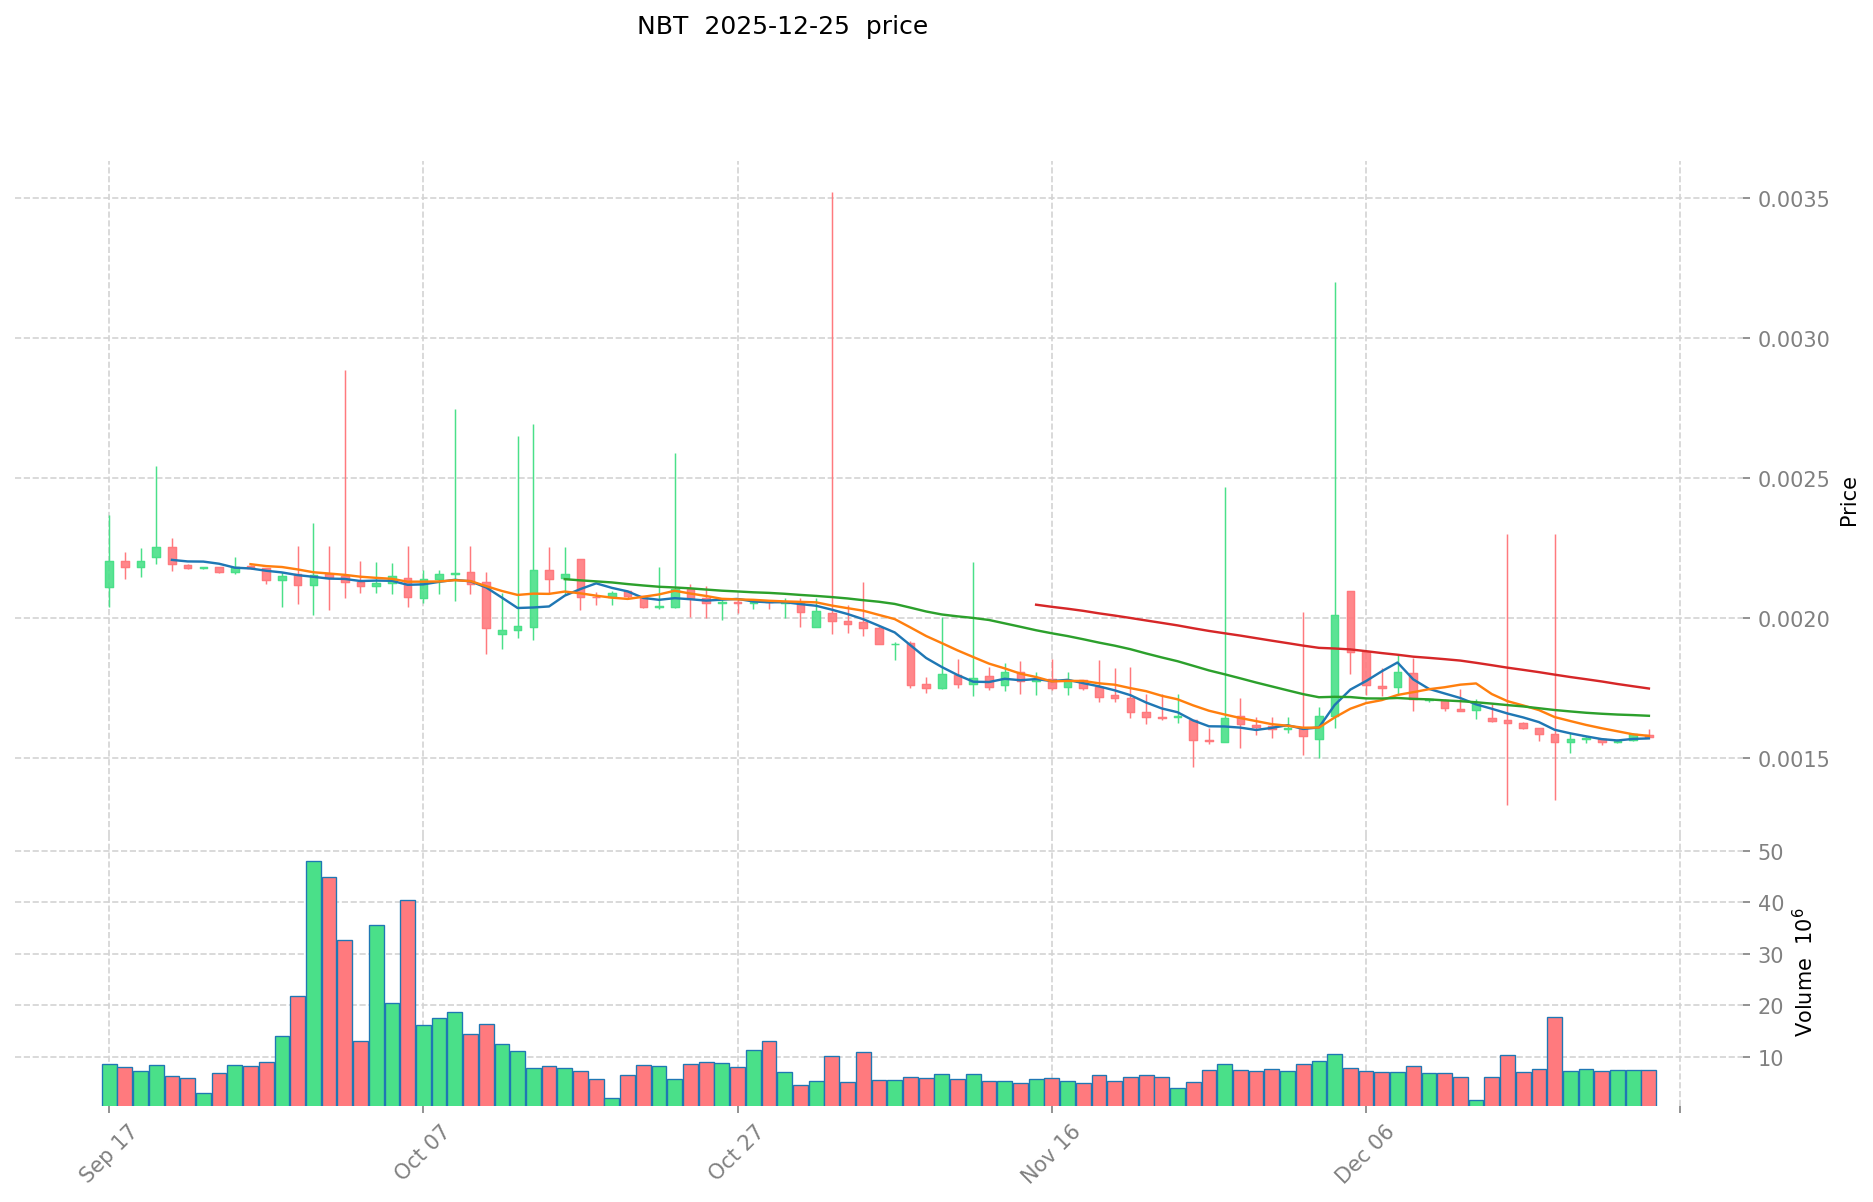
NBT Current Market Landscape
As of December 25, 2025, NBT is trading at $0.0015796, with a 24-hour trading volume of $11,620.32. The token currently ranks #2123 by market capitalization, with a fully diluted valuation of approximately $15.76 million. The circulating supply stands at 1.29 billion NBT tokens out of a maximum supply of 9.98 billion tokens, representing approximately 12.92% circulation.
In terms of recent price movements, NBT has shown slight weakness, declining 0.2% over the past hour and 24 hours, with a 7-day decline of 0.42% and a 30-day decline of 1.06%. On a yearly basis, the token has depreciated 6.05% from its previous price level one year ago.
The token currently maintains a market share of 0.0049% of the total cryptocurrency market. With 104 holders and listings on 2 exchanges, NBT maintains a relatively limited trading presence. The token is available on the Ethereum (ETH) and Binance Smart Chain (BSC) networks, with active contract deployments on both chains.
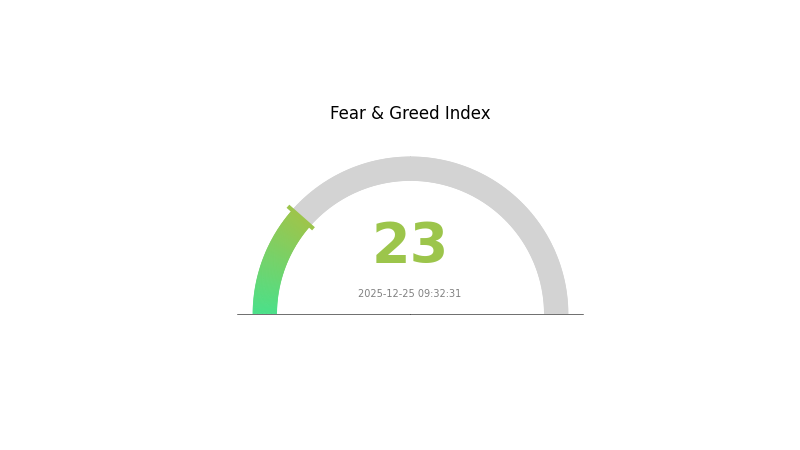
Current market sentiment indicators suggest "Extreme Fear" conditions (VIX: 23), reflecting broader market pessimism during this period.
Click to view current NBT market price
NBT Market Sentiment Indicator
2025-12-25 Fear and Greed Index: 23 (Extreme Fear)
Click to view current Fear & Greed Index
The crypto market is experiencing extreme fear, with the index hitting 23. This indicates significant investor anxiety and pessimism across the sector. During periods of extreme fear, markets often reach capitulation points where panic selling accelerates. Experienced traders monitor these conditions closely, as they may present potential buying opportunities for long-term investors. However, heightened volatility and downside risks remain present. Market participants should exercise caution, conduct thorough research, and consider their risk tolerance before making investment decisions on Gate.com.
NBT Holdings Distribution
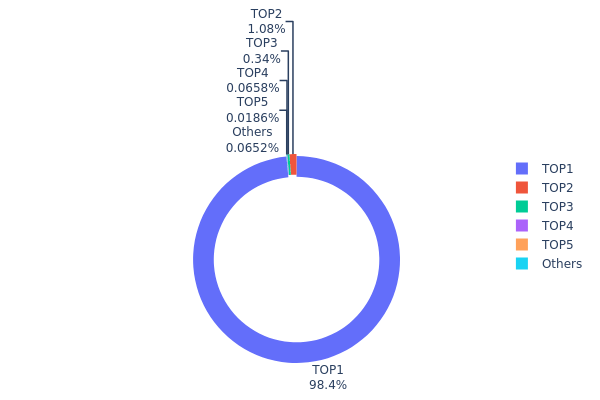
The address holdings distribution map illustrates the concentration of NBT tokens across blockchain addresses, revealing the degree of token centralization and the distribution pattern among major stakeholders. This metric serves as a critical indicator for assessing market structure, potential manipulation risks, and the overall health of the token's decentralization.
The current NBT holdings distribution exhibits severe concentration characteristics. The top address (0x63e5...c51c00) controls 984,334.04K tokens, representing 98.43% of total supply. This extraordinarily high concentration level indicates that the token remains overwhelmingly centralized, with nearly all circulating supply held by a single entity. The second-largest holder maintains only 1.07% of supply, creating an extreme disparity. Combined, the top five addresses account for 99.91% of all NBT tokens, while the remaining holders collectively possess less than 0.09%, demonstrating acute concentration in a minimal number of addresses.
This pronounced centralization poses significant implications for market dynamics and structural stability. The overwhelming dominance of a single address raises considerable concerns regarding price manipulation potential and market vulnerability to sudden liquidity events or token transfers. Such extreme concentration undermines the token's decentralized characteristics and suggests limited circulation in active trading markets. The minimal holdings distributed among other addresses indicates restricted market participation and potentially limited organic demand. Furthermore, the structural imbalance reflects a developmental stage where token distribution remains concentrated among early stakeholders or project entities, rather than dispersed across a broad ecosystem of users and investors.
Click to view current NBT holdings distribution
| Top |
Address |
Holding Qty |
Holding (%) |
| 1 |
0x63e5...c51c00 |
984334.04K |
98.43% |
| 2 |
0xd51d...01e764 |
10768.21K |
1.07% |
| 3 |
0x0d07...b492fe |
3402.67K |
0.34% |
| 4 |
0xd2ff...722c66 |
657.98K |
0.06% |
| 5 |
0xcea5...4c098a |
185.56K |
0.01% |
| - |
Others |
651.54K |
0.089999999999989% |
II. Core Factors Influencing NBT's Future Price
Macroeconomic Environment
- Inflation Hedge Attribute: As a cryptocurrency asset, NBT possesses potential inflation-hedging capabilities. Its specific performance is influenced by multiple market and environmental factors.
Geopolitical Factors
- International geopolitical situations have direct impacts on NBT's price movements and market sentiment.
Market Sentiment and Investor Confidence
- Market Sentiment Impact: Investor emotions and confidence directly influence NBT price trends. When the market receives news about NBT's widespread adoption or major technological breakthroughs, it can significantly affect trading activity and price direction.
Policy and Regulatory Environment
- Regulatory Monitoring: Policy monitoring and regulatory frameworks represent key factors affecting NBT's price trajectory. Changes in cryptocurrency regulations across different jurisdictions can create substantial price volatility.
III. 2025-2030 NBT Price Forecast
2025 Outlook
- Conservative Forecast: $0.00101 - $0.00158
- Neutral Forecast: $0.00158
- Bullish Forecast: $0.00178 (requires sustained market momentum)
2026-2028 Medium-term Outlook
- Market Stage Expectation: Gradual recovery and consolidation phase with incremental growth trajectory
- Price Range Forecast:
- 2026: $0.00123 - $0.00228
- 2027: $0.00176 - $0.00291
- 2028: $0.00176 - $0.00257
- Key Catalysts: Ecosystem development expansion, increased institutional adoption, technological improvements, and market sentiment stabilization
2029-2030 Long-term Outlook
- Base Case Scenario: $0.00203 - $0.00372 (assuming stable regulatory environment and moderate market growth)
- Bullish Scenario: $0.00364 - $0.00372 (contingent on accelerated adoption and positive macroeconomic conditions)
- Transformative Scenario: $0.00372+ (requires breakthrough technological advancement and mainstream institutional participation)
- December 25, 2025: NBT trading within consolidation range (market equilibrium phase)
Note: All price forecasts are derived from analytical models and should be regarded as reference points rather than guaranteed predictions. Investors are advised to conduct thorough due diligence and consider risk management strategies when trading NBT on platforms such as Gate.com.
| 年份 |
预测最高价 |
预测平均价格 |
预测最低价 |
涨跌幅 |
| 2025 |
0.00178 |
0.00158 |
0.00101 |
0 |
| 2026 |
0.00228 |
0.00168 |
0.00123 |
6 |
| 2027 |
0.00291 |
0.00198 |
0.00176 |
25 |
| 2028 |
0.00257 |
0.00245 |
0.00176 |
54 |
| 2029 |
0.00364 |
0.00251 |
0.00236 |
58 |
| 2030 |
0.00372 |
0.00307 |
0.00203 |
94 |
NBT (NanoByte) Professional Investment Strategy and Risk Management Report
IV. NBT Professional Investment Strategy and Risk Management
NBT Investment Methodology
(1) Long-term Hold Strategy
- Target Investors: Cryptocurrency enthusiasts seeking exposure to DeFi infrastructure, investors with medium to long-term investment horizons (12+ months), and those believing in the mainstream adoption of decentralized finance.
- Operational Recommendations:
- Accumulate NBT during market downturns when prices approach support levels, leveraging dollar-cost averaging to reduce timing risk
- Monitor the project's development milestones and partnership announcements to assess fundamental progress toward mainstream DeFi adoption
- Maintain positions through market volatility, as long-term value capture requires weathering short-term price fluctuations
(2) Active Trading Strategy
- Technical Analysis Tools:
- Support and Resistance Levels: Identify key price points at $0.0015796 (current price) and $0.00070979 (all-time low), using these levels to establish entry and exit positions
- Price Volatility Indicators: Monitor the 24-hour high-low range ($0.0015796 to $0.0015764) to assess intraday volatility and trading opportunities
- Wave Trading Key Points:
- Execute buy orders near identified support levels when market sentiment becomes oversold
- Take partial profits during temporary price recoveries, particularly when approaching resistance zones
NBT Risk Management Framework
(1) Asset Allocation Principles
- Conservative Investors: 1-3% of total portfolio
- Active Investors: 3-5% of total portfolio
- Professional Investors: 5-10% of total portfolio
(2) Risk Hedging Solutions
- Diversification Strategy: Combine NBT holdings with other DeFi-focused tokens and traditional cryptocurrency assets to reduce single-asset concentration risk
- Position Sizing: Implement strict position limits based on individual risk tolerance, ensuring no single trade exceeds 2-5% of total capital
(3) Secure Storage Solutions
- Hot wallet Strategy: Use Gate.com platform for active trading and frequent transactions, taking advantage of the exchange's security infrastructure
- Cold Storage Approach: For long-term holdings, transfer NBT to self-custody solutions, ensuring private keys remain under personal control
- Security Considerations: Enable two-factor authentication on all exchange accounts, regularly audit wallet addresses for unauthorized activity, and never share private keys or recovery phrases with third parties
V. NBT Potential Risks and Challenges
NBT Market Risks
- High Volatility Exposure: NBT has experienced a 72.3% decline from all-time high ($0.057054 in March 2022) to current price ($0.0015796), indicating substantial price volatility that could lead to significant losses
- Low Liquidity Conditions: With 24-hour trading volume of $11,620.32 and a circulating market cap of $2,037,527.51, the token demonstrates limited liquidity, potentially causing slippage during large trades
- Market Concentration: Trading on only 2 exchanges limits accessibility and increases vulnerability to exchange-specific risks
NBT Regulatory Risks
- Unclear Regulatory Status: The integration of cryptocurrency with FIAT products (credit cards, insurance, investments) may attract increased regulatory scrutiny from financial authorities
- Compliance Uncertainty: Operating at the intersection of DeFi and traditional finance creates ambiguity regarding applicable regulations in different jurisdictions
- Geographic Restrictions: Regulatory changes in major markets could limit platform access and reduce user adoption
NBT Technical Risks
- Smart Contract Vulnerabilities: As an Ethereum and BSC-based token, NBT is exposed to potential bugs or exploits within contract code
- Blockchain Network Risks: Congestion or failures on Ethereum or Binance Smart Chain could impact transaction processing and token transferability
- Upgrade Execution Risk: Any future protocol upgrades carry implementation risks that could affect token functionality or security
VI. Conclusions and Action Recommendations
NBT Investment Value Assessment
NBT represents a specialized DeFi bridge token targeting the mainstream integration of decentralized finance with traditional financial products. However, the token faces significant headwinds including substantial price decline from historical highs, limited market liquidity, minimal trading volume, and low market dominance (0.00049%). While the project's vision of legitimizing decentralized finance holds conceptual merit, current market metrics suggest the token remains in an early or challenged phase of adoption. Investors should approach NBT with cautious skepticism, recognizing both its potential upside in a mature DeFi ecosystem and substantial downside risks from current valuations.
NBT Investment Recommendations
✅ Beginners: Start with minimal allocations (0.5-1% of total portfolio) through Gate.com platform, using limit orders to enter positions at identified support levels while building familiarity with the token's price action and fundamental development
✅ Experienced Investors: Implement dollar-cost averaging strategies over 6-12 month periods, monitoring technical indicators and project milestones while maintaining strict stop-loss orders at 15-20% below entry prices
✅ Institutional Investors: Conduct comprehensive due diligence on the project team, development roadmap, and regulatory compliance measures before considering any positions; implement sophisticated hedging strategies to manage portfolio volatility
NBT Trading Participation Methods
- Exchange Trading: Access NBT directly through Gate.com's spot trading platform, offering secure execution and institutional-grade infrastructure
- Limit Order Strategy: Utilize Gate.com's advanced order types to set predetermined entry and exit prices, eliminating emotion from trading decisions
- Portfolio Rebalancing: Periodically review NBT holdings as part of broader portfolio maintenance, adjusting allocations based on evolving risk assessments and market conditions
Cryptocurrency investment carries extreme risk. This report does not constitute investment advice. Investors must make decisions based on personal risk tolerance and should consult professional financial advisors. Never invest more than you can afford to lose.
FAQ
What is NBT crypto?
NBT crypto is a decentralized finance (DeFi) token designed to promote cryptocurrency adoption in Indonesia. It operates on blockchain technology and functions within the NanoByte ecosystem for digital asset management.
What is the current price of NBT and what factors influence it?
NBT price fluctuates based on market demand, trading volume, token utility, ecosystem developments, and broader crypto market sentiment. Real-time pricing varies; check reliable data sources for current rates. Key influencers include adoption growth, partnerships, and regulatory updates.
What is the price prediction for NBT in 2025?
Based on current market trends and a 5% annual growth rate, NBT is predicted to reach approximately $0.001598 by December 2025. This forecast reflects expected market momentum and trading volume patterns throughout the year.
What are the risks and opportunities for NBT price growth in the long term?
Long-term NBT price growth faces risks from regulatory changes and market volatility, while opportunities emerge from increased adoption, ecosystem development, and potential institutional interest driving sustained demand.
* The information is not intended to be and does not constitute financial advice or any other recommendation of any sort offered or endorsed by Gate.