The article provides an expert analysis and market forecast for OBOL's price from 2025 through 2030. It evaluates OBOL's historical price trends, market status, and key factors affecting future valuation, offering insights into technology developments and institutional dynamics. The piece is tailored for investors seeking entry points, portfolio diversification, or long-term infrastructure exposure in Web3. It outlines investment and risk management strategies for different investor profiles. With a focus on price predictions, the article equips readers with data-driven insights to inform trading on Gate, enhancing decision-making amidst market volatility.
Introduction: OBOL's Market Position and Investment Value
OBOL (OBOL) serves as a foundational infrastructure token for decentralized operator ecosystems across Web3. As the core of the Obol Collective, it powers distributed validator networks that secure over $1 billion in value across blockchains. As of December 2025, OBOL's market capitalization stands at approximately $10.92 million, with a circulating supply of 138.32 million tokens trading at around $0.02183. This asset, recognized for its role in democratizing digital infrastructure, is increasingly playing a critical role in enabling high-performance, slashing-resistant validation and decentralized infrastructure deployment across Layer 1 blockchains, Layer 2 solutions, DePIN protocols, AI agents, and AVS networks.
This article will comprehensively analyze OBOL's price trajectory from 2025 through 2030, integrating historical patterns, market supply-demand dynamics, ecosystem development, and macroeconomic factors to provide investors with professional price forecasts and actionable investment strategies. Whether you are seeking entry points, portfolio diversification opportunities, or long-term exposure to the infrastructure layer of Web3, this guide equips you with data-driven insights to make informed decisions on Gate.com and other major trading venues.
I. OBOL Price History Review and Market Status
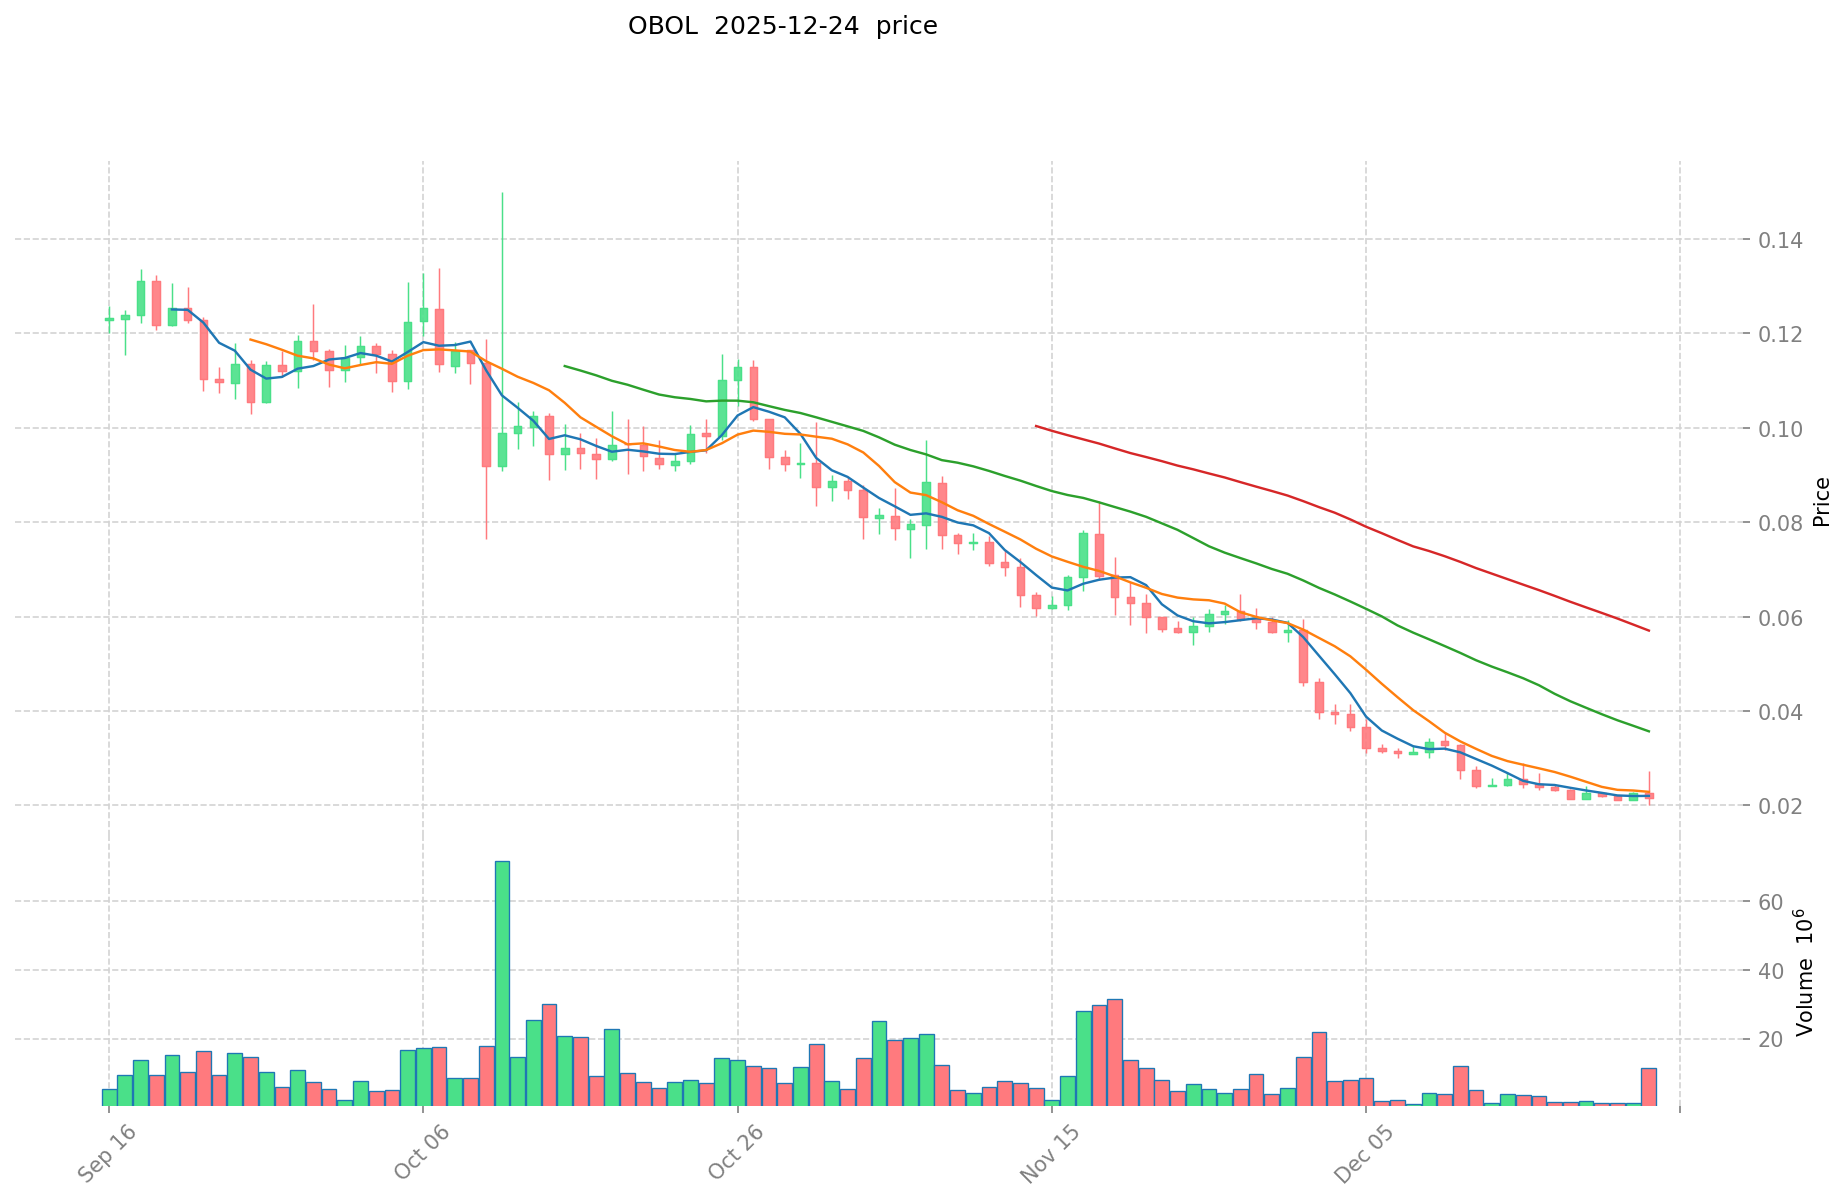
OBOL Historical Price Evolution
OBOL reached its all-time high of $0.4211 on May 7, 2025, representing a significant peak in the token's trading history. Subsequently, the token has experienced substantial downward pressure throughout 2025. By December 24, 2025, OBOL touched its all-time low of $0.01973, marking a dramatic 94.92% decline from its annual peak.
The one-year performance shows a sharp contraction, with the token losing approximately $0.4079 from its highest valuation point. This extended bearish trend reflects broader market dynamics and sentiment shifts within the cryptocurrency sector.
OBOL Current Market Landscape
As of December 24, 2025, OBOL is trading at $0.02183, representing a 1.49% gain over the past hour but down 2.42% over the last 24 hours. The token has lost 8.12% of its value in the past seven days and 60.6% over the previous month, indicating sustained selling pressure.
The 24-hour trading range shows OBOL fluctuating between a high of $0.02722 and a low of $0.01973, with 24-hour trading volume reaching $436,661.67. The market capitalization stands at approximately $3,019,525.60, with a fully diluted valuation of $10,915,000.
Currently, 138.32 million OBOL tokens are in circulation out of a maximum supply of 500 million, representing 27.66% of total available tokens. The circulating supply accounts for 19.25% of the fully diluted valuation. The token is listed on 16 exchanges and maintained by 5,958 holders.
Market sentiment reflects extreme fear, with a VIX reading of 24, indicating heightened volatility and risk aversion across crypto markets.
Click to view current OBOL market price
OBOL Market Sentiment Indicator
2025-12-24 Fear and Greed Index: 24 (Extreme Fear)
Click to view current Fear & Greed Index
The crypto market is currently experiencing extreme fear, with the Fear and Greed Index dropping to 24. This indicates severe market pessimism and heightened investor anxiety. During such periods, market volatility typically increases as traders react to negative sentiment. However, extreme fear often presents opportunities for long-term investors, as assets may be undervalued. Monitor market developments closely on Gate.com to identify potential entry points while managing risk carefully during this high-uncertainty phase.

OBOL Holdings Distribution
The address holdings distribution chart illustrates the concentration of OBOL tokens across blockchain wallets, measuring the percentage of total token supply held by individual addresses. This metric serves as a critical indicator of token decentralization, market structure stability, and potential vulnerability to coordinated price manipulation or significant liquidity events.
Analysis of the current OBOL holdings data reveals a moderately concentrated distribution pattern. The top five addresses collectively control approximately 38.7% of the circulating supply, with the largest holder commanding 13.43%. While this concentration level is not indicative of extreme centralization, it does suggest meaningful influence concentrated among a limited number of stakeholders. The remaining 61.3% of tokens distributed among other addresses provides a degree of diversification that mitigates single-entity domination risks. However, the significant gap between the largest holder and the subsequent addresses indicates an asymmetric distribution structure.
From a market structure perspective, this concentration profile presents both stabilizing and risk factors. The substantial holdings by top addresses could potentially support long-term price stability through reduced panic selling pressure, yet simultaneously creates vulnerability to sudden liquidation events or coordinated sell-offs that could trigger significant price volatility. The decentralization ratio of approximately 61.3% held by dispersed addresses reflects a reasonable level of community participation and reduces systemic risks associated with token concentration. Overall, OBOL's current holdings distribution demonstrates moderate decentralization characteristics, though continued monitoring of large holder movements remains essential for assessing market resilience and on-chain structure sustainability.
Visit OBOL Holdings Distribution on Gate.com for real-time data.

| Top |
Address |
Holding Qty |
Holding (%) |
| 1 |
0xaefd...fef5fb |
67186.76K |
13.43% |
| 2 |
0x42d2...c1fa72 |
37507.19K |
7.50% |
| 3 |
0x872a...6eb205 |
32255.03K |
6.45% |
| 4 |
0xdc8a...e4c374 |
29637.31K |
5.92% |
| 5 |
0x1986...f5d227 |
27001.73K |
5.40% |
| - |
Others |
306411.98K |
61.3% |
II. Core Factors Influencing OBOL's Future Price
Technology Development and Ecosystem Construction
-
Distributed Validator Technology (DVT): DVT represents a breakthrough innovation that fundamentally transforms the Ethereum staking ecosystem. This technology enables liquid staking pools to distribute their shares among multiple operators, significantly reducing risk for individual stakers and mitigating slashing risks. Institutions can also leverage DVT to reduce operational and hardware costs, creating a more decentralized staking environment through improved efficiency and higher LSD staking performance.
-
Mainnet Expansion and Integration: Obol Network, developed by the creators of the original Eth2 Stake Launchpad, serves as a staking infrastructure coordination layer utilizing DVT technology. The project is currently in the Alpha Launch phase, collaborating with release partners who have already deployed initial decentralized validators on mainnet. Beyond Ethereum, Obol plans to explore scaling solutions for Ethereum Layer 2s and Cosmos, as the team believes DVT can make significant contributions to other Proof-of-Stake ecosystems, with Cosmos being a priority.
-
Ecosystem Applications: Obol Network has successfully integrated with major liquid staking protocols including Stakewise, Rocket Pool, and Lido. Lido conducted two initial pilot projects post-merge, successfully demonstrating DVT deployment configuration capabilities within the Lido node operator registry on Goerli testnet. This integration demonstrates practical adoption pathways and validates the technology's real-world applicability.
Institutional and Major Holder Dynamics
- Institutional Backing: Obol Network has secured substantial investment from prominent venture capital firms including Pantera Capital and Archetype. Archetype co-led the Series A funding round, with the company raising USD 12.5 million, signaling strong institutional confidence in the project's long-term vision and execution capability.
Three. OBOL Price Prediction for 2025-2030
2025 Outlook
- Conservative Prediction: $0.01736 - $0.02225
- Neutral Prediction: $0.02225
- Optimistic Prediction: $0.02537 (requires sustained market recovery and increased institutional adoption)
2026-2028 Medium-term Outlook
- Market Stage Expectation: Gradual accumulation phase with steady growth trajectory, characterized by infrastructure maturation and expanding use cases within the Ethereum ecosystem.
- Price Range Prediction:
- 2026: $0.01571 - $0.03024 (+7% YoY)
- 2027: $0.01756 - $0.0308 (+22% YoY)
- 2028: $0.02255 - $0.03296 (+30% YoY)
- Key Catalysts: Enhanced liquidity on platforms like Gate.com, increased staking participation, integration with major DeFi protocols, and broader market sentiment improvements
2029-2030 Long-term Outlook
- Base Case: $0.01949 - $0.04022 in 2029 with +39% growth, progressing to $0.03024 - $0.04518 in 2030 with +60% cumulative growth (assumes moderate adoption and stable macroeconomic conditions)
- Optimistic Case: $0.04022 - $0.04518 by 2030 (requires significant institutional inflows and breakthrough in protocol upgrades)
- Transformative Case: Exceeding $0.045 threshold (contingent upon major ecosystem developments, regulatory clarity, and exponential network effects)
Note: All price predictions are based on historical data analysis and market trend modeling. Actual market conditions may vary significantly due to regulatory changes, macroeconomic factors, and technological developments.
| 年份 |
预测最高价 |
预测平均价格 |
预测最低价 |
涨跌幅 |
| 2025 |
0.02537 |
0.02225 |
0.01736 |
0 |
| 2026 |
0.03024 |
0.02381 |
0.01571 |
7 |
| 2027 |
0.0308 |
0.02702 |
0.01756 |
22 |
| 2028 |
0.03296 |
0.02891 |
0.02255 |
30 |
| 2029 |
0.04022 |
0.03094 |
0.01949 |
39 |
| 2030 |
0.04518 |
0.03558 |
0.03024 |
60 |
OBOL Investment Strategy and Risk Management Report
IV. OBOL Professional Investment Strategy and Risk Management
OBOL Investment Methodology
(1) Long-Term Holding Strategy
- Target Investors: Infrastructure-focused investors, Web3 believers, and those seeking exposure to decentralized validator ecosystems
- Operational Recommendations:
- Accumulate during periods of market weakness, particularly given the -60.6% decline over 30 days, which may represent oversold conditions
- Hold through market cycles to benefit from potential ecosystem growth as Obol expands beyond Ethereum to broader Web3 applications
- Participate in Obol's distributed validator network to generate staking rewards alongside token appreciation
(2) Active Trading Strategy
- Technical Analysis Tools:
- Support and Resistance Levels: Monitor the 52-week high of $0.4211 and recent low of $0.01973 to identify potential reversal points
- Volume Analysis: Track the 24-hour volume of approximately $436,661 to assess market liquidity and trend strength
- Wave Trading Key Points:
- Entry opportunities may emerge near the all-time low ($0.01973) established on December 24, 2025, with stop-loss below previous support levels
- Exit targets should be set at technical resistance levels, with particular attention to the -94.92% year-to-date decline requiring careful position sizing
OBOL Risk Management Framework
(1) Asset Allocation Principles
- Conservative Investors: 1-2% of total portfolio allocation
- Active Investors: 2-5% of total portfolio allocation
- Professional Investors: 5-10% of total portfolio allocation
(2) Risk Hedging Solutions
- Portfolio Diversification: Balance OBOL holdings with established Layer 1 and Layer 2 protocols to reduce concentration risk
- Position Sizing: Implement strict position limits given the extreme volatility, with maximum loss per trade capped at 1-2% of total capital
(3) Secure Storage Solutions
- Cold Storage Recommendation: For significant holdings, utilize institutional-grade custody solutions that support ERC-20 token standards
- Hot Wallet Management: For active trading, maintain only necessary amounts on Gate.com's Web3 wallet for seamless trading and withdrawal capabilities
- Security Precautions: Enable multi-factor authentication, use hardware wallet backups for seed phrase storage, and never share private keys or recovery phrases
V. OBOL Potential Risks and Challenges
OBOL Market Risks
- Extreme Price Volatility: The token has declined 94.92% over one year and 60.6% over 30 days, indicating significant downward pressure and extreme market instability
- Liquidity Risk: With only 16 exchanges listing OBOL and relatively modest 24-hour trading volume of $436,661, liquidity may be insufficient for large position exits
- Market Sentiment: Current bearish momentum with negative returns across all measured timeframes (1H: +1.49% exception, 24H: -2.42%, 7D: -8.12%) reflects weak investor confidence
OBOL Regulatory Risks
- Evolving Compliance Framework: As decentralized validator infrastructure gains prominence, regulatory uncertainty surrounding staking operations and validator protocols may impact operations
- Jurisdictional Challenges: Different regulatory approaches to decentralized infrastructure across major markets could constrain adoption or revenue streams
- Classification Ambiguity: Regulatory bodies may reclassify Obol's token or validator rewards in ways that affect tax treatment and legal status
OBOL Technology Risks
- Smart Contract Vulnerabilities: Distributed validator technology introduces complex technical architecture where bugs or exploits could compromise network security or user funds
- Ethereum Dependency: Heavy reliance on Ethereum's ongoing development and security means that Layer 1 network risks directly impact Obol's infrastructure
- Adoption Execution Risk: Successfully expanding the Obol Stack to L1s, L2s, DePIN, AVS, and AI agents requires flawless technical integration and developer adoption
VI. Conclusion and Action Recommendations
OBOL Investment Value Assessment
Obol presents a compelling infrastructure narrative targeting the democratization of decentralized validator operations and Web3 infrastructure. With over 800 operators currently securing $1B in value through Obol Distributed Validators, the project has demonstrated meaningful adoption. However, the token faces significant headwinds: a 94.92% year-to-date decline, extreme volatility, and limited exchange liquidity suggest considerable market skepticism about near-term prospects. The long-term value proposition depends critically on successful execution of the Obol Stack's expansion roadmap and sustained growth in the decentralized operator ecosystem. Current price levels may attract opportunistic investors with high risk tolerance, but the project remains speculative.
OBOL Investment Recommendations
✅ Beginners: Start with micro-positions (0.5-1% of portfolio) using dollar-cost averaging over 6-12 months to build exposure while reducing timing risk. Focus on understanding Obol's validator infrastructure benefits before committing capital.
✅ Experienced Investors: Consider tactical accumulation near technical support levels following fundamental research into Obol's ecosystem growth metrics. Implement strict stop-loss orders at 10-15% below entry to manage downside risk.
✅ Institutional Investors: Evaluate Obol as a core infrastructure holding only after thorough due diligence on technical architecture, regulatory compliance, and competitive positioning. Consider allocation sizes of 2-5% within alternative infrastructure mandates with appropriate oversight.
OBOL Trading Participation Methods
- Gate.com Spot Trading: Execute direct OBOL/USDT trading pairs on Gate.com for immediate exposure with real-time pricing and deep liquidity
- Limit Orders: Utilize Gate.com's advanced order types to establish predetermined entry and exit prices, reducing emotional decision-making
- Portfolio Rebalancing: Periodically review OBOL's weighting relative to other holdings to maintain target allocation percentages and risk parameters
Cryptocurrency investment carries extreme risk. This report does not constitute investment advice. Investors should make decisions based on their individual risk tolerance and consult professional financial advisors. Never invest more than you can afford to lose.
FAQ
How much is OBOL token worth?
As of December 24, 2025, OBOL token has a market capitalization of $2.8K with a circulating supply of 997.3 million tokens. The token's value reflects its market position and trading activity across supported platforms.
How much is an OBOL worth today?
OBOL is worth approximately $0.02090 today. The price fluctuates based on market conditions and trading volume. For real-time pricing, check major cryptocurrency data platforms.
What is OBOL token and what is its use case?
OBOL is the governance token of Obol Collective, enabling decentralized management of Web3 infrastructure. It drives operator network construction and facilitates protocol governance decisions within the ecosystem.
What factors influence OBOL token price?
OBOL token price is influenced by user activity, market liquidity, supply and demand dynamics, and broader cryptocurrency market trends. Network adoption and trading volume also impact price movements significantly.
What is the price prediction for OBOL in 2025?
Based on market indicators, OBOL is expected to trade between $0.35165 and $0.37363 by the end of 2025. However, cryptocurrency prices are highly volatile and unpredictable.
* The information is not intended to be and does not constitute financial advice or any other recommendation of any sort offered or endorsed by Gate.