This comprehensive analysis examines Optimism (OP) token's market position and value potential through 2031. Currently trading at $0.3613 with a $702.4M market cap, OP serves as a critical Ethereum Layer 2 scaling solution addressing high gas fees and network congestion. The article synthesizes historical price trends, institutional backing from Paradigm and A16z, ecosystem expansion metrics showing 35.2% Layer 2 TVL share, and macroeconomic factors to deliver multi-year price forecasts ranging from $0.28244 to $0.90823 by 2031. Readers will discover professional investment methodologies including dollar-cost averaging strategies, risk management frameworks with proper position sizing, and secure storage solutions via Gate Web3 Wallet. The analysis also addresses critical challenges including token unlock events, regulatory uncertainties, and competitive Layer 2 landscape, providing actionable guidance for investors across experience levels.
Introduction: OP's Market Position and Investment Value
Optimism (OP), positioned as an Ethereum Layer 2 scaling solution, has been developing its ecosystem since its inception in 2022. As of 2026, OP maintains a market capitalization of approximately $702.40 million, with a circulating supply of around 1.94 billion tokens, and the price hovering around $0.36. This asset, recognized for its low-cost and high-speed transaction capabilities, is playing an increasingly significant role in enhancing Ethereum's scalability and user experience.
This article will comprehensively analyze OP's price trends from 2026 to 2031, incorporating historical patterns, market supply and demand dynamics, ecosystem development, and macroeconomic factors to provide investors with professional price forecasts and practical investment strategies.
I. OP Price History Review and Current Market Status
OP Historical Price Evolution Trajectory
- 2022: Optimism launched its native governance token OP in June, entering the market during a challenging period for the broader cryptocurrency sector.
- 2024: OP reached a notable price level of $4.84 on March 6, marking a significant milestone in its trading history as market conditions improved.
- 2025: The market experienced considerable volatility, with OP declining from previous elevated levels to $0.251922 on December 26.
OP Current Market Situation
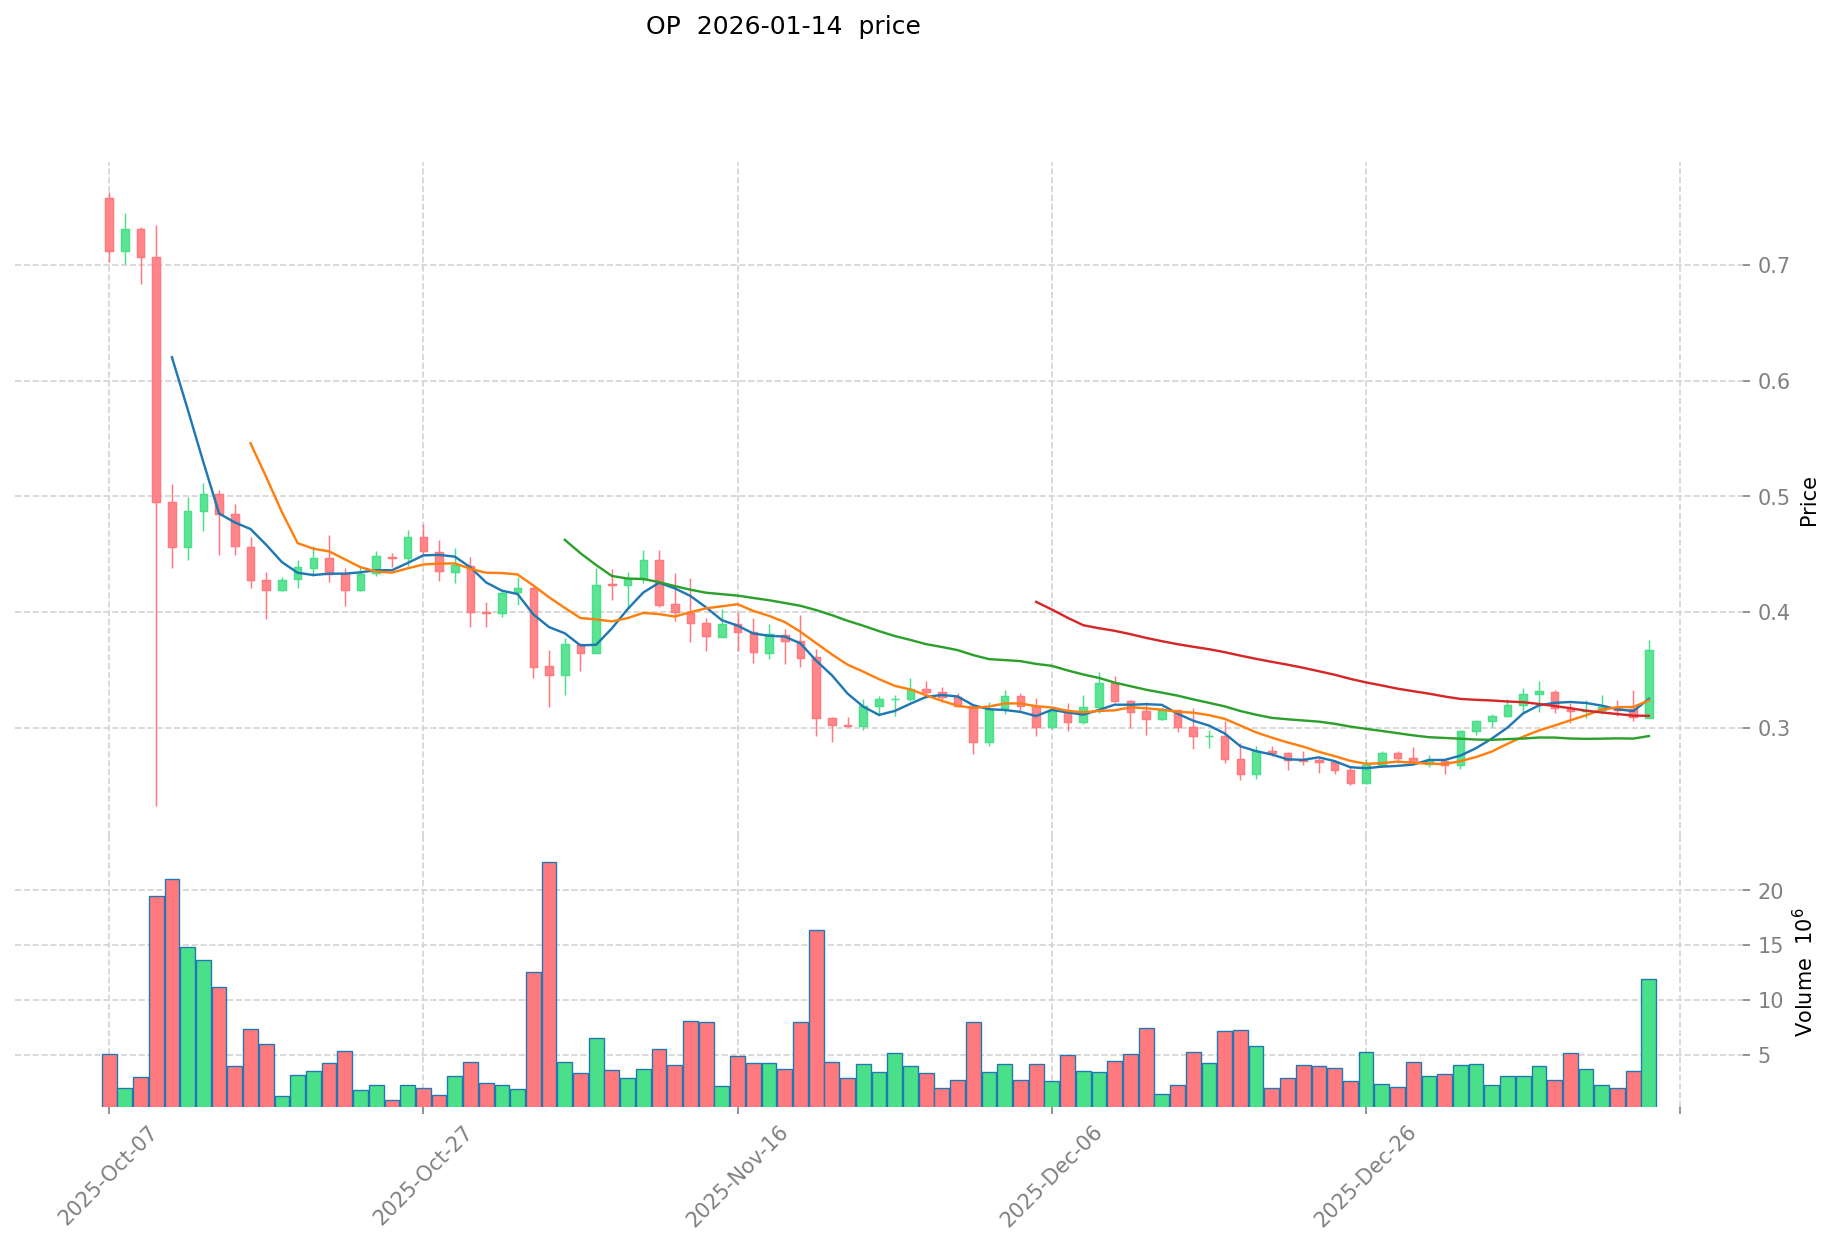
As of January 14, 2026, OP is trading at $0.3613, demonstrating recent upward momentum with a 24-hour increase of 12.42%. The token has shown positive performance across multiple timeframes, with a 7-day gain of 11.16% and a 30-day increase of 16.13%. Within the past 24 hours, OP has traded between a low of $0.3204 and a high of $0.3758.
The circulating supply stands at 1,944,092,497 OP tokens, representing approximately 45.26% of the maximum supply of 4,294,967,296 tokens. The current market capitalization is $702,400,619, while the fully diluted market cap reaches $1,551,771,684. Trading volume over the past 24 hours amounts to $5,471,529, indicating active market participation.
OP maintains a market share of 0.045% and is listed on 57 exchanges, with over 1,357,209 holders participating in the ecosystem. The Gate Crypto Sentiment Index currently registers at 48, suggesting a neutral market sentiment toward the token.
Click to view current OP market price
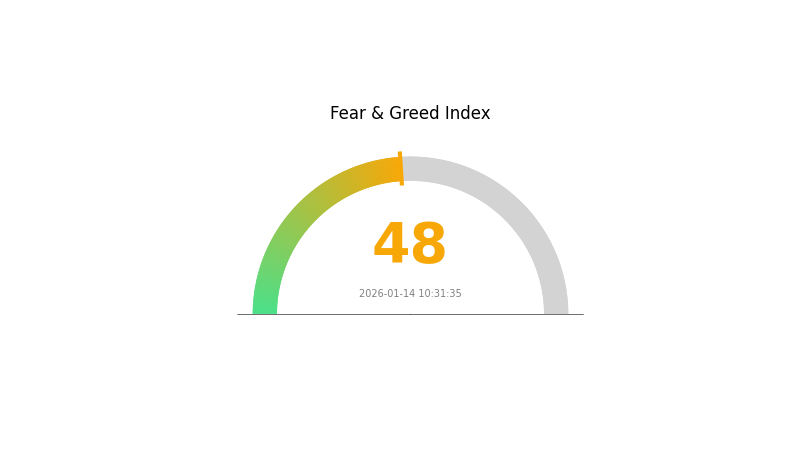
OP Market Sentiment Indicator
2026-01-14 Fear and Greed Index: 48 (Neutral)
Click to view the current Fear & Greed Index
The OP market is currently displaying neutral sentiment with a Fear and Greed Index reading of 48. This balanced positioning suggests that market participants are neither excessively fearful nor overwhelmingly greedy. Investors should maintain a measured approach, carefully evaluating opportunities while managing risk exposure. Such neutral conditions often present strategic entry and exit points for traders. Monitor the index closely for potential shifts that could indicate emerging market trends and sentiment changes in the coming trading sessions.
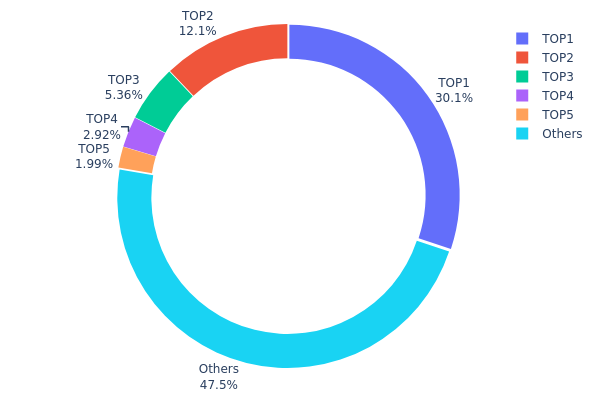
OP Holdings Distribution
The holdings distribution chart reflects the concentration of OP tokens across different blockchain addresses, providing insights into the decentralization level and potential market control by major holders. Based on current data, the top 5 addresses collectively hold approximately 52.47% of the total OP supply, with the largest single address controlling 30.12% (1.29 billion tokens). This indicates a relatively high concentration level, though not extreme by industry standards.
The current distribution pattern reveals moderate centralization risks. The dominant address holding nearly one-third of total supply could theoretically exert significant influence on market dynamics. However, the gradual decline in holdings from the top holder (30.12%) to the fifth-largest (1.99%) suggests a tiered distribution rather than extreme monopolistic control. The "Others" category accounting for 47.53% demonstrates meaningful dispersion among smaller holders, which provides some counterbalance to top-heavy concentration.
From a market structure perspective, this distribution creates mixed implications. While the substantial holdings by top addresses could enable coordinated selling pressure during market downturns, potentially amplifying volatility, it may also indicate strategic long-term positioning by institutional entities or ecosystem participants. The presence of nearly half the supply distributed among numerous smaller addresses enhances network resilience and reduces the likelihood of complete market manipulation. This structure reflects a transitional phase common in Layer 2 protocols, where foundation allocations and early backers maintain significant positions while community distribution gradually expands.
Click to view current OP Holdings Distribution
| Top |
Address |
Holding Qty |
Holding (%) |
| 1 |
0x2a82...663a26 |
1294044.37K |
30.12% |
| 2 |
0x2501...a8b3f0 |
519751.18K |
12.10% |
| 3 |
0xf977...41acec |
230000.00K |
5.35% |
| 4 |
0x641f...35ec6e |
125320.03K |
2.91% |
| 5 |
0x6ba2...ff7c9f |
85494.92K |
1.99% |
| - |
Others |
2040352.79K |
47.53% |
II. Core Factors Influencing OP's Future Price
Supply Mechanism
- Token Unlock Events: OP tokens are subject to scheduled unlock periods that release previously locked tokens into circulation. Historical data shows that unlock events typically create short-term downward pressure on prices as newly available tokens enter the market.
- Historical Pattern: Previous unlock events have led to temporary price corrections, followed by periods of recovery. The actual impact depends heavily on project development progress and overall market sentiment during the unlock period.
- Current Impact: Future unlock events may generate temporary selling pressure. However, the Optimism Foundation's recent proposal to allocate 50% of Superchain revenue toward OP token buybacks could help offset this pressure. Over the past 12 months, the Superchain has generated 5,868 ETH in revenue for the foundation.
Institutional and Major Holder Dynamics
- Institutional Support: OP Mainnet benefits from backing by top-tier venture capital firms including Paradigm and A16z, with three funding rounds totaling $178.5 million at a valuation of $1.65 billion. Coinbase has joined as a core developer in OP Labs and launched Base, a Layer 2 network built on OP Stack architecture.
- Enterprise Adoption: Major DeFi protocols have integrated with Optimism, including Synthetix (one of the earliest major protocols to migrate to Layer 2 in July 2021) and Velodrome (the largest dApp by TVL on Optimism at $178 million).
- Governance Structure: OP token holders who meet certain criteria can become citizens of the OP Collective, gaining voting rights on protocol upgrades, network parameter changes, and public goods funding through the RetroPGF program.
Macroeconomic Environment
- Monetary Policy Impact: According to CME's "FedWatch," the probability of the Federal Reserve maintaining interest rates unchanged in January stands at 97.2%. The broader cryptocurrency market remains sensitive to central bank policy decisions and interest rate expectations.
- Market Volatility: Cryptocurrency prices are influenced by multiple factors including market sentiment, macroeconomic conditions, news events, and regulatory developments. Even projects with strong fundamentals may experience significant price fluctuations.
- Institutional Capital Flows: Recent data shows Bitcoin spot ETFs experienced net outflows of $400.24 million, while Ethereum spot ETFs saw net outflows of $159.94 million, indicating shifting institutional sentiment in the broader crypto market.
Technical Development and Ecosystem Building
- OP Stack Framework: OP Stack serves as a modular development stack for building Layer 2 blockchain ecosystems. The Bedrock upgrade, completed as the first official version of OP Stack, focuses on reducing transaction costs and improving transaction speeds while enhancing modularity.
- Superchain Vision: Multiple OP-chains can share a single sequencer, enabling atomic interactions across chains. This architecture supports the long-term vision of creating interconnected blockchain networks where boundaries between individual chains become seamless.
- Ecosystem Growth: Optimism's DeFi TVL currently stands at $787 million, making it the second-largest Layer 2 by TVL. The network's share of total Layer 2 value has grown from 13.5% to 35.2% over the past year, while its proportion of all blockchain TVL has increased from 0.2% to 1.2%.
- Application Development: As Ethereum continues to face network congestion and high gas fees, Layer 2 solutions like Optimism are becoming increasingly preferred by projects prioritizing scalability and cost-effectiveness. The ecosystem includes various dApps across DeFi, gaming, and other sectors, with projects like OP Craft and Sky Strife building custom rollups using OP Stack.
- Adoption Drivers: The growing global shift toward blockchain-powered Web 3.0 dApps is expected to increase demand for the Optimism ecosystem. If more DApps and projects choose to build on Optimism, this could lead to increased demand for OP tokens.
III. 2026-2031 OP Price Prediction
2026 Outlook
- Conservative Prediction: $0.28244 - $0.3621
- Neutral Prediction: Around $0.3621
- Optimistic Prediction: Up to $0.42004 (requires favorable market conditions and sustained ecosystem growth)
2027-2029 Mid-term Outlook
- Market Stage Expectation: Gradual expansion phase with increasing adoption of Layer 2 solutions and broader integration of Optimism's technology stack
- Price Range Predictions:
- 2027: $0.31677 - $0.54358
- 2028: $0.27105 - $0.58416
- 2029: $0.29967 - $0.71501
- Key Catalysts: Enhanced scalability solutions, strategic partnerships within the Ethereum ecosystem, and growing demand for efficient transaction processing
2030-2031 Long-term Outlook
- Baseline Scenario: $0.335 - $0.62038 (assuming steady market growth and continued technological advancement)
- Optimistic Scenario: $0.69631 - $0.89334 (driven by widespread Layer 2 adoption and strong ecosystem development)
- Transformative Scenario: Up to $0.90823 (contingent upon breakthrough innovations and substantial mainstream adoption of decentralized applications)
- 2026-01-14: OP maintains a foundational position as market observers assess its trajectory toward predicted ranges
| Year |
Predicted High Price |
Predicted Average Price |
Predicted Low Price |
Price Change |
| 2026 |
0.42004 |
0.3621 |
0.28244 |
0 |
| 2027 |
0.54358 |
0.39107 |
0.31677 |
8 |
| 2028 |
0.58416 |
0.46733 |
0.27105 |
29 |
| 2029 |
0.71501 |
0.52574 |
0.29967 |
45 |
| 2030 |
0.89334 |
0.62038 |
0.335 |
71 |
| 2031 |
0.90823 |
0.75686 |
0.69631 |
109 |
IV. OP Professional Investment Strategies and Risk Management
OP Investment Methodology
(1) Long-term Holding Strategy
- Target Investors: Investors who believe in Ethereum Layer 2 scaling solutions and are willing to hold assets for 1-3 years or longer
- Operational Recommendations:
- Consider accumulating OP tokens during market corrections, particularly when trading below the 30-day average
- Monitor Optimism ecosystem development and governance participation to assess long-term value
- Implement a dollar-cost averaging approach to reduce timing risk
- Storage Solution: Use Gate Web3 Wallet for secure self-custody with built-in DeFi access
(2) Active Trading Strategy
- Technical Analysis Tools:
- Moving Averages: Monitor 7-day and 30-day moving averages to identify trend changes; OP's recent 11.16% weekly gain suggests short-term momentum
- Volume Analysis: Track 24-hour trading volume (currently $5.47M) to confirm breakout validity and identify potential reversals
- Swing Trading Key Points:
- Consider the 24-hour range between $0.3204 and $0.3758 as potential support and resistance levels
- Set stop-loss orders 5-8% below entry points to manage downside risk
- Monitor correlation with Ethereum price movements as Layer 2 solutions often track Layer 1 performance
OP Risk Management Framework
(1) Asset Allocation Principles
- Conservative Investors: 1-3% of crypto portfolio
- Aggressive Investors: 5-10% of crypto portfolio
- Professional Investors: Up to 15% with active hedging strategies
(2) Risk Hedging Solutions
- Portfolio Diversification: Balance OP exposure with Bitcoin, Ethereum, and stablecoin holdings
- Position Sizing: Limit individual trade size to 2-5% of total portfolio value
- Rebalancing Strategy: Review and adjust allocations quarterly based on market conditions and project developments
(3) Secure Storage Solutions
- Hot Wallet Recommendation: Gate Web3 Wallet for active trading and DeFi participation with user-friendly interface
- Cold Storage Solution: For long-term holdings exceeding $10,000, consider hardware wallet solutions with offline key storage
- Security Precautions: Enable two-factor authentication, never share private keys, verify all transaction addresses, and be cautious of phishing attempts
V. OP Potential Risks and Challenges
OP Market Risks
- High Volatility: OP has experienced significant price fluctuations, with a 79.14% decline over the past year, indicating substantial volatility exposure
- Market Cap Sensitivity: With a market cap of $702.4M and circulating supply of 1.94B tokens (45.26% of max supply), future token unlocks could create selling pressure
- Liquidity Concerns: During market downturns, reduced trading volume may impact the ability to exit positions at desired prices
OP Regulatory Risks
- Layer 2 Classification: Evolving regulatory frameworks may impact how Layer 2 solutions are classified and governed
- Securities Law Considerations: Governance tokens like OP may face increased scrutiny regarding their classification and distribution methods
- Geographic Restrictions: Regulatory developments in major markets could affect OP's accessibility and trading in certain jurisdictions
OP Technical Risks
- Smart Contract Vulnerabilities: As with all blockchain protocols, potential undiscovered bugs in Optimism's smart contracts could lead to security incidents
- Network Congestion: During periods of high activity, Layer 2 solutions may experience performance degradation affecting user experience
- Ethereum Dependency: OP's value proposition is closely tied to Ethereum's success; major issues with Ethereum could negatively impact Optimism
- Competition: Other Layer 2 solutions and scaling technologies may capture market share, affecting OP's long-term value
VI. Conclusion and Action Recommendations
OP Investment Value Assessment
Optimism (OP) represents a significant player in the Ethereum Layer 2 scaling ecosystem, addressing critical needs for lower transaction costs and faster processing times. The project's governance-focused tokenomics and ecosystem development position it as a long-term infrastructure play in the blockchain space. However, investors should carefully consider the substantial volatility, with the token trading significantly below its previous highs and showing a 79.14% decline year-over-year. The recent short-term momentum (11.16% weekly gain, 16.13% monthly gain) suggests potential recovery interest, but this should be weighed against broader market conditions and the competitive Layer 2 landscape.
OP Investment Recommendations
✅ Beginners: Start with a small allocation (1-2% of crypto portfolio) and focus on education about Layer 2 technology and Optimism's governance model before increasing exposure
✅ Experienced Investors: Consider OP as part of a diversified Layer 2 portfolio, with 3-7% allocation, actively monitoring ecosystem growth metrics and governance proposals
✅ Institutional Investors: Evaluate OP within a broader DeFi and infrastructure thesis, with potential allocations up to 10-15% combined with appropriate hedging strategies and active governance participation
OP Trading Participation Methods
- Spot Trading: Purchase OP tokens directly on Gate.com with competitive fees and deep liquidity
- DeFi Integration: Use Gate Web3 Wallet to interact with Optimism-based DeFi protocols while holding OP for governance participation
- Portfolio Strategy: Implement systematic accumulation during market corrections while maintaining disciplined position sizing
Cryptocurrency investments carry extremely high risks, and this article does not constitute investment advice. Investors should make prudent decisions based on their own risk tolerance and are advised to consult professional financial advisors. Never invest more than you can afford to lose.
FAQ
OP token historical price trend?
OP token has shown moderate volatility recently. In early January 2026, prices fluctuated between 0.2604 and 0.2973. The token demonstrates steady price action with consistent trading activity across these ranges during this period.
What are the main factors affecting OP price?
OP price is primarily influenced by institutional capital inflows, ETF approvals, ecosystem development, technological upgrades, regulatory changes, and crypto market cycles.
What is the OP price prediction for 2024?
Based on market analysis, OP's highest price prediction for 2024 reached $2.830, with the lowest around $1.704. These projections reflect market trends and technical analysis data from that period.
What advantages does OP have compared to other Layer 2 solution tokens such as ARB and STRK?
OP offers faster dispute resolution through single-round verification and lower transaction costs. Its OP Stack enables building multiple Layer 2 solutions, creating a Superchain ecosystem with shared security and liquidity, giving OP broader interoperability advantages.
What are the risks of buying and holding OP tokens?
OP token risks include technical upgrade failures, security vulnerabilities, Layer 2 competition, and market volatility. These factors may affect token value and usability. Diversify investments and monitor ecosystem developments to manage exposure.
What are the circulating supply and total supply of OP tokens?
OP token has a total supply of 4,294,967,296, with circulating supply around 2,539,780,966. The total supply increases by 2% annually.
How does Optimism ecosystem development impact OP price?
Optimism ecosystem growth typically drives OP price appreciation. As the ecosystem expands with more dApps and users, OP token demand increases, supporting higher valuations and stronger price performance.
Where can OP tokens be traded?
OP tokens are available on major cryptocurrency exchanges including Binance, Coinbase, Kraken, and OKX, offering high liquidity and trading volume for users globally.
* The information is not intended to be and does not constitute financial advice or any other recommendation of any sort offered or endorsed by Gate.