This comprehensive guide analyzes Pendle (PENDLE), a yield derivatives protocol revolutionizing DeFi fixed-income trading. Currently trading at $2.23 with a $376M market cap, PENDLE enables users to tokenize and trade future yields through its PT and YT mechanisms. The article examines historical price evolution, current market dynamics with 71,219 holders across 52 exchanges, and projects price movements through 2031, ranging from conservative forecasts of $1.14-$1.50 to optimistic scenarios reaching $6.10. Key catalysts include protocol ecosystem expansion, AgentFi integration, and multi-chain deployment. For investors, strategies include long-term vePENDLE locking for governance rewards, active trading via technical analysis, and risk management through diversification. Suitable for both retail and institutional participants seeking yield optimization exposure on Gate.com and other platforms.
Introduction: PENDLE's Market Position and Investment Value
Pendle (PENDLE), as a permissionless yield trading protocol that enables tokenized future yield trading on AMM systems, has been developing innovative yield management solutions since its launch in 2021. As of January 2026, PENDLE has achieved a market capitalization of approximately $376 million, with a circulating supply of around 169 million tokens and a price hovering around $2.23. This asset, recognized as a "yield derivatives pioneer," is playing an increasingly critical role in DeFi yield optimization and fixed-income trading sectors.
This article will comprehensively analyze PENDLE's price trajectory from 2026 to 2031, combining historical patterns, market supply and demand dynamics, ecosystem development, and macroeconomic conditions to provide investors with professional price forecasts and practical investment strategies.
I. PENDLE Price History Review and Market Status
PENDLE Historical Price Evolution Trajectory
- 2021: Seed round funding completed in April, raising $3.7 million at an FDV of $35 million, with a launch price of $1.6957
- 2022: Market downturn phase, price declined to a historical low of $0.0338 on November 15
- 2024: Protocol development momentum accelerated, price reached a peak of $7.5 on April 11
- 2025-2026: Market adjustment period, price has declined approximately 41.86% over the past year
PENDLE Current Market Dynamics
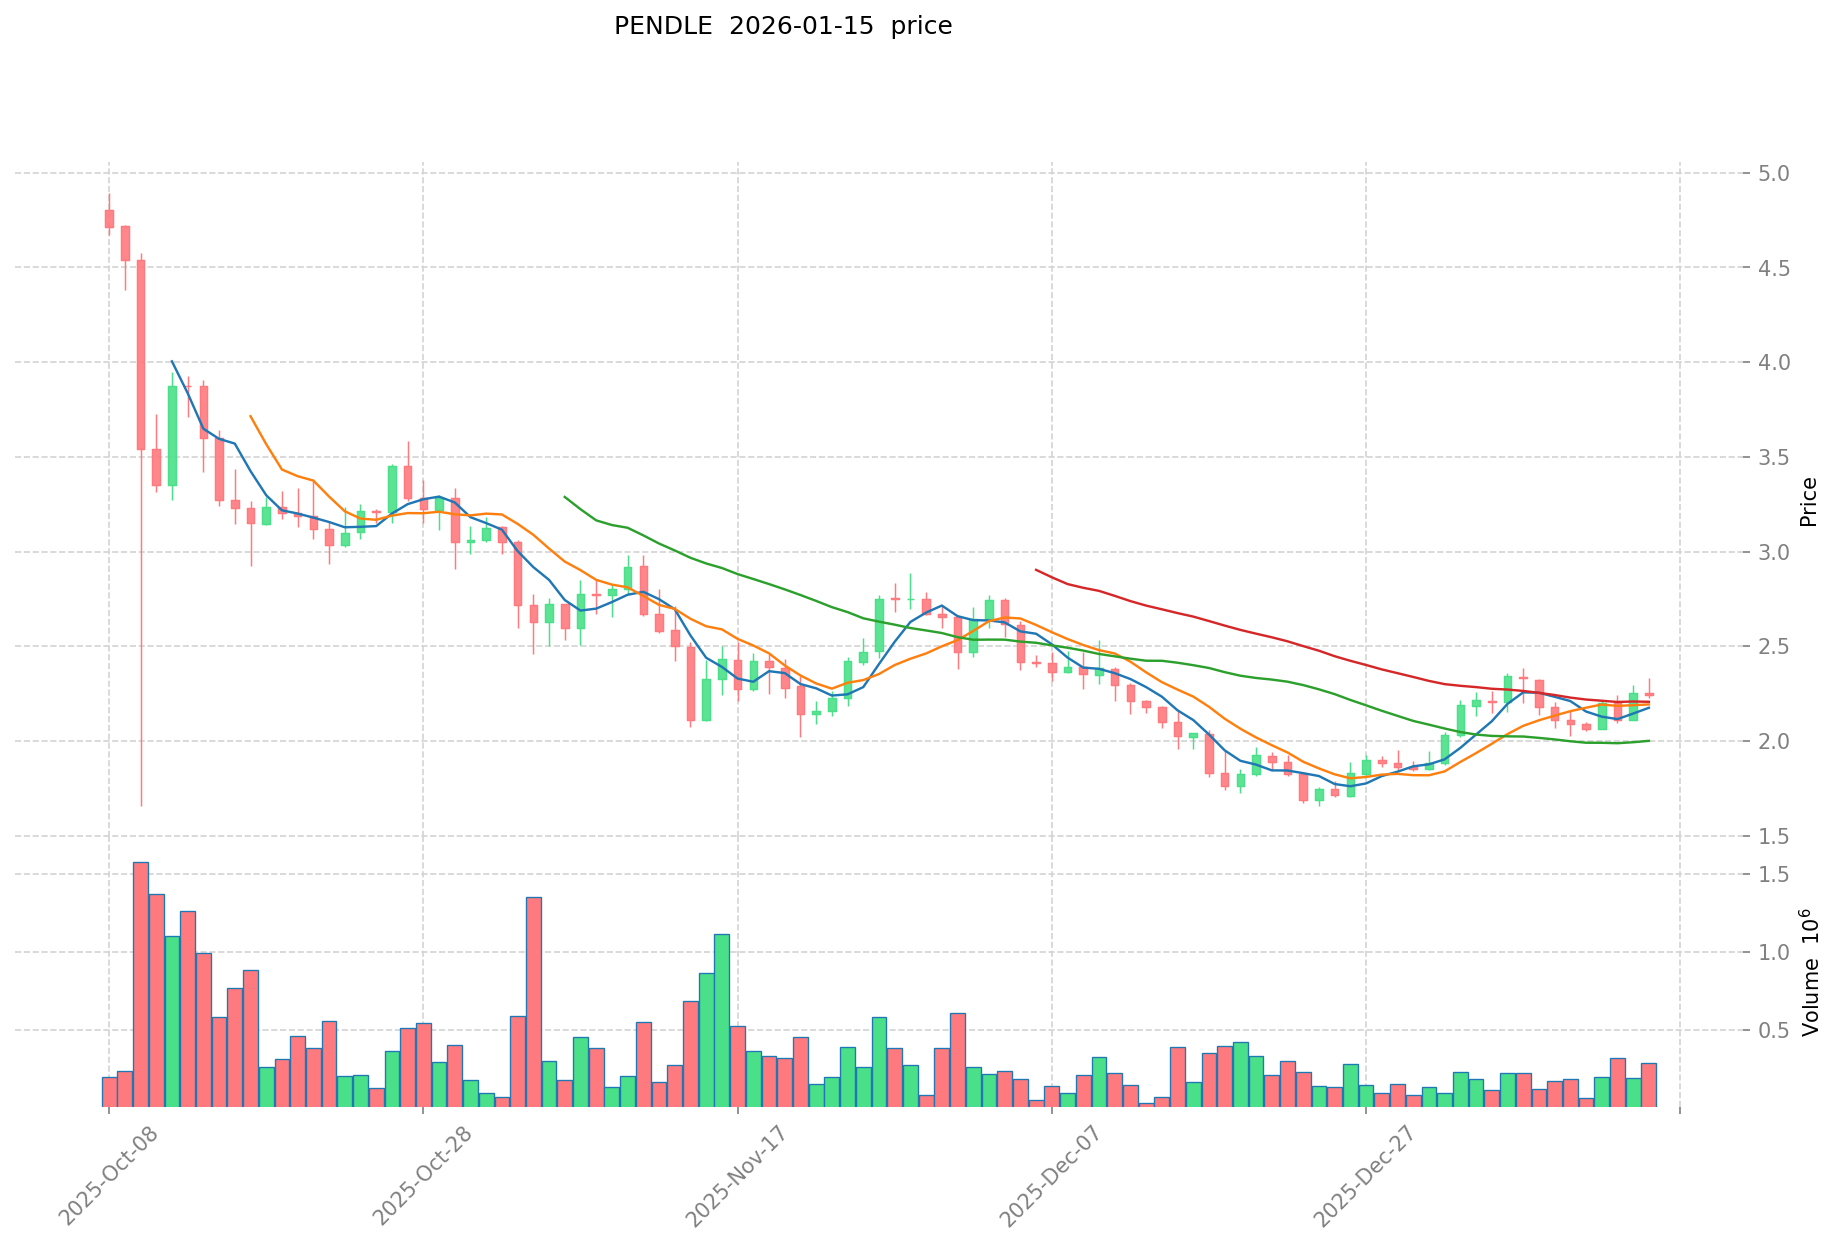
As of January 15, 2026, PENDLE is trading at $2.226, ranking 165th in the cryptocurrency market with a market capitalization of approximately $376.12 million. The circulating supply stands at 168.97 million tokens, representing 60.02% of the total supply of 281.53 million tokens.
Recent price movements show a decline of 1.54% over the past 24 hours, with the trading range between $2.214 and $2.332. However, the token has demonstrated positive momentum over longer timeframes, gaining 1.37% over the past week and 12.37% over the past 30 days. The 24-hour trading volume reached $624,948.
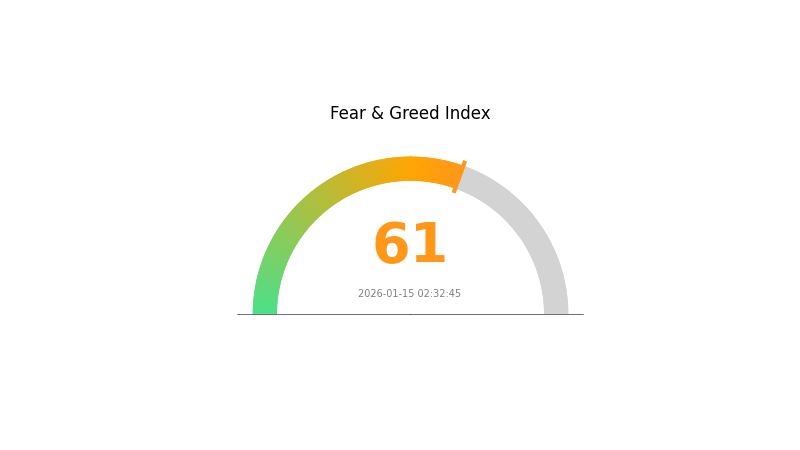
The protocol maintains a holder base of 71,219 addresses and is listed on 52 exchanges. The fully diluted market cap stands at $626.68 million, with a market cap to FDV ratio of 60.02%. The current Fear & Greed Index reading of 61 indicates a "Greed" sentiment in the broader market.
PENDLE's token distribution includes ongoing emissions that were scheduled to decrease by 1.10% weekly until April 2026, with a weekly emission rate of 460,000 tokens as of June 2023. The tokenomics design incorporates a terminal inflation rate of 2.00% annually as an incentive mechanism.
Click to view current PENDLE market price
PENDLE Market Sentiment Index
2026-01-15 Fear and Greed Index: 61 (Greed)
Click to view current Fear & Greed Index
The PENDLE market is currently displaying strong greed sentiment with an index reading of 61. This elevated level indicates that investors are becoming increasingly optimistic and risk-taking in their trading behavior. When the Fear and Greed Index reaches this territory, market participants typically show heightened confidence and willingness to enter positions. However, investors should remain cautious during periods of extreme greed, as such sentiment often precedes market corrections. It is advisable to maintain a balanced investment strategy and consider taking some profits while sentiment remains favorable.
PENDLE Holder Distribution
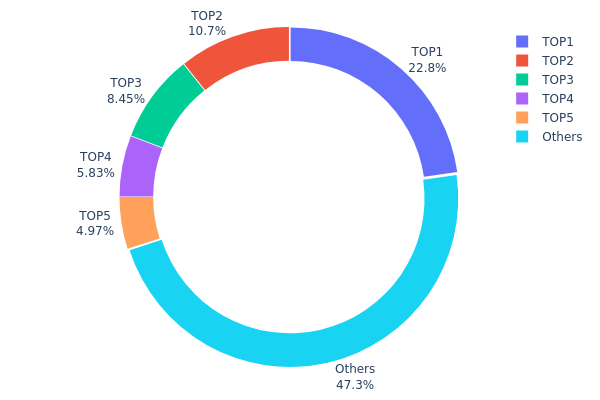
The holder distribution chart illustrates the allocation of PENDLE tokens across different wallet addresses, providing insights into the degree of centralization within the token's ownership structure. This metric serves as a critical indicator for assessing market concentration risk, potential price manipulation vulnerability, and the overall decentralization health of the project's token economy.
Based on the current data, PENDLE exhibits a moderately concentrated holder structure. The top address controls approximately 22.76% of the total supply (64.08 million tokens), while the top five addresses collectively hold 52.69% of all circulating tokens. This concentration level suggests that a relatively small number of entities maintain significant influence over the token's market dynamics. The "Others" category, representing the remaining 47.31% distributed among numerous smaller holders, indicates a reasonably diversified base of retail and institutional participants beyond the major stakeholders.
From a market structure perspective, this distribution pattern presents both opportunities and risks. The substantial holdings by top addresses could potentially lead to increased price volatility if these entities decide to liquidate portions of their positions. However, the presence of nearly half the supply among diverse holders provides a stabilizing counterbalance and suggests healthy community participation. The current concentration level, while notable, remains within acceptable ranges for many DeFi governance tokens and does not immediately signal excessive centralization that would severely compromise decentralization principles or create acute manipulation concerns.
Click to view current PENDLE Holder Distribution
| Top |
Address |
Holding Qty |
Holding (%) |
| 1 |
0x4f30...170210 |
64077.53K |
22.76% |
| 2 |
0xa3a7...d60eec |
30103.99K |
10.69% |
| 3 |
0x8119...456ee1 |
23801.62K |
8.45% |
| 4 |
0x399b...22ec9a |
16407.94K |
5.82% |
| 5 |
0x5a52...70efcb |
14000.00K |
4.97% |
| - |
Others |
133136.37K |
47.31% |
II. Core Factors Influencing PENDLE's Future Price
Market Demand and Project Development
- Market Demand Dynamics: PENDLE token price is influenced by market demand for its yield trading protocol. As users seek fixed yield products and yield speculation opportunities, demand for PT (Principal Token) and YT (Yield Token) products directly impacts PENDLE's value proposition.
- Project Development Progress: The protocol's continuous expansion into new markets and chains affects long-term value. Recent developments include integration with AgentFi systems like Pulse Optimizer, which automates PT fixed income strategies across multiple chains including Arbitrum, Ethereum mainnet, Base, Mantle, and Sonic.
- Current Impact: The introduction of automated rollover mechanisms addresses TVL retention challenges, potentially creating more stable capital flows and growth trajectories for the protocol.
TVL Health and Asset Pool Management
- TVL Composition: The protocol's Total Value Locked represents a critical metric for assessing business health. Key considerations include TVL structural composition, asset pool maturity schedules, and rollover ratios.
- Asset Pool Dynamics: Different maturity periods for PT/YT create yield curves similar to traditional bond markets. The protocol's AMM is optimized for assets with expiration dates, enabling flexible trading of principal and yield components.
- Management Strategy: Effective management of PT expiration cycles and liquidity depth across various asset pools influences protocol efficiency and user returns. The ability to maintain healthy rollover rates prevents TVL erosion at maturity dates.
Overall Market Trends
- Bull and Bear Cycles: Yield rates tend to rise during bull markets and decline in bear conditions. These broader market trends create volatility and uncertainty in predicting exact yields.
- Trading Strategy Complexity: PENDLE's PT/YT trading encompasses four main paths: fixed income, yield speculation, inter-period arbitrage, and leveraged yield strategies. Market conditions determine the effectiveness of each approach.
- Risk Factors: The protocol faces potential unknown risks during extreme market conditions. Heavy reliance on Liquid Restaking Tokens (LRT) and dependency on external market factors like ETH spot ETF outcomes may impact future performance.
Technological Innovation and Ecosystem Expansion
- AgentFi Integration: The emergence of AgentFi products like Pulse represents a milestone in automating complex yield trading strategies. These systems enable dynamic interest rate comparison, automatic position adjustment, and risk-optimized portfolio allocation based on user preferences.
- Multi-Chain Strategy: Protocol expansion across multiple blockchain networks enhances accessibility and capital efficiency. Cross-chain bridge integration through platforms like Stargate enables seamless multi-chain operability.
- Yield Optimization Tools: Automated systems monitor PT markets in real-time, considering cross-chain costs, maturity management, and liquidity constraints to maximize portfolio APY while maintaining risk controls.
III. 2026-2031 PENDLE Price Prediction
2026 Outlook
- Conservative forecast: $1.14 - $1.50
- Neutral forecast: $1.80 - $2.23
- Optimistic forecast: $2.50 - $2.94 (requires sustained DeFi yield market expansion and increased institutional adoption)
2027-2029 Outlook
- Market phase expectation: Potential transition into a broader cryptocurrency market recovery cycle, with DeFi protocols gaining renewed attention from both retail and institutional investors
- Price range predictions:
- 2027: $1.71 - $3.85
- 2028: $1.77 - $4.22
- 2029: $3.12 - $4.31
- Key catalysts: Enhanced protocol utility, expansion of yield tokenization use cases, potential integration with major DeFi platforms, and growing awareness of sophisticated yield strategies among crypto investors
2030-2031 Long-term Outlook
- Baseline scenario: $2.05 - $4.01 (assuming steady protocol development and moderate market growth)
- Optimistic scenario: $4.50 - $5.90 (assuming significant DeFi market maturation and mainstream adoption of yield tokenization)
- Transformational scenario: $5.50 - $6.10 (requires exceptional favorable conditions including regulatory clarity, mass institutional participation, and PENDLE becoming a cornerstone protocol in decentralized finance)
- 2026-01-15: PENDLE demonstrates potential for substantial growth over the next five years, with price predictions suggesting possible appreciation ranging from conservative estimates to optimistic scenarios depending on market conditions and protocol adoption rates
| Year |
Predicted High Price |
Predicted Average Price |
Predicted Low Price |
Price Change |
| 2026 |
2.94096 |
2.228 |
1.13628 |
0 |
| 2027 |
3.85088 |
2.58448 |
1.70576 |
16 |
| 2028 |
4.21516 |
3.21768 |
1.76972 |
44 |
| 2029 |
4.31104 |
3.71642 |
3.12179 |
66 |
| 2030 |
5.90018 |
4.01373 |
2.047 |
80 |
| 2031 |
6.09706 |
4.95696 |
3.61858 |
122 |
IV. PENDLE Professional Investment Strategy and Risk Management
PENDLE Investment Methodology
(1) Long-term Holding Strategy
- Target Investors: Investors who believe in the DeFi yield trading sector and have a medium to long-term investment horizon
- Operational Recommendations:
- Consider accumulating PENDLE during market pullbacks, as the token has shown significant volatility with current price at $2.226, approximately 70% below its all-time high of $7.5
- Lock PENDLE as vePENDLE for up to 2 years to participate in governance voting and earn protocol fees from swap activities and yield token (YT) fees
- Storage Solution: Use Gate Web3 Wallet for secure custody with multi-signature protection and regular security audits
(2) Active Trading Strategy
- Technical Analysis Tools:
- Price Range Analysis: Monitor the 24-hour range between $2.214 and $2.332 to identify short-term entry and exit points
- Volume Analysis: Track the 24-hour trading volume of $624,948.22 to gauge market liquidity and potential price movements
- Swing Trading Key Points:
- Consider the 7-day positive trend of +1.37% and 30-day rally of +12.37% when identifying potential momentum opportunities
- Be aware of the 1-year decline of -41.86%, suggesting caution for longer-term position sizing
PENDLE Risk Management Framework
(1) Asset Allocation Principles
- Conservative Investors: 1-3% of crypto portfolio allocation
- Aggressive Investors: 5-10% of crypto portfolio allocation
- Professional Investors: May allocate up to 15% with active hedging strategies
(2) Risk Hedging Solutions
- Diversification Strategy: Balance PENDLE holdings with other DeFi protocol tokens and stablecoins to reduce concentration risk
- Yield Token Strategy: Utilize Pendle's PT and YT splitting mechanism to separate principal and yield exposure based on market outlook
(3) Secure Storage Solutions
- Software Wallet Recommendation: Gate Web3 Wallet offers user-friendly interface with enhanced security features for PENDLE token management
- Hardware Wallet Solution: Consider using hardware wallets for larger PENDLE holdings, ensuring private keys remain offline
- Security Precautions: Never share private keys or seed phrases, enable two-factor authentication, and regularly verify contract addresses before transactions
V. PENDLE Potential Risks and Challenges
PENDLE Market Risks
- Price Volatility: PENDLE has experienced substantial price fluctuations, with a historical low of $0.0338 and high of $7.5, indicating significant volatility exposure
- Liquidity Risk: While trading on 52 exchanges, market depth may vary during periods of high volatility, potentially affecting execution prices
- Market Sentiment: The token ranks 165th by market capitalization with 0.018% market dominance, suggesting sensitivity to broader crypto market trends
PENDLE Regulatory Risks
- DeFi Protocol Oversight: Evolving regulatory frameworks for DeFi protocols may impact Pendle's operations and token utility
- Securities Classification: Yield-bearing token structures may face scrutiny from regulatory authorities regarding securities law compliance
- Cross-border Operations: Operating across multiple jurisdictions may subject the protocol to varying regulatory requirements and potential restrictions
PENDLE Technical Risks
- Smart Contract Vulnerabilities: Despite audits, complex yield tokenization mechanisms involving PT and YT splits may contain undiscovered vulnerabilities
- AMM Design Complexity: The Pendle v2 AMM's capital-efficient design requires sophisticated understanding, potentially leading to user errors or exploitation risks
- Integration Dependencies: Reliance on underlying yield-generating protocols creates cascading risk if integrated platforms experience technical issues or exploits
VI. Conclusion and Action Recommendations
PENDLE Investment Value Assessment
Pendle represents an innovative approach to yield trading in DeFi, offering users the ability to separate and trade future yield streams through its unique tokenization mechanism. The protocol's value proposition centers on providing fixed and variable yield opportunities through PT and YT tokens, supported by a capital-efficient AMM design. With a circulating supply of approximately 169 million tokens (60% of total supply) and a market cap of $376 million, PENDLE maintains moderate liquidity across 52 exchanges. However, the token's -41.86% performance over the past year and 70% decline from its all-time high reflects both sector-wide challenges and project-specific headwinds. The vePENDLE locking mechanism offers attractive incentives for long-term holders through governance participation and fee accumulation, though token emission continues until April 2026 before reaching a 2% annual inflation rate. Short-term risks include market volatility, regulatory uncertainty, and technical complexity, while long-term value depends on Pendle's ability to capture yield trading market share and expand its protocol integrations.
PENDLE Investment Recommendations
✅ Beginners: Start with small position sizes (1-2% of portfolio) to understand Pendle's yield mechanisms; focus on learning PT and YT token dynamics before scaling investments; consider using Gate.com's spot trading platform for straightforward token acquisition
✅ Experienced Investors: Consider dollar-cost averaging into positions during market pullbacks; explore vePENDLE locking strategies to earn protocol fees and governance rights; maintain 3-7% portfolio allocation with active monitoring of protocol TVL and yield opportunities
✅ Institutional Investors: Evaluate Pendle's yield trading infrastructure for portfolio yield optimization strategies; assess liquidity depth across venues before executing larger positions; consider OTC arrangements for significant allocations to minimize market impact
PENDLE Trading Participation Methods
- Spot Trading on Gate.com: Direct purchase and sale of PENDLE tokens with competitive fees and deep liquidity for retail and professional traders
- Protocol Participation: Acquire PENDLE to lock as vePENDLE for governance voting rights and protocol fee accumulation from swap and yield token activities
- Yield Strategy Implementation: Use Pendle protocol directly to mint and trade PT/YT tokens, enabling fixed or variable yield exposure based on market outlook
Cryptocurrency investment carries extremely high risks, and this article does not constitute investment advice. Investors should make prudent decisions based on their own risk tolerance, and it is recommended to consult professional financial advisors. Never invest more than you can afford to lose.
FAQ
What is the historical price trend of PENDLE token?
PENDLE reached its all-time high exceeding $7.52 USD on April 11, 2024, and hit its lowest point on November 9, 2022. The token has experienced significant volatility throughout its trading history, reflecting market dynamics and ecosystem developments.
What are the main factors affecting PENDLE price?
PENDLE price is influenced by user activity, exchange liquidity, ecosystem events such as token burns and upgrades, whale transactions, and social media sentiment. Market demand and DeFi yield farming trends also play significant roles in price movements.
What is the PENDLE price prediction for 2024-2025?
PENDLE is projected to reach $1.91 by end of 2025, representing a 60.67% decrease from current levels. This forecast is based on market analysis through January 2026.
What are the main functions and application scenarios of the Pendle protocol?
Pendle protocol enables three primary use cases: sustainable yield farming, interest rate trading, and points leverage. It allows users to trade tokenized future yields, optimize lending returns, and amplify rewards through leverage in decentralized finance.
What are the circulating supply and total supply of PENDLE tokens?
PENDLE has a circulating supply of 238 million tokens and a maximum supply of 258 million tokens, with a circulation rate of 84.6%.
What are the risks to pay attention to when investing in PENDLE tokens?
PENDLE investment risks include smart contract vulnerabilities, operational errors, and price volatility. Market uncertainty may also impact token value. Users should conduct thorough research before investing.
What advantages does PENDLE have compared to other DeFi tokens?
PENDLE stands out with its superior team capability, exceptional protocol security, and innovative product design. Its yield tokenization mechanism and efficient risk management outperform competitors in the DeFi landscape.
How to buy and store PENDLE tokens?
Register an account, deposit USDT, then purchase PENDLE on the spot market. For storage, use a cold wallet for security and long-term holding of your PENDLE tokens.
* The information is not intended to be and does not constitute financial advice or any other recommendation of any sort offered or endorsed by Gate.