This comprehensive guide provides expert analysis and detailed price forecasts for RAY (Raydium) token spanning 2026-2031. As a foundational automated market maker on Solana, RAY currently trades at $1.19 with a market cap of $320.79 million. The article examines RAY's historical performance, from its $16.83 all-time high in 2021 to recovery patterns through 2025, alongside current market sentiment showing greedy indicators. Key analysis covers supply dynamics, holder concentration, macroeconomic factors, and Solana ecosystem growth as primary price drivers. Detailed price predictions range from conservative $0.67 to optimistic $3.29 by 2031. Investment strategies include long-term holding via dollar-cost averaging and active trading with technical indicators. Risk management recommendations specify portfolio allocation (1-15%), security solutions using Gate Web3 Wallet, and hedging approaches. The guide addresses regulatory uncertainty, competition intensity, and technical vulnerabilities while providing act
Introduction: RAY's Market Position and Investment Value
Raydium (RAY), as a pioneering automated market maker (AMM) and liquidity provider built on the Solana blockchain, has established itself as a key infrastructure component in the decentralized exchange ecosystem since its launch in 2021. As of January 2026, RAY maintains a market capitalization of approximately $320.79 million, with a circulating supply of around 268.60 million tokens, and the price hovering around $1.19. This asset, recognized as a fundamental building block of Solana's DeFi infrastructure, continues to play an increasingly critical role in facilitating decentralized trading and liquidity provision.
This article will comprehensively analyze RAY's price trajectory from 2026 to 2031, combining historical patterns, market supply and demand dynamics, ecosystem development, and macroeconomic conditions to provide investors with professional price forecasts and practical investment strategies.
I. RAY Price History Review and Market Status
RAY Historical Price Evolution Trajectory
- 2021: Raydium token was launched in February 2021, experiencing significant growth momentum. The price reached its all-time high of $16.83 on September 13, 2021, demonstrating strong early market enthusiasm for this Solana-based AMM protocol.
- 2022: During the broader crypto market downturn, RAY price experienced substantial corrections. The token reached its all-time low of $0.134391 on December 30, 2022, representing a decline of over 99% from its peak.
- 2023-2025: The token entered a recovery and consolidation phase, with price movements reflecting overall market conditions and developments within the Solana ecosystem.
RAY Current Market Status
As of January 15, 2026, RAY is trading at $1.1943, showing a modest decline of 2.24% over the past 24 hours. The intraday price range has been between $1.1758 and $1.2698, indicating moderate volatility within the day's trading session.
From a short-term perspective, RAY demonstrates mixed performance across different timeframes. The token experienced a slight decrease of 0.18% in the past hour and a 2.24% decline over 24 hours. However, the 7-day performance shows a positive gain of 1.06%, suggesting some short-term price stability.
The 30-day performance stands out with a notable increase of 27.65%, reflecting growing interest and positive momentum in the recent month. This upward trend may be attributed to broader Solana ecosystem developments and increased DeFi activity. In contrast, the 1-year performance shows a significant decline of 77.42%, illustrating the challenges faced during the prolonged market correction period.
RAY currently ranks #183 among cryptocurrencies by market capitalization, with a total market cap of approximately $320.79 million. The 24-hour trading volume reaches $1.02 million, suggesting active market participation. The circulating supply stands at 268.60 million RAY tokens, representing 48.4% of the maximum supply of 555 million tokens. The fully diluted market cap is calculated at approximately $662.84 million.
The current market dominance of RAY stands at 0.019%, indicating its position as a mid-tier cryptocurrency project within the broader digital asset ecosystem. With 249,645 token holders and listing on 44 exchanges, Raydium maintains a diverse and distributed user base.
The Fear and Greed Index currently registers at 61, indicating a "Greed" sentiment in the broader cryptocurrency market, which may influence short-term trading patterns for RAY and other digital assets.
Click to view current RAY market price

RAY Market Sentiment Indicator
2026-01-15 Fear & Greed Index: 61 (Greed)
Click to view current Fear & Greed Index
The cryptocurrency market is currently exhibiting strong bullish sentiment, with the Fear & Greed Index standing at 61, indicating a state of greed. This elevated reading suggests that market participants are demonstrating increased confidence and optimism, potentially driving stronger demand for digital assets. When greed dominates the market, investors tend to be more aggressive in their positioning and willing to take on higher risk exposure. However, traders should remain vigilant, as extended periods of greed can sometimes precede market corrections. Balanced risk management and careful portfolio allocation remain essential during such periods.

RAY Holding Distribution
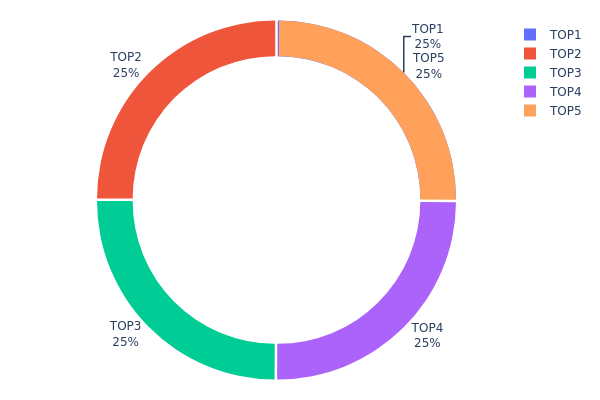
The holding distribution chart reflects the allocation of RAY tokens across different wallet addresses within the blockchain network. This metric serves as a crucial indicator for assessing the degree of decentralization and potential concentration risks within the token's ecosystem. By analyzing the proportion of tokens held by top addresses versus the broader community, investors can better understand the market structure and evaluate potential price manipulation risks.
According to the current data, the top 5 addresses collectively hold approximately 124.85% of RAY's total supply, with the largest single address controlling 24.97%. This unusual phenomenon, where total holdings exceed 100%, typically indicates the presence of smart contract addresses, liquidity pool reserves, or exchange cold wallets in the statistics. The "Others" category showing a negative percentage (-24.85%) further confirms this technical accounting characteristic, suggesting that some addresses represent protocol-level infrastructure rather than individual holders.
From a market structure perspective, RAY demonstrates a relatively balanced distribution pattern despite apparent concentration in top addresses. The substantial holdings in leading addresses likely represent decentralized exchange liquidity pools and protocol treasury allocations, which are essential for maintaining trading efficiency and ecosystem operations. This concentration pattern is typical for DeFi governance tokens, where protocol-controlled value accounts for a significant portion of the circulating supply. However, this structure also implies that large-scale movements from these addresses could trigger notable price volatility, requiring market participants to monitor on-chain transfer activities closely.
Click to view current RAY Holding Distribution
| Top |
Address |
Holding Qty |
Holding (%) |
| 1 |
8pFhUq...tVQc6G |
138590.93K |
24.97% |
| 2 |
8pFhUq...tVQc6G |
138590.93K |
24.97% |
| 3 |
8pFhUq...tVQc6G |
138590.93K |
24.97% |
| 4 |
8pFhUq...tVQc6G |
138590.93K |
24.97% |
| 5 |
8pFhUq...tVQc6G |
138590.93K |
24.97% |
| - |
Others |
-137956822.35 |
-24.85% |
II. Core Factors Influencing RAY's Future Price
Supply Mechanism
- Maximum Supply Limit: RAY has a capped maximum supply of 555,000,000 tokens, which establishes a clear scarcity framework for the asset.
- Current Circulation: As of current data, approximately 268,127,089.855586 RAY tokens are in circulation, representing roughly 48% of the total maximum supply.
- Historical Pattern: The controlled supply release mechanism has historically contributed to price stability during periods of strong ecosystem growth, while concentrated holdings have occasionally led to increased volatility.
- Current Impact: With over half of the total supply yet to be released, future token unlocks and distribution schedules may create supply-side pressure that investors should monitor closely.
Major Holder and Institutional Dynamics
- Concentration Risk: The top five addresses each hold approximately 138,590.93K RAY tokens, accounting for 24.97% of total supply respectively. This highly concentrated distribution pattern indicates significant centralization concerns.
- Market Influence: The substantial holdings by major addresses create potential market impact risk, as large-scale movements by these holders could materially affect price discovery and liquidity conditions.
- Decentralization Considerations: The current holder structure suggests relatively limited decentralization, which may influence governance dynamics and market sentiment among community participants.
Macroeconomic Environment
- Regulatory Landscape: Evolving regulatory frameworks for DeFi protocols present both opportunities and challenges. Regulatory clarity in major jurisdictions could enhance institutional participation, while stringent compliance requirements may create operational hurdles.
- Competitive Dynamics: The presence of aggregation platforms and competing automated market makers (AMMs) within the Solana ecosystem intensifies market competition, potentially affecting RAY's market share and value proposition.
- Broader Market Conditions: Macroeconomic factors, including overall crypto market sentiment and capital flows, play a significant role in determining short-to-medium term price movements for RAY.
Technical Development and Ecosystem Growth
- Solana Network Health: RAY's value proposition is intrinsically linked to the performance and adoption of the Solana blockchain. Network upgrades, transaction throughput improvements, and overall ecosystem vitality directly influence RAY's utility and demand.
- Ecosystem Expansion: As the Solana DeFi ecosystem continues to expand, Raydium's role as a key liquidity provider and AMM protocol positions RAY to potentially benefit from increased platform usage and transaction volumes.
- DeFi Sector Trends: The broader development trajectory of decentralized finance, including innovations in liquidity provision, yield optimization, and cross-chain interoperability, creates both growth opportunities and competitive pressures for the protocol.
- Market Cycle Dynamics: Short-term price volatility may be influenced by episodic token release cycles and speculative activities within meme token markets that temporarily affect liquidity allocation across Solana-based assets.
III. 2026-2031 RAY Price Prediction
2026 Outlook
- Conservative Prediction: $0.67026 - $1.1969
- Neutral Prediction: Around $1.1969
- Optimistic Prediction: Up to $1.67566 (requires favorable market conditions and increased adoption)
2027-2029 Outlook
- Market Stage Expectation: RAY is anticipated to enter a gradual growth phase, with the average price potentially rising from $1.43628 in 2027 to $1.88368 by 2029, reflecting broader market recovery and DeFi sector development.
- Price Range Predictions:
- 2027: $1.0054 - $1.65172
- 2028: $1.49768 - $2.22336
- 2029: $1.16788 - $2.59948
- Key Catalysts: Expansion of the DeFi ecosystem, potential technological upgrades, and increased institutional participation in decentralized finance protocols.
2030-2031 Long-term Outlook
- Baseline Scenario: $2.15192 - $2.77956 in 2030 (assuming steady market growth and sustained protocol usage)
- Optimistic Scenario: $2.24158 - $3.28885 by 2031 (assuming accelerated DeFi adoption and favorable regulatory environment)
- Transformative Scenario: Potential to reach upper bounds of $3.28885 (contingent upon significant breakthrough in protocol innovation and mainstream adoption)
- 2026-01-15: RAY trading within early 2026 projected range, establishing foundation for potential multi-year growth trajectory
| Year |
Predicted High Price |
Predicted Average Price |
Predicted Low Price |
Price Change |
| 2026 |
1.67566 |
1.1969 |
0.67026 |
0 |
| 2027 |
1.65172 |
1.43628 |
1.0054 |
20 |
| 2028 |
2.22336 |
1.544 |
1.49768 |
29 |
| 2029 |
2.59948 |
1.88368 |
1.16788 |
57 |
| 2030 |
2.77956 |
2.24158 |
2.15192 |
87 |
| 2031 |
3.28885 |
2.51057 |
1.35571 |
110 |
IV. RAY Professional Investment Strategies and Risk Management
RAY Investment Methodology
(I) Long-term Holding Strategy
- Suitable for: Investors who believe in the growth potential of Solana ecosystem and decentralized exchange infrastructure
- Operational recommendations:
- Consider dollar-cost averaging to accumulate RAY positions during market corrections
- Monitor Raydium's TVL (Total Value Locked) growth and trading volume metrics as indicators of ecosystem health
- Storage solution: Use Gate Web3 Wallet for convenient management with enhanced security features
(II) Active Trading Strategy
- Technical analysis tools:
- Moving averages: Track 50-day and 200-day moving averages to identify trend reversals and momentum shifts
- RSI indicator: Monitor overbought (above 70) and oversold (below 30) conditions for potential entry and exit points
- Swing trading essentials:
- Set stop-loss orders at 8-12% below entry price to limit downside risk
- Take partial profits during strong upward movements, especially when RAY experiences 20-30% gains in short periods
RAY Risk Management Framework
(I) Asset Allocation Principles
- Conservative investors: 1-3% of crypto portfolio
- Aggressive investors: 5-10% of crypto portfolio
- Professional investors: Up to 15% with active monitoring and hedging strategies
(II) Risk Hedging Solutions
- Diversification approach: Balance RAY exposure with holdings in major cryptocurrencies like BTC and ETH to reduce volatility impact
- Liquidity management: Maintain at least 30-40% of holdings in stablecoins for opportunistic buying during market downturns
(III) Secure Storage Solutions
- Hot wallet recommendation: Gate Web3 Wallet for active traders requiring frequent access and seamless integration with Gate.com exchange
- Cold storage solution: Consider hardware wallets for long-term holdings exceeding 5-figure USD values
- Security precautions: Enable two-factor authentication, never share private keys, regularly update wallet software, and be vigilant against phishing attempts
V. RAY Potential Risks and Challenges
RAY Market Risks
- High volatility exposure: RAY has experienced a 77.42% decline over the past year, demonstrating significant price volatility that could result in substantial losses
- Liquidity concerns: With a market cap to fully diluted valuation ratio of 48.4%, future token unlocks may create selling pressure
- Competition intensity: Increasing competition from other DEXs on Solana and alternative blockchain platforms may impact market share and token value
RAY Regulatory Risks
- DeFi regulatory uncertainty: Evolving global regulations on decentralized finance protocols could affect Raydium's operations and token utility
- Securities classification concerns: Potential regulatory scrutiny regarding whether RAY could be classified as a security in certain jurisdictions
- Compliance requirements: Possible future KYC/AML requirements for DeFi platforms may impact user adoption and platform growth
RAY Technical Risks
- Smart contract vulnerabilities: Despite audits, potential undiscovered bugs could lead to exploits and loss of user funds
- Solana network dependency: RAY's performance is directly tied to Solana blockchain stability; network outages or congestion could impact functionality
- Protocol upgrade risks: Technical changes to Raydium's AMM mechanism or fee structure may have unintended consequences on token economics
VI. Conclusion and Action Recommendations
RAY Investment Value Assessment
Raydium represents a foundational infrastructure project within the Solana DeFi ecosystem, offering exposure to the growth of decentralized trading. With 249,645 holders and availability on 44 exchanges, RAY demonstrates reasonable adoption. However, the 77.42% decline over the past year and distance from its all-time high of $16.83 highlight substantial volatility risks. The recent 27.65% gain over 30 days suggests recovering momentum, but investors should approach with caution given the project's sensitivity to broader Solana ecosystem performance and DeFi market conditions.
RAY Investment Recommendations
✅ Beginners: Start with small positions (0.5-1% of crypto portfolio) and focus on learning about AMM mechanics before increasing exposure
✅ Experienced investors: Consider RAY as a tactical allocation (3-7% of crypto portfolio) with clear profit-taking levels and stop-losses in place
✅ Institutional investors: Evaluate RAY as part of a diversified DeFi infrastructure basket with active risk monitoring and correlation analysis
RAY Trading Participation Methods
- Spot trading: Purchase RAY directly on Gate.com for straightforward exposure with full ownership of tokens
- Liquidity provision: Participate in Raydium's liquidity pools to earn trading fees, though this introduces impermanent loss risks
- Gradual accumulation: Implement dollar-cost averaging strategies during periods of market weakness to build positions systematically
Cryptocurrency investment carries extremely high risks, and this article does not constitute investment advice. Investors should make prudent decisions based on their own risk tolerance and are advised to consult professional financial advisors. Never invest more than you can afford to lose.
FAQ
What is RAY token and what is its purpose?
RAY is the native token of Raydium, a Solana-based automated market maker. It provides liquidity incentives, governance rights, staking rewards, and access to new project launches on the platform.
RAY is currently trading at 1.1723 USD, down 0.12% in the past 24 hours. Historically, RAY reached its all-time low of 0.1300 USD on January 4, 2023, demonstrating significant recovery and growth potential in the market.
Will RAY price rise or fall in 2024?
RAY price predictions for 2024 range from $1.389 to $5.476. Bullish forecasts suggest upside potential to $10, while bearish scenarios indicate downside risk. Market dynamics will determine the actual direction.
What are the main factors affecting RAY price?
RAY price is mainly influenced by user activity, trading volume, ecosystem events like token burns and upgrades, whale transfers, and social media sentiment. Market liquidity and broader crypto market trends also play significant roles.
What are the advantages of RAY compared to other similar tokens?
RAY utilizes AMM mechanism providing automatic liquidity, reducing intermediaries and lowering transaction costs. It excels on decentralized trading platforms with higher efficiency and smoother transactions compared to traditional centralized exchanges.
What are the risks of investing in RAY tokens?
RAY token investments face market volatility and regulatory uncertainty. Price fluctuations can significantly impact investment value. The DeFi sector remains subject to evolving regulatory frameworks that may affect token performance and liquidity.
RAY's technical and fundamental analysis?
RAY shows a 64% maximum pullback with attractive valuation. Strong fundamentals support mid-to-long term potential. Wait for technical and fundamental signals to align before positioning.
What is the development prospect and roadmap of the RAY project?
RAY project demonstrates significant progress in AI ecosystem construction, with plans to expand technological applications and maintain leadership in big data processing. The project shows strong growth potential in distributed computing and machine learning infrastructure development.
* The information is not intended to be and does not constitute financial advice or any other recommendation of any sort offered or endorsed by Gate.