This comprehensive article provides expert analysis of RedStone (RED), a fast-growing oracle solution, with detailed price predictions spanning 2026-2031. The analysis examines RED's historical performance from its January 2025 launch at $0.7525 through its current trading price of $0.2487, while evaluating key factors including supply dynamics, institutional positioning, macroeconomic influences, and ecosystem development. The article presents conservative to optimistic price forecasts, ranging from $0.22871 to $0.32069 for 2026, with potential long-term appreciation to $0.55137+ by 2031 under favorable conditions. Professional investment strategies, risk management frameworks, and detailed guidance for beginners, experienced, and institutional investors are provided to help readers make informed decisions about RED token allocation on Gate exchange. The analysis also addresses potential regulatory, technical, and market risks inherent in this emerging oracle infrastructure project.
Introduction: RED's Market Position and Investment Value
RedStone (RED), as the fastest-growing oracle solution in the cryptocurrency space, has established itself as a pioneering force in the oracle infrastructure sector since its launch in 2025. As of January 18, 2026, RED maintains a market capitalization of approximately $75.55 million with a circulating supply of around 303.78 million tokens, trading at approximately $0.2487. This asset, recognized as a leading oracle provider for yield-bearing assets, is playing an increasingly critical role in supporting DeFi protocols, particularly in serving LRTs, LSTs, and stablecoin projects like Ethena and Elixir.
This article will comprehensively analyze RED's price trajectory from 2026 to 2031, combining historical patterns, market supply and demand dynamics, ecosystem development, and macroeconomic conditions to provide investors with professional price forecasts and practical investment strategies.
I. RED Price History Review and Market Status
RED Historical Price Evolution Trajectory
- January 2025: RED token launched on Gate.com at an initial price of $0.7525, marking the beginning of its trading history
- September 2025: Price reached a peak of $0.9771, representing a significant milestone in RED's early market performance
- December 2025: Market experienced a correction, with the price declining to its lowest point of $0.1958
RED Current Market Situation
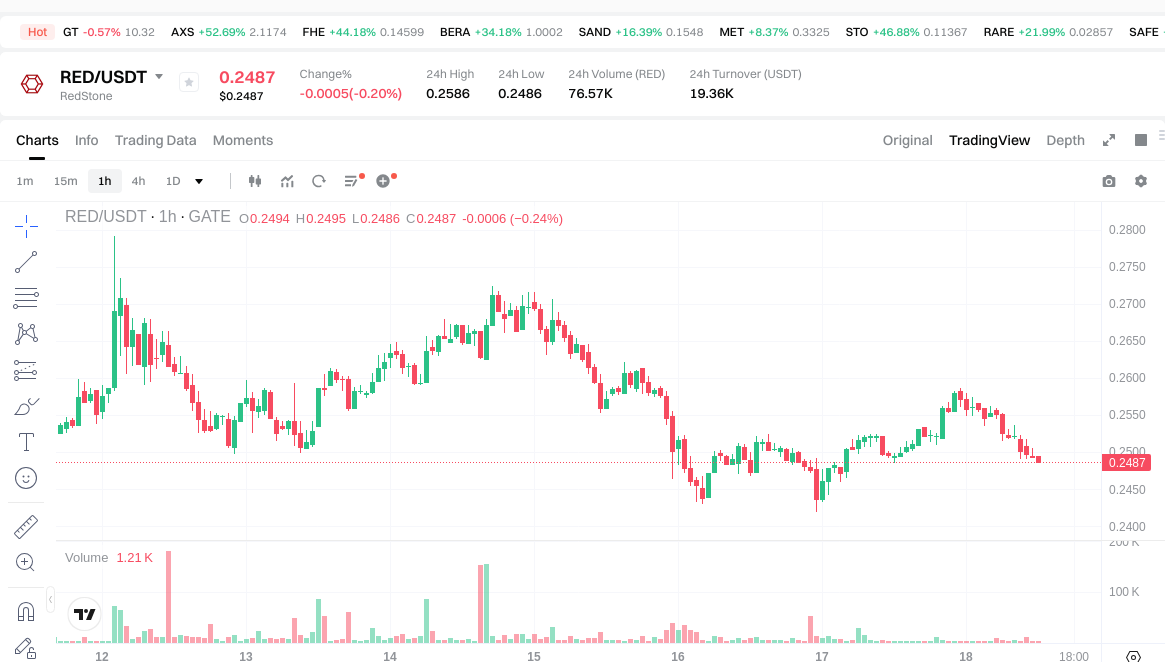
As of January 18, 2026, RED is trading at $0.2487, showing a slight decline of 0.16% over the past 24 hours. The token's 24-hour trading range spans from $0.2487 to $0.2586, with a total trading volume of $19,380.16.
From a broader perspective, RED has demonstrated mixed performance across different timeframes. The 1-hour change shows a marginal decrease of 0.2%, while the 7-day performance reflects a decline of 2.05%. However, the 30-day trend presents a more positive outlook with a gain of 22.08%. Over the annual timeframe, the token has experienced a decline of 37.42% from its historical levels.
The token's market capitalization currently stands at approximately $75.55 million, with a circulating supply of 303,783,257 RED tokens, representing 30.38% of the maximum supply of 1 billion tokens. The fully diluted market cap is calculated at $248.7 million. RED maintains a market dominance of 0.0073% and ranks 427th among cryptocurrencies.
The token is deployed on the Ethereum network following the ERC-20 standard, with its contract address at 0xc43c6bfeda065fe2c4c11765bf838789bd0bb5de. The project has attracted a community of 10,573 holders and is available for trading on 26 exchanges.
RedStone positions itself as a rapidly growing oracle solution, distinguishing itself as a provider of Actively Validated Services with Restaking capabilities. The platform has established a presence in the yield-bearing assets sector, serving projects focused on Liquid Restaking Tokens (LRTs), Liquid Staking Tokens (LSTs), and various stablecoin initiatives.
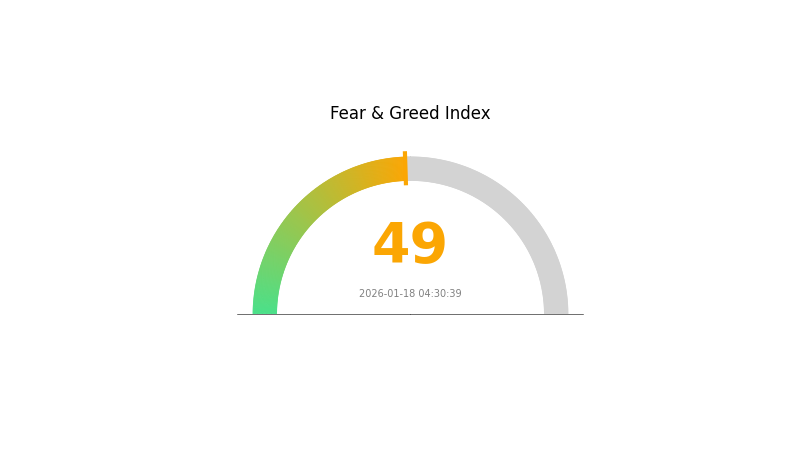
The current market sentiment indicator for RED registers at 49, classified within the neutral range, suggesting a balanced market outlook without extreme bullish or bearish tendencies.
Click to view the current RED market price
RED Market Sentiment Index
2026-01-18 Fear and Greed Index: 49 (Neutral)
Click to view the current Fear & Greed Index
The crypto market is currently displaying neutral sentiment with an index reading of 49. This balanced state suggests that neither fear nor greed is dominating market participants' behavior. Investors should maintain a measured approach, avoiding emotional decision-making while staying alert to market developments. A neutral environment typically presents opportunities for thoughtful portfolio management and risk assessment.
RED Holding Distribution
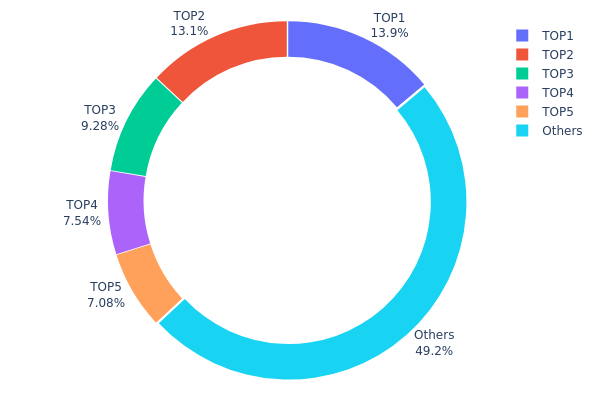
The holding distribution chart reflects the concentration of token ownership across different addresses on the blockchain, serving as a crucial indicator for assessing decentralization levels and potential market manipulation risks. By analyzing the distribution pattern of RED tokens among top holders and retail addresses, we can evaluate the project's on-chain governance structure and price stability characteristics.
According to current data, the top 5 addresses collectively hold 303,380.40K RED tokens, representing 50.79% of the total supply. The largest holder (0xa77e...d51b2e) controls 13.85% of the supply, while the second-largest address (0xb286...d3a654) holds 13.06%. This concentration pattern reveals a moderately centralized distribution structure, where although no single address dominates absolute control, the combined influence of major holders remains significant. The remaining 49.21% distributed among other addresses indicates a relatively balanced retail participation, which helps mitigate extreme concentration risks to some extent.
This distribution structure presents both opportunities and challenges for RED's market performance. On one hand, the moderate diversification among top holders reduces the likelihood of single-entity price manipulation, while the substantial retail base provides essential market liquidity. On the other hand, the combined holdings of top addresses approaching 51% creates potential selling pressure concentration risks. Any coordinated actions by major holders could trigger significant price volatility, particularly during adverse market conditions. From a decentralization perspective, RED's current distribution demonstrates a transitional state between centralized and fully decentralized models, requiring ongoing monitoring of large holder behavior patterns and potential on-chain fund flows to assess market health and structural stability.
Click to view current RED Holding Distribution
| Top |
Address |
Holding Qty |
Holding (%) |
| 1 |
0xa77e...d51b2e |
82727.28K |
13.85% |
| 2 |
0xb286...d3a654 |
78000.00K |
13.06% |
| 3 |
0xf39e...892dec |
55374.95K |
9.27% |
| 4 |
0xba54...031ff7 |
45000.00K |
7.53% |
| 5 |
0x7ab8...415a5b |
42278.17K |
7.08% |
| - |
Others |
293619.60K |
49.21% |
II. Core Factors Affecting RED's Future Price Trend
Supply Mechanisms
- Supply Reduction Dynamics: Supply constraints and reduction mechanisms play a crucial role in determining asset scarcity and value appreciation potential. Historical patterns demonstrate that controlled supply reduction typically generates upward price pressure when demand remains stable or increases.
- Historical Patterns: Past supply adjustments in cryptocurrency markets have consistently influenced price trajectories, with reduction events often preceding significant valuation shifts as market participants anticipate decreased availability.
- Current Impact: Present supply dynamics continue to shape market expectations, with ongoing reduction mechanisms potentially supporting price stability and creating conditions favorable for gradual appreciation.
Institutional and Major Holder Dynamics
- Institutional Positioning: Market analysis suggests institutional participants maintain varying positions across cryptocurrency assets, with allocation strategies influenced by risk management frameworks and regulatory considerations.
- Corporate Adoption: Enterprise integration of digital assets remains selective, with adoption decisions driven by utility considerations, regulatory compliance requirements, and strategic business objectives.
- National Policy Framework: Government approaches to digital asset regulation continue evolving, with policy developments potentially affecting market access, operational frameworks, and institutional participation levels.
Macroeconomic Environment
- Monetary Policy Influence: Central bank policy trajectories, particularly regarding interest rate decisions and liquidity conditions, significantly impact cryptocurrency valuations. The Federal Reserve's monetary stance and similar policies from major central banks create backdrop conditions affecting risk asset appetite and digital asset pricing dynamics.
- Inflation Hedge Characteristics: Digital assets demonstrate varying correlations with inflation metrics, with market perception of their inflation-hedging properties influencing investment flows during periods of currency devaluation concerns.
- Geopolitical Factors: International tensions and political uncertainties contribute to market volatility, with geopolitical developments occasionally driving safe-haven demand or risk-off sentiment that impacts cryptocurrency pricing patterns.
Technological Development and Ecosystem Building
- Network Advancement: Ongoing technological improvements focus on scalability enhancements, security optimizations, and functionality expansions that aim to improve network performance and user experience.
- Protocol Evolution: Continuous protocol development addresses technical limitations and introduces new capabilities, potentially expanding use cases and strengthening competitive positioning within the broader digital asset landscape.
- Ecosystem Applications: The development of decentralized applications and ecosystem projects contributes to network utility and user engagement, with successful implementations potentially driving increased adoption and supporting long-term value propositions.
III. 2026-2031 RED Price Prediction
2026 Outlook
- Conservative forecast: $0.22871 - $0.2486
- Neutral forecast: $0.2486
- Optimistic forecast: $0.32069 (requires favorable market conditions and increased adoption)
2027-2029 Outlook
- Market stage expectation: RED is anticipated to enter a gradual growth phase, with price volatility reflecting broader crypto market dynamics and project-specific developments
- Price range predictions:
- 2027: $0.19925 - $0.33873
- 2028: $0.2961 - $0.45507
- 2029: $0.26453 - $0.39871
- Key catalysts: Market sentiment shifts, potential protocol upgrades, and expanding ecosystem partnerships could drive price appreciation during this period
2030-2031 Long-term Outlook
- Baseline scenario: $0.27373 - $0.39104 (assuming steady market growth and sustained project development)
- Optimistic scenario: $0.47121 - $0.55137 (contingent on significant adoption breakthroughs and favorable regulatory environment)
- Transformative scenario: Potential to exceed $0.55137 (requires exceptional market conditions, mainstream integration, and substantial ecosystem expansion)
- 2026-01-18: RED trading activity continues as the project navigates early development stages
| Year |
Predicted High Price |
Predicted Average Price |
Predicted Low Price |
Price Change |
| 2026 |
0.32069 |
0.2486 |
0.22871 |
0 |
| 2027 |
0.33873 |
0.28465 |
0.19925 |
14 |
| 2028 |
0.45507 |
0.31169 |
0.2961 |
25 |
| 2029 |
0.39871 |
0.38338 |
0.26453 |
53 |
| 2030 |
0.55137 |
0.39104 |
0.27373 |
56 |
| 2031 |
0.52775 |
0.47121 |
0.38639 |
89 |
IV. RED Professional Investment Strategy and Risk Management
RED Investment Methodology
(1) Long-term Holding Strategy
- Target Investors: Believers in oracle infrastructure development and DeFi ecosystem growth
- Operational Recommendations:
- Consider accumulating positions during market corrections when RED trades below its 30-day moving average
- Monitor RedStone's oracle service adoption metrics and partnership announcements as fundamental indicators
- Utilize Gate Web3 Wallet for secure long-term storage, enabling participation in potential staking opportunities
(2) Active Trading Strategy
- Technical Analysis Tools:
- Volume Profile: Track the 24-hour trading volume of approximately $19,380 to identify liquidity zones and potential support/resistance levels
- Moving Averages: Use 7-day and 30-day MAs to gauge short-to-medium term trends; current 7-day decline of 2.05% suggests near-term caution
- Swing Trading Points:
- Consider taking profits near the 24-hour high of $0.2586 and re-entering positions closer to support at $0.2487
- Monitor price action around the current trading range as RED has shown 22.08% gains over 30 days despite recent weakness
RED Risk Management Framework
(1) Asset Allocation Principles
- Conservative Investors: 1-3% of crypto portfolio
- Aggressive Investors: 5-10% of crypto portfolio
- Professional Investors: 10-15% of crypto portfolio, with active position management
(2) Risk Hedging Solutions
- Portfolio Diversification: Balance RED exposure with established oracle competitors and blue-chip cryptocurrencies
- Stop-Loss Implementation: Consider setting stop-losses 15-20% below entry points to limit downside exposure
(3) Secure Storage Solutions
- Hot Wallet Recommendation: Gate Web3 Wallet for active trading and convenient access to DeFi protocols
- Cold Storage Solution: Hardware wallets for long-term holdings exceeding $10,000 in value
- Security Precautions: Never share private keys, enable two-factor authentication, and regularly verify contract addresses (0xc43c6bfeda065fe2c4c11765bf838789bd0bb5de) before transactions
V. RED Potential Risks and Challenges
RED Market Risks
- High Volatility: RED has experienced significant price fluctuations, declining 37.42% over one year from its previous high of $0.9771
- Limited Liquidity: With 24-hour trading volume of approximately $19,380, large orders may experience slippage
- Market Sentiment Dependency: As a relatively newer oracle project, RED's price may be heavily influenced by broader crypto market trends and sentiment shifts
RED Regulatory Risks
- Oracle Classification Uncertainty: Evolving regulations may impact how oracle services and their native tokens are classified by different jurisdictions
- DeFi Regulatory Scrutiny: Increased regulatory attention on DeFi protocols could affect oracle providers and their token economics
- Cross-border Compliance: RedStone's global operations may face varying regulatory requirements across different markets
RED Technical Risks
- Smart Contract Vulnerabilities: As an ERC-20 token deployed on Ethereum, RED is subject to potential smart contract exploits or bugs
- Oracle Competition: Intense competition from established oracle providers may limit RedStone's market share growth
- Integration Dependencies: RED's value proposition relies on successful integration with DeFi protocols, LSTs, and LRTs
VI. Conclusion and Action Recommendations
RED Investment Value Assessment
RedStone (RED) presents an interesting opportunity in the oracle infrastructure sector, particularly with its focus on yield-bearing assets and restaking services. The token has demonstrated resilience with a 22.08% gain over 30 days, though the 37.42% annual decline and current circulation of only 30.38% of total supply warrant careful consideration. The project's unique positioning in serving LRTs, LSTs, and stablecoins like Ethena represents a potential growth catalyst, though investors should remain cognizant of the competitive oracle landscape and RED's relatively modest market capitalization of approximately $75.5 million.
RED Investment Recommendations
✅ Beginners: Start with a small allocation (1-2% of crypto portfolio) and use dollar-cost averaging to build positions gradually. Focus on understanding RedStone's oracle technology and monitor partnership announcements before increasing exposure.
✅ Experienced Investors: Consider RED as a speculative allocation (3-7% of crypto portfolio) within a diversified oracle sector strategy. Actively manage positions based on technical indicators and fundamental developments in the restaking ecosystem.
✅ Institutional Investors: Evaluate RED as part of a broader DeFi infrastructure thesis, with position sizing based on thorough due diligence of RedStone's technology stack, competitive positioning, and token unlock schedule. Monitor circulating supply increases closely.
RED Trading Participation Methods
- Spot Trading: Purchase RED directly on Gate.com with major trading pairs, suitable for long-term positioning and active trading strategies
- Portfolio Allocation: Include RED as part of a diversified oracle sector basket alongside infrastructure tokens
- Technical Trading: Utilize Gate.com's advanced charting tools to identify entry and exit points based on support/resistance levels
Cryptocurrency investment carries extremely high risks, and this article does not constitute investment advice. Investors should make prudent decisions based on their own risk tolerance and are advised to consult professional financial advisors. Never invest more than you can afford to lose.
FAQ
RED coin experienced significant volatility over the past year, with prices fluctuating from highs to lows. The recent price stands at 0.3664, reflecting the dynamic market movements throughout the period.
What are the main factors influencing RED price predictions?
RED price is primarily influenced by supply mechanisms and token burn mechanisms. Historical burn events typically drive short-term price increases. Market demand, transaction volume, and overall crypto market sentiment also play significant roles in price movements.
What is the price prediction for RED coin in 2024? How do experts view it?
Experts predict RED coin could experience significant upside potential in 2024, driven by increasing adoption and market momentum. The token shows strong fundamentals with growing trading volume, suggesting bullish sentiment among analysts for near-term price appreciation.
How does RED coin's investment potential compare to mainstream cryptocurrencies like BTC and ETH?
RED offers emerging growth potential with lower market capitalization, unlike established BTC and ETH. Early-stage coins present higher volatility but greater upside opportunities for investors seeking alternative exposure beyond mainstream digital assets.
What are the risks of investing in RED coins? What should I pay attention to?
RED coin risks include immature technology, mainnet launch delays, and market sentiment fluctuations. Monitor macroeconomic factors like Federal Reserve decisions. Cross-chain and AI integration remain unproven, so stay informed on project developments and market conditions.
How is RED's technical foundation and project prospects? What impact does this have on price?
RED has solid technical foundation with 1 billion total supply and 28% circulation. Strong project fundamentals and positive market sentiment drive price appreciation. Growing adoption and ecosystem development support long-term upside potential.
How to predict RED coin price trends through technical analysis?
Analyze RED price charts to identify support and resistance levels. Apply technical indicators like moving averages and RSI to forecast price movements based on trading volume and market trends.
What are the circulating supply and market cap of RED coin? What is the significance for price prediction?
RED's circulating market cap ranges between 150-360 million USD in the short term. Market cap directly influences price volatility and demand dynamics. Higher market cap generally indicates stronger liquidity and reduced price manipulation risk, supporting more stable price movements and clearer trend predictions.
* The information is not intended to be and does not constitute financial advice or any other recommendation of any sort offered or endorsed by Gate.