This comprehensive analysis examines Render Network (RENDER), a decentralized GPU computing infrastructure token currently trading at $2.37 with a $1.23B market cap. The article reviews RENDER's price trajectory from its 2020 launch through January 2026, analyzing historical patterns, supply-demand dynamics, and ecosystem milestones. Key drivers include the Burn and Mint Equilibrium tokenomics model, Solana migration enhancing scalability, and expanding enterprise adoption in 3D rendering and AI applications. Price forecasts range from $2.02-$2.49 in 2026, extending to $3.78-$4.84 by 2031 under various scenarios. The analysis covers institutional positioning within the DePIN sector, technical developments, and macroeconomic influences on GPU computing demand. Investment strategies address long-term holding, active trading approaches, and comprehensive risk management frameworks. The assessment highlights market opportunities balanced against volatility risks, regulatory uncertainties, and competitive pressure
Introduction: RENDER's Market Position and Investment Value
Render Network (RENDER), positioned as a decentralized GPU computing infrastructure for 3D rendering and emerging applications, has established significant presence since its launch in 2020. As of January 2026, RENDER has achieved a market capitalization of approximately $1.23 billion with a circulating supply of around 518.67 million tokens, maintaining a price level near $2.37. This asset, recognized as a pioneer in decentralized GPU resource utilization, is playing an increasingly vital role in addressing the growing demand for computational power across digital content creation and AI-driven rendering workflows.
This article will comprehensively analyze RENDER's price trajectory from 2026 to 2031, combining historical patterns, market supply-demand dynamics, ecosystem development milestones, and macroeconomic conditions to provide professional price forecasts and practical investment strategies for market participants.
I. RENDER Price History Review and Market Status
RENDER Historical Price Evolution Trajectory
- 2020: Render Network recorded its historical low point, with the price reaching $0.0368 in June
- 2023: Project officially launched on Gate.com in November at $0.25, demonstrating initial market recognition
- 2024: Network experienced significant growth momentum, with the price reaching $13.60 in March, reflecting increased adoption of decentralized GPU computing solutions
RENDER Current Market Situation
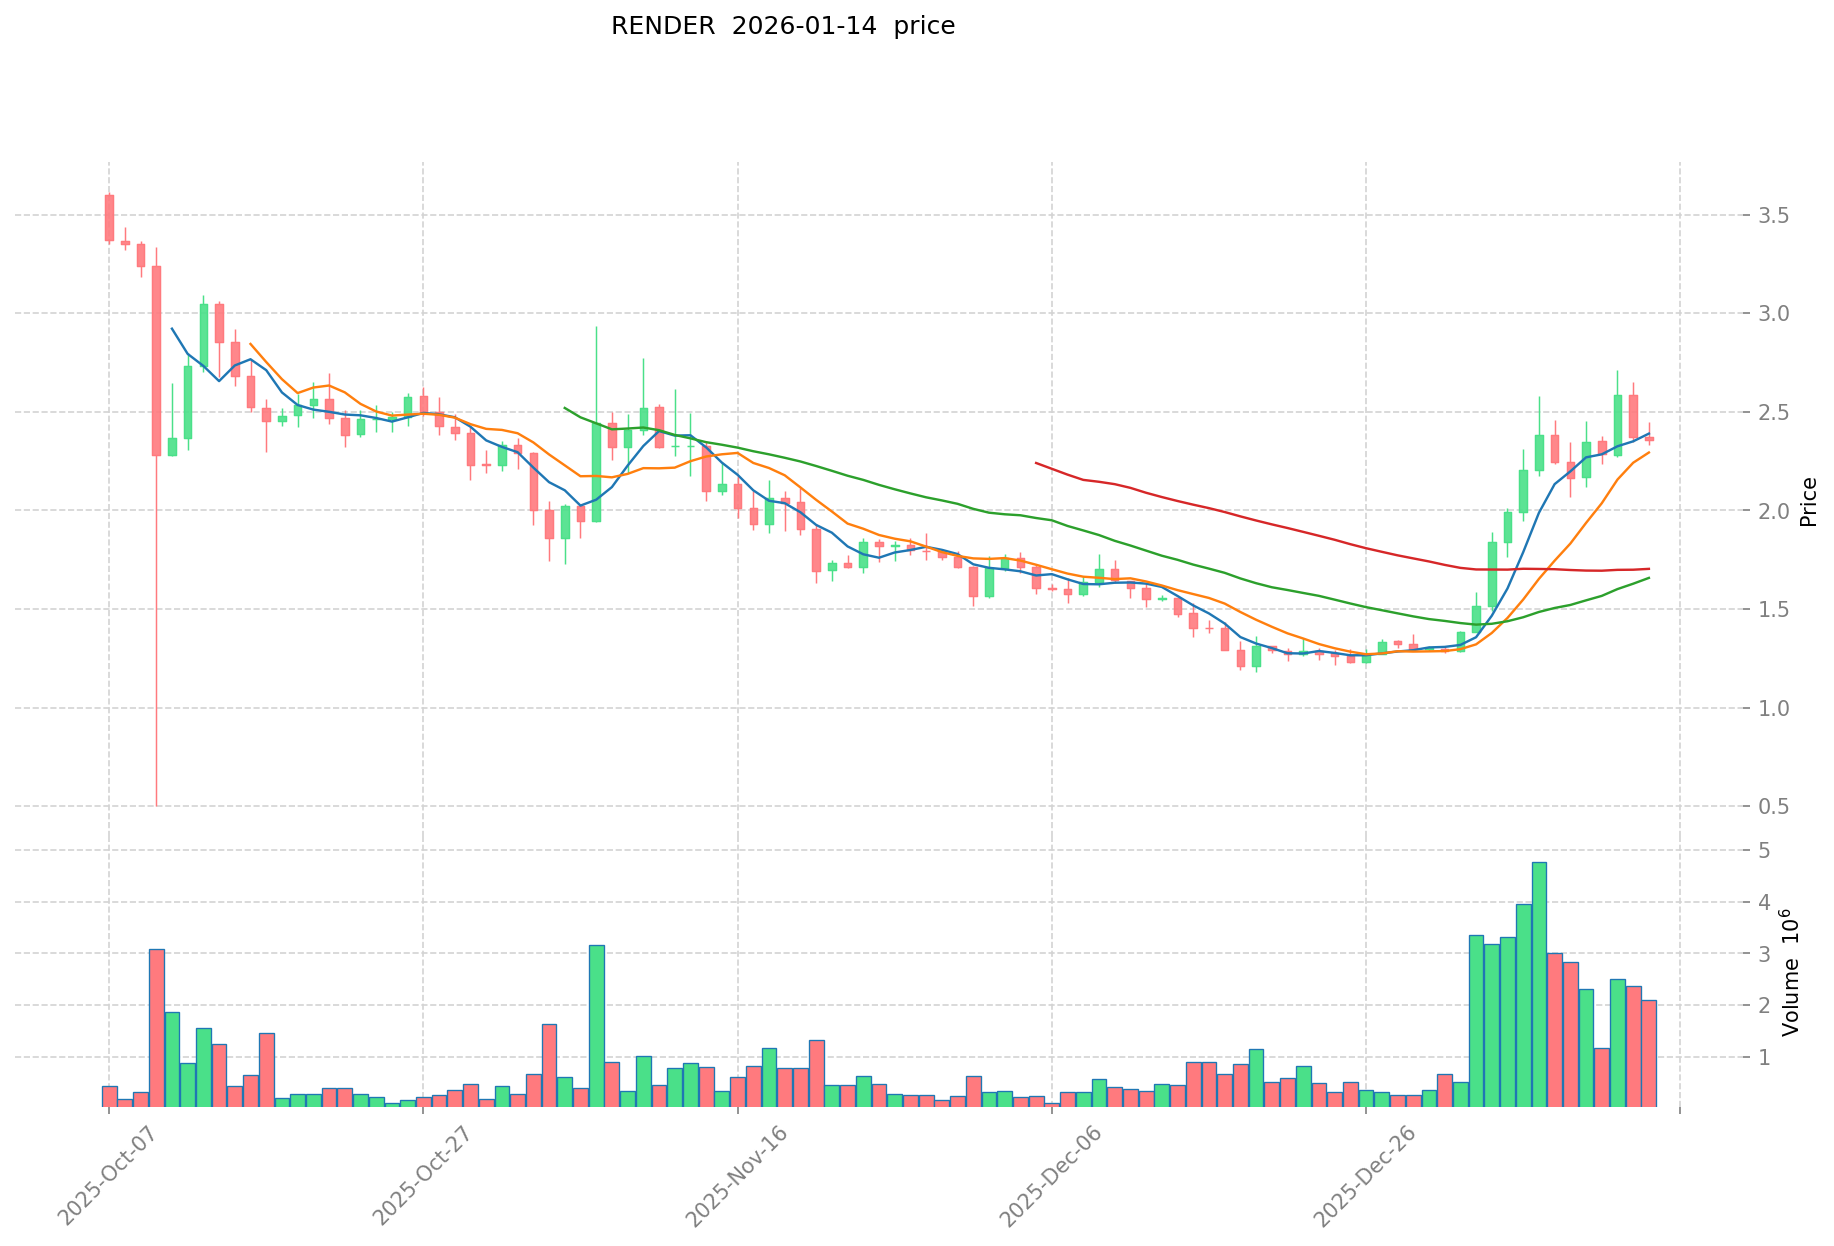
As of January 14, 2026, RENDER is trading at $2.3725, with a 24-hour trading volume of approximately $5.07 million. The token has shown relatively stable short-term performance, with price fluctuations of -0.16% in the past hour and -0.39% over the past 24 hours. The weekly performance remains relatively flat at -0.15%.
The market capitalization stands at approximately $1.23 billion, with RENDER ranking 75th among digital assets and holding a 0.037% market share. The circulating supply represents 97.45% of the total supply, with 518.67 million tokens in circulation out of a maximum supply of 532.22 million tokens.
The 30-day performance shows notable growth of 60.89%, indicating renewed interest in GPU computing solutions. However, the annual performance reflects a -65.92% decline, suggesting the token has undergone significant price correction from previous levels. The current price represents approximately 82.55% below the historical high recorded in March 2024.
Render Network continues to leverage decentralized GPU processing infrastructure to provide near real-time rendering services, addressing growing computational demands across 3D rendering and emerging applications. The network operates by utilizing idle GPU resources to enhance rendering speed, reduce costs, and scale operations while rewarding GPU providers.
Click to view current RENDER market price
RENDER Market Sentiment Index
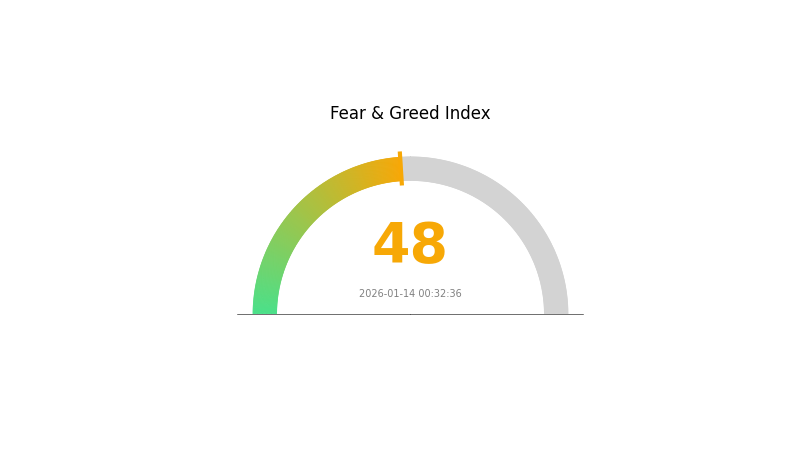
2026-01-14 Fear and Greed Index: 48 (Neutral)
Click to view the current Fear & Greed Index
The crypto market is currently in a neutral sentiment state with an index reading of 48. This balanced positioning suggests that market participants are neither excessively fearful nor overly greedy. Investors should maintain a measured approach, carefully evaluating market conditions before making trading decisions. At this neutral level, both opportunities and risks exist in the market. Prudent risk management and thorough analysis remain essential for navigating the current market environment effectively.
RENDER Holdings Distribution
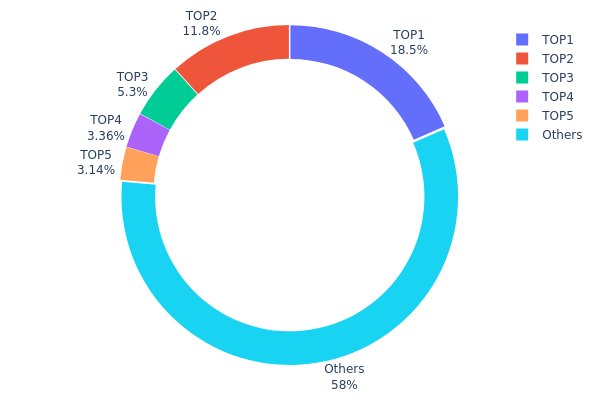
The holdings distribution chart reflects the concentration of RENDER tokens across different address tiers, providing critical insights into the token's on-chain ownership structure. According to the current data, the top holder controls approximately 86.98 million RENDER tokens, representing 18.45% of the circulating supply, while the second-largest address holds 55.48 million tokens (11.77%). The top five addresses collectively account for 42.01% of the total supply, with the remaining 57.99% distributed among smaller holders. This distribution pattern reveals a moderate level of concentration, where nearly half of the tokens are controlled by a small number of major holders.
From a market structure perspective, this concentration level presents both opportunities and risks. The presence of large holders typically indicates institutional involvement or protocol-related treasury holdings, which can provide liquidity stability. However, the substantial holdings by top addresses—particularly the leading wallet controlling nearly one-fifth of the supply—introduces potential volatility risks if these positions are liquidated or redistributed. The relatively balanced distribution between top holders and the broader market (42% versus 58%) suggests a healthier structure compared to many emerging tokens that exhibit extreme concentration exceeding 70% among top addresses.
The current holdings distribution reflects a maturing token economy with reasonable decentralization characteristics. While not fully distributed, RENDER demonstrates sufficient dispersion to mitigate extreme manipulation risks while maintaining enough concentration to support strategic liquidity management. This structure aligns with typical patterns observed in established infrastructure tokens, where project treasuries and early strategic investors maintain significant positions alongside growing retail and institutional participation.
Click to view the current RENDER Holdings Distribution
| Top |
Address |
Holding Qty |
Holding (%) |
| 1 |
AZB72t...m2qAdC |
86981.43K |
18.45% |
| 2 |
9WzDXw...YtAWWM |
55484.98K |
11.77% |
| 3 |
CPj5Jg...SXKrvv |
25000.04K |
5.30% |
| 4 |
EuPYwH...tVxF58 |
15858.56K |
3.36% |
| 5 |
HcTix2...eaAHwS |
14797.05K |
3.13% |
| - |
Others |
273277.51K |
57.99% |
II. Core Factors Influencing RENDER's Future Price
Supply Mechanism
- Burn and Mint Equilibrium (BME) Model: RENDER has transitioned to a new tokenomics model featuring a net emission cap. This mechanism aims to achieve long-term supply-demand balance and potential deflation by burning tokens during network usage while minting new tokens under controlled conditions.
- Historical Patterns: The network's rendering activity has shown steady growth, with total rendered frames increasing by 63% year-over-year. Transaction volumes have grown approximately 1.7 times compared to the previous year, reflecting expanding platform adoption.
- Current Impact: The implementation of the BME model, combined with migration to Solana, is expected to enhance tokenomics efficiency. With controlled supply emissions and increased network activity, the model may support price stability and potential appreciation as demand for GPU rendering services continues to grow.
Institutional and Major Holder Dynamics
- Institutional Positioning: RENDER holds significant standing within the DePIN (Decentralized Physical Infrastructure Networks) sector, ranking second in market capitalization after Filecoin, surpassing established projects including Arweave and Helium. The project maintains approximately $1.74 billion in market capitalization.
- Enterprise Adoption: The platform has established partnerships with enterprise-grade infrastructure providers. The network serves creators and enterprises requiring GPU rendering capabilities, with successful completion of over 140,000 frames since its April launch, achieving a 92% success rate. The platform's underlying technology, OctaneRender, has been utilized by prominent media entities for digital content creation.
- Development Activity: RENDER's ecosystem includes active collaborations with cloud computing platforms, aiming to integrate AI community demands into the network's computational infrastructure. Recent proposals include partnerships with FEDML cloud platform and other computing clients, enabling AI developers to access distributed GPU resources seamlessly.
Macroeconomic Environment
- Monetary Policy Impact: Recent U.S. employment data showing moderate recovery has influenced expectations for Federal Reserve policy, with the probability of a January rate cut declining to 11.1% from 17.7%. The December unemployment rate of 4.4% came in below the expected 4.5%, suggesting labor market resilience that may affect risk asset sentiment.
- Inflation Hedge Characteristics: As a utility token within the GPU computing ecosystem, RENDER's value proposition relates more directly to demand for rendering and AI infrastructure services rather than serving as a traditional inflation hedge. Its performance reflects technological adoption trends rather than purely monetary dynamics.
- Geopolitical Factors: Market volatility has been observed in response to international events, including incidents affecting energy infrastructure in certain regions. However, RENDER's price movement demonstrates relative independence from macro-driven cryptocurrency cycles, with its trajectory more closely tied to GPU computing ecosystem fundamentals.
Technical Development and Ecosystem Building
- Solana Migration: RENDER completed a significant infrastructure upgrade by migrating from Polygon to Solana ecosystem. This transition addresses the network's growing scalability requirements, with Solana offering faster transaction speeds, lower costs, and enhanced capacity to process the network's expanding vision. The migration involved transitioning from the legacy RNDR token to the new SPL-standard RENDER token.
- Multi-Renderer Expansion: The platform has expanded beyond its original OctaneRender foundation to support multiple rendering engines, including Maxon's Redshift, Physical, and Standard renderers. This diversification broadens the platform's appeal to a wider range of creative professionals and enterprise users.
- Ecosystem Applications: RENDER is positioning itself at the intersection of rendering, AI, and digital rights management (DRM) applications. The platform enables fast, low-cost multi-party royalty streams, which holds significance for next-generation streaming application monetization. Through Solana integration, RENDER can bring complex 3D assets, intellectual property, and AI-generated works' DRM and royalty structures on-chain. The network maintains active node operators, with approximately 250 nodes consistently generating revenue, and continues to expand its computational client base to serve AI development communities.
III. 2026-2031 RENDER Price Forecast
2026 Outlook
- Conservative Forecast: $2.02 - $2.37
- Neutral Forecast: $2.37 - $2.49
- Optimistic Forecast: $2.49 (requires sustained adoption momentum and favorable market sentiment)
2027-2029 Mid-term Outlook
- Market Phase Expectation: RENDER may experience a period of volatility with potential retracement in 2027, followed by gradual recovery and growth momentum building through 2028-2029 as the rendering network ecosystem matures.
- Price Range Forecast:
- 2027: $1.61 - $3.45
- 2028: $2.15 - $3.33
- 2029: $2.01 - $4.55
- Key Catalysts: Network utilization growth, expanded GPU rendering capacity, strategic partnerships within the creative industry, and broader adoption of decentralized rendering solutions could serve as primary drivers for price appreciation during this period.
2030-2031 Long-term Outlook
- Baseline Scenario: $2.84 - $3.84 (assuming steady ecosystem development and market stabilization)
- Optimistic Scenario: $3.84 - $4.95 (contingent upon accelerated institutional adoption and significant expansion of rendering use cases)
- Transformational Scenario: $4.39 - $4.95 (requires breakthrough integration with major entertainment studios, sustained bull market conditions, and mainstream acceptance of decentralized GPU networks)
- 2026-01-14: RENDER trading dynamics suggest the token is positioned at an early stage of its projected growth trajectory, with technical developments and market adoption playing crucial roles in realizing these forecast ranges.
| Year |
Predicted High Price |
Predicted Average Price |
Predicted Low Price |
Price Change |
| 2026 |
2.49207 |
2.3734 |
2.01739 |
0 |
| 2027 |
3.45448 |
2.43274 |
1.60561 |
2 |
| 2028 |
3.32628 |
2.94361 |
2.14883 |
24 |
| 2029 |
4.54567 |
3.13494 |
2.00636 |
32 |
| 2030 |
4.954 |
3.84031 |
2.84183 |
61 |
| 2031 |
4.83687 |
4.39715 |
3.78155 |
85 |
IV. RENDER Professional Investment Strategy and Risk Management
RENDER Investment Methodology
(1) Long-term Holding Strategy
- Suitable for: Investors who believe in the long-term potential of decentralized GPU computing networks and can tolerate market volatility
- Operational recommendations:
- Consider accumulating positions during market corrections when RENDER trades below its 30-day average
- Monitor the network's GPU utilization metrics and adoption by rendering service providers as key indicators
- Gate Web3 Wallet offers a secure storage solution for long-term RENDER holders
(2) Active Trading Strategy
- Technical analysis tools:
- Moving Averages: Track 50-day and 200-day moving averages to identify potential trend reversals and entry points
- Volume Analysis: Monitor 24-hour trading volume (currently $5.07M) to confirm price movements and assess market participation
- Swing trading key points:
- RENDER has shown a 60.89% increase over the past 30 days, suggesting potential for continued momentum trading
- Set stop-loss orders to manage downside risk, particularly given the token's 65.92% decline over the past year
RENDER Risk Management Framework
(1) Asset Allocation Principles
- Conservative investors: 2-5% of crypto portfolio
- Aggressive investors: 10-15% of crypto portfolio
- Professional investors: Up to 20% of crypto portfolio with active management
(2) Risk Hedging Solutions
- Portfolio diversification: Combine RENDER with other infrastructure tokens to reduce single-asset concentration risk
- Position sizing: Gradually build positions rather than investing lump sums to average entry prices
(3) Secure Storage Solutions
- Hot wallet recommendation: Gate Web3 Wallet for active trading and easy access
- Cold storage solution: Hardware wallets for long-term holdings exceeding $10,000
- Security precautions: Never share private keys, enable two-factor authentication, and regularly verify wallet addresses before transactions
V. RENDER Potential Risks and Challenges
RENDER Market Risks
- High volatility: RENDER has experienced significant price fluctuations, with a historical high of $13.60 and low of $0.037, demonstrating extreme price swings
- Limited liquidity: With a 24-hour trading volume of $5.07M, large orders may impact price significantly
- Market sentiment dependency: As a specialized infrastructure token, RENDER's price may be influenced by broader crypto market trends
RENDER Regulatory Risks
- Blockchain regulation uncertainty: Changes in cryptocurrency regulations across different jurisdictions may affect RENDER's accessibility and trading
- Token classification concerns: Regulatory authorities may scrutinize utility tokens, potentially affecting RENDER's operational framework
- Cross-border compliance: As a decentralized network operating globally, RENDER may face varying regulatory requirements in different regions
RENDER Technical Risks
- Network dependency: RENDER operates on the Solana blockchain, making it subject to any technical issues or network disruptions on Solana
- Competition risk: Other decentralized GPU computing projects may emerge, potentially reducing RENDER's market share
- Technology evolution: Rapid changes in rendering technology or GPU computing standards may require network adaptations
VI. Conclusion and Action Recommendations
RENDER Investment Value Assessment
RENDER Network represents an innovative approach to decentralized GPU computing, addressing growing demand for 3D rendering and computational services. The project's strong 30-day performance (60.89% gain) demonstrates renewed market interest, though the 65.92% decline over the past year reflects broader market challenges and volatility. With a market capitalization of $1.23B and ranking at position 75, RENDER maintains a significant presence in the infrastructure sector. The high circulating supply ratio (97.45%) suggests minimal future dilution concerns. However, investors should remain cautious given the inherent volatility and competition in the decentralized computing space.
RENDER Investment Recommendations
✅ Beginners: Start with a small allocation (1-3% of crypto portfolio), focus on learning about the project fundamentals, and consider using Gate Web3 Wallet for secure storage
✅ Experienced investors: Consider accumulating positions during market dips, implement technical analysis strategies, and maintain risk management disciplines with stop-loss orders
✅ Institutional investors: Evaluate RENDER as part of a diversified infrastructure token portfolio, conduct thorough due diligence on network metrics, and consider staged entry strategies
RENDER Trading Participation Methods
- Spot trading: Purchase RENDER tokens directly on Gate.com with immediate ownership
- Dollar-cost averaging: Systematically invest fixed amounts at regular intervals to reduce timing risk
- Portfolio rebalancing: Periodically adjust RENDER allocation based on performance and risk tolerance
Cryptocurrency investment carries extremely high risk, and this article does not constitute investment advice. Investors should make cautious decisions based on their own risk tolerance and are advised to consult professional financial advisors. Never invest more than you can afford to lose.
FAQ
What is RENDER token and what are its main uses?
RENDER token powers decentralized rendering services. It's used to pay for GPU rendering services, reward network participants providing computing power, and facilitate transactions on the Render Network ecosystem.
What are the main factors affecting RENDER price?
RENDER price is influenced by user activity, exchange liquidity, ecosystem events such as burns and upgrades, whale transfers, and social media sentiment.
RENDER reached its all-time high on March 17, 2024. Recently, the price increased 32% from US$1.93 to US$2.54 over the past week, demonstrating strong upward momentum and growing market interest in the Render Network ecosystem.
What is the RENDER price prediction for 2024-2025?
RENDER price is predicted between $7.461 to $10.852 in 2024, with potential to reach $20 in the near term. 2025 predictions suggest continued upward momentum, though specific price targets remain uncertain pending market developments.
What are the risks of investing in RENDER tokens?
RENDER token investments face market volatility, technology risks, and regulatory uncertainty. Crypto assets are highly dynamic with potential significant value fluctuations. Investors should carefully assess personal risk tolerance before investing.
What is the difference between RENDER and other rendering network tokens such as GPU?
RENDER specializes in GPU rendering for 3D animation and video editing tasks, while other networks like Flux focus on general-purpose cloud computing. RENDER's dedicated infrastructure optimizes performance for creative rendering workloads.
* The information is not intended to be and does not constitute financial advice or any other recommendation of any sort offered or endorsed by Gate.