This comprehensive analysis examines Request (REQ) token's investment potential through expert market forecasting for 2026-2031. REQ, a decentralized payment platform on Ethereum with an $80.06 million market cap, addresses enterprise invoicing and payment standardization needs. The article reviews REQ's historical price evolution from its 2018 all-time high of $1.059 to current levels around $0.1076, analyzing key performance metrics and neutral market sentiment. Core value drivers include ecosystem adoption, macroeconomic conditions, and institutional participation. Price predictions range from $0.09335-$0.14807 in 2026, with potential 97-120% cumulative growth by 2031. Professional investment strategies cover long-term holding and active trading approaches, complemented by risk management frameworks addressing liquidity constraints and regulatory uncertainties. The analysis equips investors with actionable insights for spot trading on Gate platform while emphasizing disciplined portfolio allocation and sec
Introduction: REQ's Market Position and Investment Value
Request (REQ), as a decentralized payment and financial audit platform built on the Ethereum network, has been facilitating secure payment requests and transaction processing since its launch in 2017. As of 2026, Request maintains a market capitalization of approximately $80.06 million, with a circulating supply of around 744.29 million tokens, and the price hovering around $0.1076. This asset, recognized as an "enterprise-level blockchain payment solution," is playing an increasingly significant role in invoice management, accounting, auditing, and payment standardization.
This article will comprehensively analyze REQ's price trajectory from 2026 to 2031, combining historical patterns, market supply and demand dynamics, ecosystem development, and macroeconomic conditions to provide investors with professional price forecasts and practical investment strategies.
I. REQ Price History Review and Market Status
REQ Historical Price Evolution Trajectory
- 2018: REQ reached its all-time high of $1.059 on January 6, 2018, reflecting strong market enthusiasm during the crypto bull market period
- 2020: The token experienced significant downward pressure, dropping to its all-time low of $0.00454707 on March 13, 2020, amid broader market turbulence
- 2017-2026: Since its initial launch at $0.066 in October 2017, REQ has experienced substantial price fluctuations across multiple market cycles
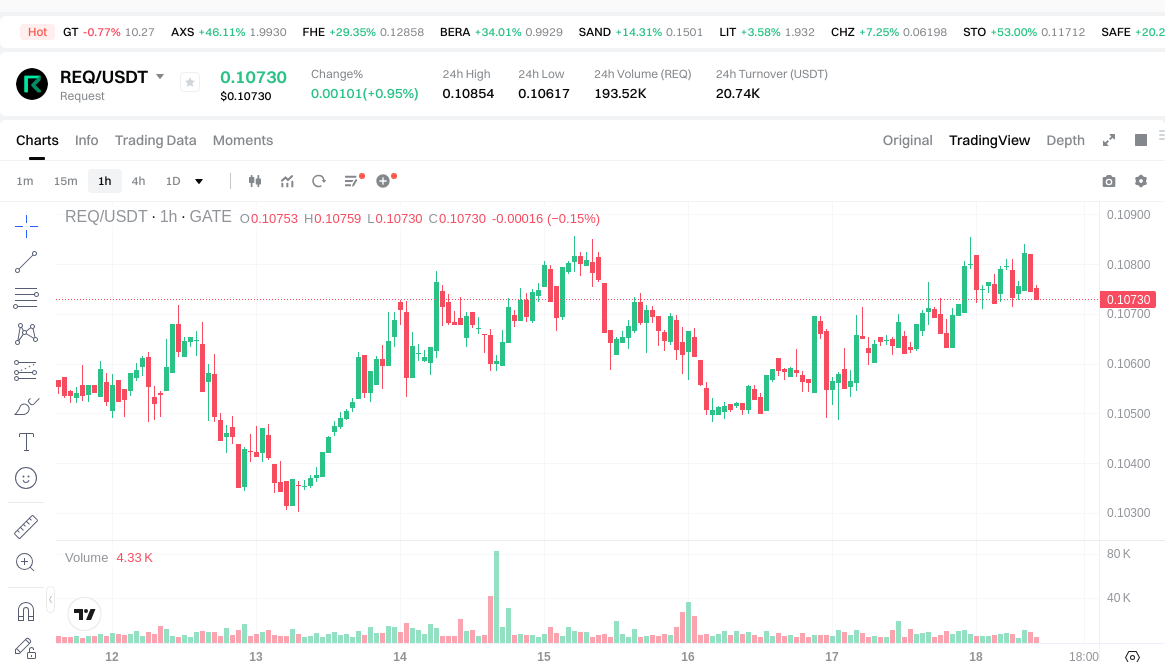
REQ Current Market Status
As of January 18, 2026, REQ is trading at $0.10757, representing a 63.06% increase from its launch price. The token demonstrates moderate volatility with a 24-hour trading range between $0.10617 and $0.10854.
Recent price performance shows mixed signals across different timeframes. The token posted a 1.18% gain over the past 24 hours and a 1.89% increase over the past week, indicating short-term positive momentum. The 30-day performance reveals a 5.35% appreciation, suggesting sustained buying interest. However, the annual perspective shows a 14.71% decline, reflecting broader market headwinds or project-specific challenges.
REQ currently holds the 419th position by market capitalization, with a circulating market cap of approximately $80.06 million. The 24-hour trading volume stands at $20,663.01, indicating moderate liquidity levels. With 744.29 million tokens in circulation out of a maximum supply of 1 billion, the circulating supply represents 74.43% of the total, suggesting a relatively mature token distribution.
The fully diluted market cap sits at $107.51 million, with the market cap to FDV ratio at 74.43%, indicating limited additional supply pressure. The token maintains a market dominance of 0.0031%, positioning it as a mid-tier asset within the cryptocurrency ecosystem. REQ is currently listed on 15 exchanges and is held by 41,318 addresses, demonstrating a distributed holder base.
The market emotion index registers at 49, indicating a neutral sentiment environment. Current price levels remain approximately 89.84% below the all-time high and 2,266% above the all-time low.
Click to view current REQ market price
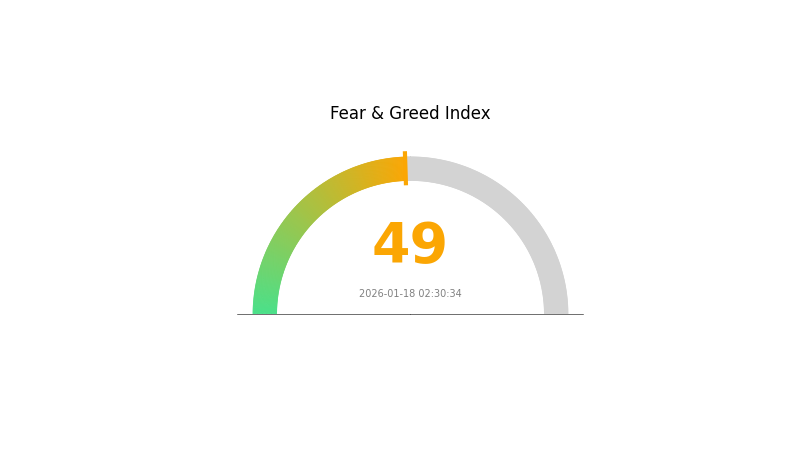
REQ Market Sentiment Index
2026-01-18 Fear and Greed Index: 49 (Neutral)
Click to view current Fear & Greed Index
The cryptocurrency market is currently operating in neutral territory with a Fear and Greed Index reading of 49. This balanced sentiment indicates that market participants are neither excessively fearful nor overly greedy, reflecting a state of equilibrium in investor psychology. Such neutral conditions often present opportunities for measured decision-making, as volatility tends to be moderate and price movements are driven by fundamental factors rather than extreme emotional swings. Traders and investors should remain cautious yet open to potential market opportunities during this stable period.
REQ Token Holder Distribution
The token holder distribution chart illustrates the concentration of REQ tokens across different wallet addresses, providing insights into the decentralization level and potential market manipulation risks. By analyzing the top holders and their respective ownership percentages, investors can assess whether token supply is democratically distributed or concentrated among a few major participants.
According to the current on-chain data, the largest REQ address holds 184,825.67K tokens, representing 18.49% of the total supply. The top five addresses collectively control 33.53% of REQ tokens, with the remaining 65.47% distributed among numerous smaller holders. This distribution pattern indicates a moderate concentration level - while the largest holder possesses a significant portion, no single entity controls an overwhelming majority of the supply. The second and third largest holders account for 6.70% and 4.40% respectively, showing a gradual decrease in concentration that suggests a relatively healthy distribution structure.
From a market structure perspective, this concentration level presents both advantages and risks. The moderate decentralization reduces the likelihood of single-entity manipulation compared to projects where top holders control 50% or more of supply. However, the top holder's 18.49% stake remains substantial enough to potentially influence price movements through large-scale transactions. The 65.47% held by smaller addresses indicates broader community participation and distribution, which typically contributes to price stability and organic growth potential. Overall, REQ's current holder distribution reflects a balanced tokenomics structure that supports both liquidity and decentralization, though investors should remain aware of potential volatility risks associated with movements from major holders.
Click to view current REQ Token Holder Distribution
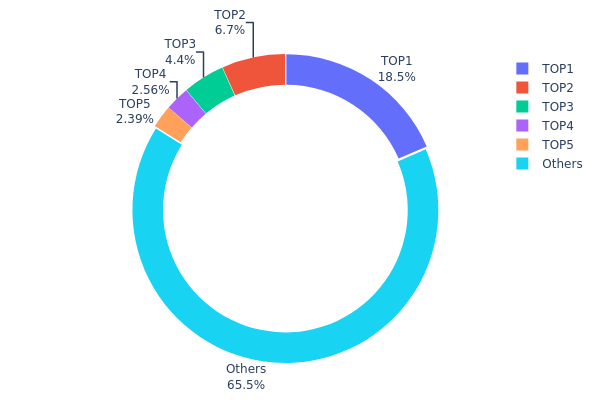
| Top |
Address |
Holding Qty |
Holding (%) |
| 1 |
0x0632...30962e |
184825.67K |
18.49% |
| 2 |
0xf977...41acec |
67000.00K |
6.70% |
| 3 |
0xda5d...71ee25 |
44000.00K |
4.40% |
| 4 |
0x4a60...aab931 |
25542.88K |
2.55% |
| 5 |
0xbfb2...35d38d |
23888.89K |
2.39% |
| - |
Others |
654159.30K |
65.47% |
II. Core Factors Influencing REQ's Future Price
Supply Mechanism
- Market Supply and Demand: REQ's price is directly influenced by the relationship between token supply and market demand. The balance between available token circulation and user acquisition drives short-term price movements, while ecosystem development and adoption trends shape long-term value trajectories.
- Current Impact: Token supply dynamics and evolving market demand continue to be primary determinants of REQ's price direction. As the Request Network ecosystem expands its payment protocol capabilities, demand patterns may shift based on real-world adoption metrics.
Institutional and Major Holder Dynamics
- Institutional Adoption: The level of institutional investment and mainstream adoption represents a critical factor for REQ's valuation. Increased participation from institutional players could provide price stability and upward momentum.
- Enterprise Integration: The adoption rate of Request's blockchain payment protocol by businesses and enterprises directly impacts utility demand for REQ tokens, potentially creating sustained buying pressure.
Macroeconomic Environment
- Monetary Policy Impact: Global monetary policy decisions, particularly from major central banks, influence risk asset appetite and capital flows into cryptocurrency markets. Interest rate adjustments and liquidity conditions affect investor allocation to digital assets including REQ.
- Economic Uncertainty: Broader economic conditions, including inflation trends and financial stability concerns, can drive investors toward or away from cryptocurrency holdings, impacting REQ's market performance.
Technical Development and Ecosystem Construction
- Technology and Platform Progress: Advancements in Request Network's underlying technology, protocol upgrades, and platform enhancements contribute to fundamental value appreciation. Technical improvements that increase transaction efficiency, reduce costs, or expand functionality can attract more users and developers.
- Ecosystem Growth: The development of applications, integrations, and use cases built on the Request Network creates network effects that enhance REQ's utility value. Expanding partnerships and real-world payment implementations strengthen the ecosystem's competitive position.
III. 2026-2031 REQ Price Prediction
2026 Outlook
- Conservative estimate: $0.09335 - $0.1073
- Neutral estimate: $0.1073
- Optimistic estimate: $0.14807 (requires favorable market conditions and increased adoption)
2027-2029 Outlook
- Market stage expectation: REQ may enter a gradual growth phase, with price volatility potentially influenced by broader crypto market trends and project development progress
- Price range predictions:
- 2027: $0.0664 - $0.18132, representing an estimated 18% increase from 2026 levels
- 2028: $0.11742 - $0.19931, with a potential 43% growth trajectory
- 2029: $0.10968 - $0.24767, showing possible 64% appreciation
- Key catalysts: Technology upgrades, ecosystem expansion, strategic partnerships, and overall cryptocurrency market momentum could serve as primary drivers
2030-2031 Long-term Outlook
- Baseline scenario: $0.11676 - $0.26111 (assuming steady project development and stable market conditions)
- Optimistic scenario: $0.21228 average price in 2030, potentially reaching $0.2367 in 2031 (contingent on widespread adoption and enhanced utility)
- Transformative scenario: $0.29587 (under conditions of significant technological breakthroughs, major institutional partnerships, or exceptional market expansion)
- 2026-01-18: REQ price predictions suggest a multi-year growth trajectory with estimated cumulative increases ranging from 97% to 120% by 2030-2031
| Year |
Predicted High Price |
Predicted Average Price |
Predicted Low Price |
Price Change |
| 2026 |
0.14807 |
0.1073 |
0.09335 |
0 |
| 2027 |
0.18132 |
0.12769 |
0.0664 |
18 |
| 2028 |
0.19931 |
0.1545 |
0.11742 |
43 |
| 2029 |
0.24767 |
0.1769 |
0.10968 |
64 |
| 2030 |
0.26111 |
0.21228 |
0.11676 |
97 |
| 2031 |
0.29587 |
0.2367 |
0.17516 |
120 |
IV. REQ Professional Investment Strategy and Risk Management
REQ Investment Methodology
(1) Long-term Holding Strategy
- Suitable for: Investors seeking exposure to decentralized payment infrastructure with a medium to long-term horizon
- Operational Recommendations:
- Consider accumulating positions during market corrections when REQ trades below its 30-day moving average
- Monitor the project's adoption metrics and partnership announcements as indicators of fundamental value
- Storage Solution: Utilize Gate Web3 Wallet for secure custody with support for Ethereum-based tokens, ensuring private key control and multi-signature options for larger holdings
(2) Active Trading Strategy
- Technical Analysis Tools:
- Moving Averages: Observe the 7-day and 30-day simple moving averages; REQ's recent 1.89% weekly gain suggests short-term upward momentum
- Volume Analysis: Monitor the 24-hour trading volume of approximately 20,663 USD to identify potential breakout or reversal signals
- Swing Trading Considerations:
- Identify entry points near the 24-hour low range around 0.10617 USD and consider profit-taking near resistance levels around 0.10854 USD
- Set stop-loss orders to manage downside risk, particularly given the token's 14.71% decline over the past year
REQ Risk Management Framework
(1) Asset Allocation Principles
- Conservative Investors: Allocate no more than 1-2% of cryptocurrency portfolio to REQ, balancing with established assets
- Aggressive Investors: May consider 3-5% allocation, accepting higher volatility for potential growth exposure
- Professional Investors: Position sizing based on portfolio strategy and risk tolerance, with regular rebalancing based on market conditions
(2) Risk Hedging Solutions
- Diversification: Combine REQ holdings with other payment-focused tokens and established cryptocurrencies to reduce concentration risk
- Position Sizing: Limit individual trade exposure to avoid overconcentration, especially given REQ's market cap of approximately 80 million USD
(3) Secure Storage Solutions
- Hot Wallet Option: Gate Web3 Wallet provides convenient access for active traders while maintaining security through encryption and backup features
- Cold Storage Approach: For long-term holdings, consider transferring tokens to hardware wallet solutions after accumulation, ensuring private key management best practices
- Security Precautions: Enable two-factor authentication, verify contract addresses (0x8f8221aFbB33998d8584A2B05749bA73c37a938a on Ethereum), and avoid sharing private keys or seed phrases
V. REQ Potential Risks and Challenges
REQ Market Risks
- Liquidity Constraints: With a 24-hour trading volume of approximately 20,663 USD, REQ may experience higher slippage during large transactions
- Price Volatility: The token has experienced a 14.71% decline over the past year, indicating significant price fluctuation potential
- Market Share Sensitivity: Holding only 0.0031% of total cryptocurrency market capitalization, REQ remains vulnerable to broader market sentiment shifts
REQ Regulatory Risks
- Payment Service Compliance: As a decentralized payment request network, REQ may face evolving regulatory frameworks governing digital payment services across jurisdictions
- Token Classification: Regulatory authorities may reassess the classification of utility tokens like REQ, potentially impacting trading availability
- Cross-border Transaction Scrutiny: Increased attention to cryptocurrency-based payment systems could introduce compliance requirements affecting network operations
REQ Technical Risks
- Smart Contract Dependencies: Operating on the Ethereum network exposes REQ to potential vulnerabilities in its smart contract infrastructure
- Network Congestion: Ethereum network scalability issues could impact transaction processing times and costs for Request Network users
- Competition from Layer 2 Solutions: Emerging payment infrastructure projects may challenge REQ's market position and adoption trajectory
VI. Conclusion and Action Recommendations
REQ Investment Value Assessment
Request (REQ) presents a specialized investment opportunity within the decentralized payment infrastructure sector. With a market capitalization of approximately 80 million USD and a circulating supply representing 74.43% of total supply, the token maintains a relatively established presence among payment-focused cryptocurrencies. The recent short-term performance shows modest positive momentum with a 1.89% weekly gain and 5.35% monthly increase, though the 14.71% annual decline reflects broader market challenges. The project's focus on creating financial platforms for invoicing, accounting, and auditing on the Ethereum network addresses real-world business needs, providing long-term value proposition. However, investors should carefully weigh the limited liquidity, competitive landscape, and regulatory uncertainties against the potential for adoption growth in decentralized payment systems.
REQ Investment Recommendations
✅ Beginners: Start with minimal exposure (no more than 1% of cryptocurrency portfolio) to understand REQ's price behavior and ecosystem dynamics. Use Gate.com's spot trading platform to execute small test transactions before committing larger capital.
✅ Experienced Investors: Consider REQ as a satellite position within a diversified cryptocurrency portfolio, particularly if seeking exposure to payment infrastructure themes. Monitor adoption metrics and partnership announcements while maintaining disciplined risk management through position sizing and stop-loss orders.
✅ Institutional Investors: Evaluate REQ within the context of thematic exposure to decentralized finance and payment solutions. Conduct thorough due diligence on smart contract security, team credentials, and competitive positioning before establishing positions commensurate with institutional risk frameworks.
REQ Trading Participation Methods
- Spot Trading: Execute buy and sell orders directly on Gate.com's spot market, taking advantage of competitive fee structures and deep order books
- Dollar-Cost Averaging: Establish recurring purchase schedules to accumulate REQ holdings gradually, reducing the impact of short-term price volatility
- Portfolio Integration: Incorporate REQ alongside complementary assets within a broader cryptocurrency allocation strategy, rebalancing periodically based on market conditions
Cryptocurrency investment carries extremely high risk, and this article does not constitute investment advice. Investors should make prudent decisions based on their own risk tolerance and are advised to consult professional financial advisors. Never invest more than you can afford to lose.
FAQ
What is REQ token and what is its use?
REQ is the native token of Request Network built on Ethereum. It incentivizes developers, enables community governance voting, and facilitates currency exchange within the ecosystem. REQ powers the decentralized payment protocol.
What is the historical price trend of REQ? What are the main factors affecting its price?
REQ has shown volatility influenced by market demand, protocol adoption, and broader crypto sentiment. Key factors include ecosystem development, trading volume, and DeFi market conditions. Price prediction for 2027 suggests potential movement to $0.12635 based on current market trends and trading behavior.
2024年REQ价格预测会如何?
REQ在2024年初徘徊在0.1美元左右,中期跌至0.08美元低点。基于市场动向和生态发展,预计全年将在0.08-0.12美元区间波动,下半年或有向上突破机会。
What is the difference between REQ and other payment tokens like USDC and USDT?
REQ is a utility token for decentralized payment protocols and network rewards, while USDC and USDT are stablecoins designed to maintain fixed value. REQ offers dynamic utility and growth potential, whereas stablecoins prioritize price stability.
What are the development prospects and latest progress of Request Network?
Request Network focuses on market expansion and enterprise adoption with clear technical roadmap. Recent progress includes strong backing from ING Bank and Y Combinator. Future growth depends on widespread market penetration and enterprise-level adoption in invoice and payment solutions.
What are the risks to pay attention to when investing in REQ tokens?
REQ token risks include project delivery failures and competition, which may cause price declines. Low adoption rates and decreased community interest can significantly impact token value and returns.
From technical and fundamental analysis, how to evaluate REQ's future growth potential?
REQ demonstrates strong growth potential through its robust payment protocol infrastructure and expanding DeFi adoption. Technical indicators show positive momentum, while fundamental metrics reveal increasing transaction volume and developer engagement, supporting long-term value appreciation prospects.
* The information is not intended to be and does not constitute financial advice or any other recommendation of any sort offered or endorsed by Gate.