This comprehensive analysis examines The Sandbox (SAND) token's price trajectory from 2026 to 2031, providing professional forecasts for investors navigating the metaverse gaming sector. Trading at $0.1239 with a $330.48M market cap, SAND offers both opportunities and challenges within the blockchain gaming ecosystem. The article analyzes historical price patterns, ecosystem development metrics, supply mechanics, and macroeconomic influences to deliver tiered price predictions ranging from conservative to optimistic scenarios. Readers will discover detailed investment methodologies including dollar-cost averaging and technical analysis strategies, comprehensive risk management frameworks for different investor profiles, and actionable trading guidance. Specifically designed for beginners, experienced investors, and institutional participants, this guide provides practical security recommendations, regulatory insights, and performance benchmarks for informed decision-making on Gate exchange and other trading p
Introduction: SAND's Market Position and Investment Value
Sandbox (SAND), positioned as a decentralized virtual gaming metaverse platform, has been building its ecosystem since its launch in 2020. As of January 2026, SAND maintains a market capitalization of approximately $330.48 million with a circulating supply of around 2.67 billion tokens, trading at $0.1239. This asset, recognized as a pioneering player in the blockchain gaming and metaverse space, is playing an increasingly important role in the convergence of digital ownership, gaming experiences, and virtual real estate.
This article will comprehensively analyze SAND's price trajectory from 2026 to 2031, combining historical patterns, market supply-demand dynamics, ecosystem development, and macroeconomic conditions to provide investors with professional price forecasts and practical investment strategies.
I. SAND Price History Review and Current Market Status
SAND Historical Price Evolution Trajectory
- 2020: SAND reached its all-time low at $0.0290 on November 4, marking the early stage of the project's market presence
- 2021: The token experienced significant growth momentum, achieving its all-time high of $8.40 on November 25, representing a substantial price appreciation during the NFT and metaverse market boom
- 2022-2025: Following the broader market correction, SAND underwent a prolonged adjustment period, with the token experiencing considerable volatility as the market cycled through different phases
SAND Current Market Status
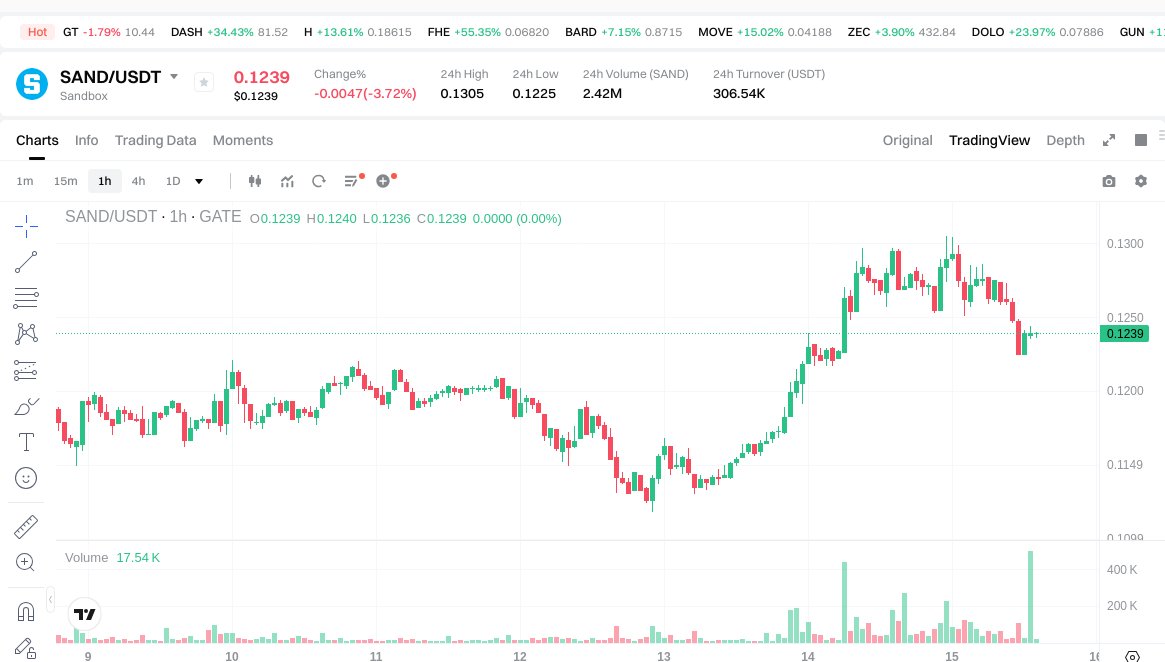
As of January 15, 2026, SAND is trading at $0.1239, reflecting a 3.5% decline over the past 24 hours. The token has demonstrated mixed short-term performance, with a 0.24% increase in the past hour and a 2.4% gain over the past 7 days. On a monthly basis, SAND has posted a 4.38% increase, though the annual performance shows a 78.47% decline from the previous year.
The current trading range for SAND spans between $0.1225 (24-hour low) and $0.1305 (24-hour high), with the 24-hour trading volume reaching $307,303. The token maintains a market capitalization of approximately $330.48 million, with a circulating supply of 2.67 billion SAND tokens, representing 88.91% of the maximum supply of 3 billion tokens.
SAND's fully diluted market cap stands at $371.7 million, with the market cap to FDV ratio at 88.91%, indicating a relatively high proportion of tokens already in circulation. The token holds the 180th position in market ranking and commands a 0.010% market share within the cryptocurrency space. Currently, SAND is available for trading on 64 exchanges and has attracted approximately 207,482 holders.
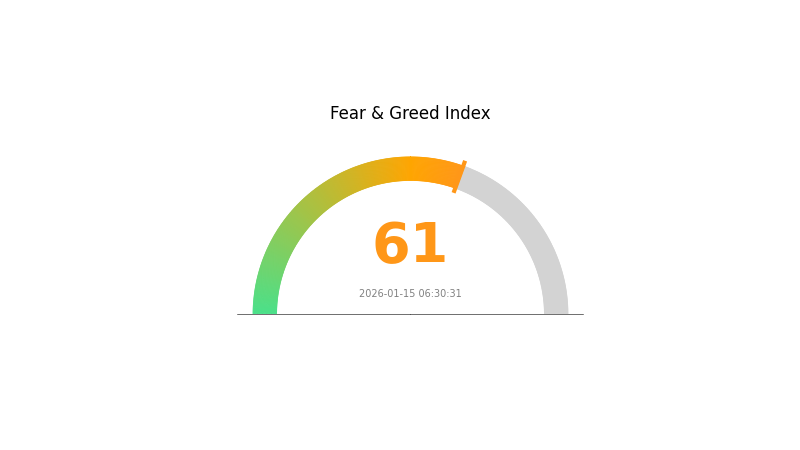
The Fear and Greed Index currently registers at 61, indicating a "Greed" sentiment in the broader market, which may influence SAND's near-term price movements.
Click to view current SAND market price
SAND Market Sentiment Indicator
2026-01-15 Fear and Greed Index: 61 (Greed)
Click to view the current Fear & Greed Index
The cryptocurrency market is currently displaying strong bullish sentiment, with the Fear and Greed Index reaching 61, indicating a "Greed" state. This elevated reading suggests investors are becoming increasingly optimistic and risk-taking behavior is intensifying across the market. During such periods, trading volumes typically surge and price movements become more volatile. Traders should remain vigilant and consider taking profits strategically while maintaining prudent risk management practices to navigate potential market corrections.
SAND Holdings Distribution
The holdings distribution chart illustrates the concentration of token ownership across different wallet addresses, providing insights into the decentralization level and potential market manipulation risks. By analyzing the proportion of tokens held by top addresses versus smaller holders, investors can assess the structural stability of the asset's on-chain ecosystem.
According to current data, SAND exhibits a highly concentrated holdings structure. The top address controls 932,056.01K tokens, accounting for 31.06% of the total supply, while the second-largest holder possesses 10.14%. The top five addresses collectively hold 55.48% of the circulating supply, with the remaining 44.52% distributed among other addresses. This concentration pattern indicates that a relatively small number of entities maintain significant control over SAND's market liquidity.
Such concentrated holdings present notable implications for market dynamics. The dominance of major holders could lead to increased price volatility, as large-scale sell-offs or strategic accumulation by these addresses may trigger substantial price movements. Additionally, this concentration raises concerns about potential market manipulation risks, where coordinated actions by top holders could artificially influence price discovery mechanisms. From a decentralization perspective, while the distribution is not extremely concentrated compared to some emerging tokens, the current structure suggests limited dispersion of governance power and economic influence within the SAND ecosystem.
Click to view current SAND Holdings Distribution

| Top |
Address |
Holding Qty |
Holding (%) |
| 1 |
0xca97...48c00c |
932056.01K |
31.06% |
| 2 |
0x40ec...5bbbdf |
304421.91K |
10.14% |
| 3 |
0x5026...e8f705 |
159967.09K |
5.33% |
| 4 |
0x5f5b...fa2a67 |
142501.07K |
4.75% |
| 5 |
0x2f24...e72a35 |
126019.67K |
4.20% |
| - |
Others |
1335034.25K |
44.52% |
II. Core Factors Influencing SAND's Future Price
Supply Mechanism
- Fixed Total Supply: SAND has a maximum supply of 3 billion tokens, with circulation gradually increasing through planned releases. This fixed supply model creates potential scarcity value as demand grows.
- Historical Patterns: Past token unlock events have typically created temporary selling pressure, though prices have generally recovered during broader market uptrends. The controlled release schedule has helped maintain relative price stability compared to projects with sudden large unlocks.
- Current Impact: As The Sandbox platform continues developing and more tokens enter circulation through ecosystem rewards, the balance between new supply and growing user demand will be crucial. The controlled inflation rate is designed to support long-term ecosystem growth rather than create immediate price pressure.
Institutional and Large Holder Dynamics
- Institutional Holdings: Major holders include the project treasury and strategic investors, with whale concentration remaining significant. On-chain data from late 2024 showed declining sell pressure as tokens moved from exchanges to cold storage, indicating accumulation behavior.
- Enterprise Adoption: The Sandbox has partnered with various brands and entertainment companies to create virtual experiences, though specific major enterprise treasury holdings are not widely publicized.
- Regulatory Environment: While no specific national policies target SAND directly, broader cryptocurrency regulations in major markets continue to evolve, potentially affecting accessibility and adoption rates.
Macroeconomic Environment
- Monetary Policy Impact: Traditional risk asset dynamics influence SAND, with tighter monetary policy from major central banks historically suppressing speculative crypto investments. Future rate decisions will likely affect capital flows into GameFi and metaverse tokens.
- Inflation Hedge Characteristics: Unlike Bitcoin, SAND functions primarily as a utility token rather than a store of value, making its inflation hedge properties less direct. However, metaverse assets may benefit from growing interest in digital property during economic uncertainty.
- Geopolitical Factors: Recent market analysis noted geopolitical tensions contributing to broader crypto market volatility, with SAND experiencing similar sensitivity to global risk sentiment.
Technical Development and Ecosystem Building
- Platform Development Progress: The evolution of The Sandbox platform itself directly impacts SAND's utility and demand. Ongoing development of user-friendly creation tools, improved virtual experiences, and expanded land functionality supports long-term value.
- GameFi Integration: As a leading GameFi project, The Sandbox benefits from the convergence of blockchain gaming and decentralized finance. The platform's ability to attract active users and creators remains fundamental to token demand.
- Ecosystem Applications: The platform hosts numerous user-generated experiences, virtual land parcels, and NFT marketplaces that create real utility for SAND tokens. Growth in active users, land sales, and in-game transactions directly correlates with token demand and circulation velocity.
III. 2026-2031 SAND Price Forecast
2026 Outlook
- Conservative Forecast: $0.06938 - $0.1239
- Neutral Forecast: $0.1239
- Optimistic Forecast: $0.18089 (requires favorable market conditions and ecosystem expansion)
2027-2029 Mid-Term Outlook
- Market Stage Expectation: Potential recovery phase with gradual accumulation, anticipating broader adoption of metaverse platforms and enhanced user engagement within The Sandbox ecosystem
- Price Range Forecast:
- 2027: $0.08229 - $0.19659
- 2028: $0.12215 - $0.17973
- 2029: $0.12752 - $0.19837
- Key Catalysts: Growth in virtual land transactions, partnerships with major brands, integration of new gaming features, and overall recovery in the cryptocurrency market sentiment
2030-2031 Long-Term Outlook
- Baseline Scenario: $0.11264 - $0.22341 (assuming steady ecosystem development and moderate market conditions)
- Optimistic Scenario: $0.18774 - $0.26108 (contingent on significant metaverse adoption, increased platform utility, and positive regulatory environment)
- Transformative Scenario: Potentially exceeding $0.26108 (under conditions of mass mainstream adoption, major institutional partnerships, and breakthrough technological advancements in virtual reality)
- 2026-01-15: SAND exhibits a foundation price range with expected volatility as the market evaluates metaverse sector fundamentals
| Year |
Predicted High Price |
Predicted Average Price |
Predicted Low Price |
Price Change |
| 2026 |
0.18089 |
0.1239 |
0.06938 |
0 |
| 2027 |
0.19659 |
0.1524 |
0.08229 |
23 |
| 2028 |
0.17973 |
0.17449 |
0.12215 |
40 |
| 2029 |
0.19837 |
0.17711 |
0.12752 |
42 |
| 2030 |
0.22341 |
0.18774 |
0.11264 |
51 |
| 2031 |
0.26108 |
0.20557 |
0.13568 |
65 |
IV. SAND Professional Investment Strategy and Risk Management
SAND Investment Methodology
(1) Long-term Holding Strategy
- Suitable for: Investors who believe in the metaverse gaming sector's long-term growth potential and are willing to hold through market volatility
- Operational Recommendations:
- Consider accumulating SAND during market corrections when prices approach key support levels
- Monitor The Sandbox platform's user growth, partnership announcements, and virtual land sales activity as fundamental indicators
- Implement a dollar-cost averaging approach to build positions gradually over 6-12 months
- Storage Solution: Use Gate Web3 Wallet for secure self-custody with multi-chain support, enabling easy management of SAND tokens across Ethereum and Base networks
(2) Active Trading Strategy
- Technical Analysis Tools:
- Moving Averages: Monitor the 50-day and 200-day moving averages to identify trend direction and potential crossover signals
- RSI (Relative Strength Index): Use RSI levels to identify overbought conditions above 70 and oversold conditions below 30 for entry/exit timing
- Swing Trading Key Points:
- Pay attention to SAND's correlation with broader metaverse tokens and gaming sector sentiment shifts
- Set stop-loss orders 8-12% below entry points to manage downside risk on active positions
SAND Risk Management Framework
(1) Asset Allocation Principles
- Conservative Investors: 2-5% of crypto portfolio allocation
- Aggressive Investors: 8-15% of crypto portfolio allocation
- Professional Investors: 15-25% of crypto portfolio allocation with active hedging strategies
(2) Risk Hedging Solutions
- Portfolio Diversification: Combine SAND with other metaverse tokens and established cryptocurrencies to reduce concentration risk
- Position Sizing: Never allocate more than you can afford to lose in a single asset, considering SAND's historical volatility patterns
(3) Secure Storage Solutions
- Hot Wallet Recommendation: Gate Web3 Wallet offers convenient access for active traders with multi-chain support for ETH and Base network SAND holdings
- Cold Storage Solution: For long-term holdings exceeding $10,000, consider hardware wallet solutions with offline private key storage
- Security Precautions: Enable two-factor authentication, verify contract addresses before transactions, and never share private keys or seed phrases
V. SAND Potential Risks and Challenges
SAND Market Risks
- High Volatility: SAND has experienced a 78.47% decline over the past year, demonstrating significant price volatility that may result in substantial losses
- Metaverse Sector Correlation: SAND's price is highly correlated with overall metaverse and gaming token sentiment, making it vulnerable to sector-wide downturns
- Liquidity Concerns: During market stress, trading volumes may decrease significantly, potentially making it difficult to exit positions at desired price levels
SAND Regulatory Risks
- Gaming and Virtual Asset Regulations: Evolving regulations around virtual land ownership, NFTs, and gaming tokens could impact The Sandbox platform's operations
- Cross-border Compliance: As a global platform, The Sandbox must navigate multiple jurisdictions' regulatory frameworks, which may introduce operational constraints
- Securities Classification: Potential reclassification of SAND as a security in certain jurisdictions could restrict trading access and platform functionality
SAND Technical Risks
- Smart Contract Vulnerabilities: Despite audits, smart contracts on Ethereum and Base chains may contain undiscovered vulnerabilities that could be exploited
- Network Congestion: During high-activity periods, Ethereum network congestion may lead to elevated transaction fees, impacting user experience
- Platform Development Risks: The Sandbox's continued success depends on successful technical execution, user adoption, and competition from other metaverse platforms
VI. Conclusion and Action Recommendations
SAND Investment Value Assessment
SAND represents a high-risk, high-potential opportunity within the metaverse gaming sector. With a market cap of approximately $330 million and 88.91% of total supply in circulation, the token shows relatively mature distribution. However, the 78.47% decline over the past year and distance from its all-time high of $8.40 reflect broader challenges in the metaverse sector. The recent 30-day gain of 4.38% suggests emerging stabilization, but investors should approach with caution given historical volatility. Long-term value depends on The Sandbox platform's ability to drive sustained user engagement, expand partnerships, and navigate evolving market conditions.
SAND Investment Recommendations
✅ Beginners: Start with small allocations (1-3% of crypto portfolio) and focus on learning about metaverse ecosystems before increasing exposure. Consider using Gate.com's spot trading to understand price dynamics without leverage.
✅ Experienced Investors: Consider SAND as part of a diversified metaverse portfolio with 5-10% allocation. Implement technical analysis strategies and monitor platform metrics closely for informed decision-making.
✅ Institutional Investors: Evaluate SAND within broader blockchain gaming and metaverse investment themes. Consider OTC desk solutions for large positions and implement comprehensive risk management frameworks.
SAND Trading Participation Methods
- Spot Trading: Purchase SAND directly on Gate.com with multiple fiat and cryptocurrency pairs available for flexible entry points
- Dollar-Cost Averaging: Set up recurring purchases to accumulate SAND over time, reducing the impact of short-term price volatility
- Portfolio Tracking: Use Gate.com's portfolio management tools to monitor SAND positions alongside other holdings and track performance metrics
Cryptocurrency investment carries extremely high risks, and this article does not constitute investment advice. Investors should make cautious decisions based on their own risk tolerance and are advised to consult professional financial advisors. Never invest more than you can afford to lose.
FAQ
What is the historical price trend of SAND tokens? What is the price change over the past year?
SAND has experienced a significant decline over the past year. The token has decreased substantially in value, reflecting market volatility in the crypto sector. Past performance does not guarantee future results, and SAND price movements depend on market dynamics and ecosystem developments.
What is the SAND price prediction for 2024-2025? What are the target prices from major analysis institutions?
SAND price predictions for 2024-2025 range between 0.6317 to 1.4554 USD. Major analysis institutions project target prices around 1.45 USD, based on current trend analysis and market data.
What are the main factors affecting SAND price? How does The Sandbox ecosystem development impact the price?
SAND price is primarily driven by The Sandbox platform user growth, virtual world application expansion, and overall crypto market health. Ecosystem development directly enhances token value and adoption momentum.
SAND demonstrates strong investment potential in the metaverse sector. Compared to MANA and ENJ, SAND benefits from active ecosystem development and substantial trading volume. Its use cases in virtual world interactions provide competitive advantages, positioning it favorably among metaverse tokens for long-term growth prospects.
What does SAND's technical analysis show? Where are the current support and resistance levels?
SAND technical analysis shows support at 9.77 TRY with bullish bounce potential. Resistance sits at 9.89 TRY, acting as a ceiling for further upward movement. These levels are key technical reference points.
What are the main risks of investing in SAND tokens? How should you develop a risk management strategy?
Main risks include market volatility and regulatory changes. Develop a strategy by diversifying investments, setting stop-loss orders, using dollar-cost averaging, and monitoring policy developments. Maintain proper risk-reward ratios and only invest disposable funds.
* The information is not intended to be and does not constitute financial advice or any other recommendation of any sort offered or endorsed by Gate.