This comprehensive analysis examines Status (SNT) token's market position and investment potential through 2031. SNT, trading at $0.01503 with a $59.53 million market cap, serves as a decentralized messaging platform and DApp browser on Ethereum. The article evaluates historical price trends since the 2017 ICO, current market sentiment, and token distribution dynamics. Key sections analyze core price drivers including market sentiment, regulatory environment, technological innovation, and macroeconomic factors. Professional price predictions span 2026-2031, ranging from conservative to optimistic scenarios. Investment strategies accommodate different investor profiles with risk management frameworks and secure storage solutions via Gate. The analysis also addresses regulatory, technical, and market risks while providing actionable recommendations for beginners, experienced, and institutional investors interested in SNT trading on Gate.
Introduction: SNT's Market Position and Investment Value
Status (SNT), positioned as a decentralized messaging platform and mobile browser supporting Ethereum dApps, has been developing its ecosystem since its launch in 2017. As of 2026, SNT maintains a market capitalization of approximately $59.53 million, with a circulating supply of around 3.96 billion tokens, and the price hovering near $0.01503. This asset, known in the industry as the "blockchain WeChat," is playing an increasingly important role in decentralized communication and mobile dApp access.
This article will comprehensively analyze SNT's price trends from 2026 to 2031, combining historical patterns, market supply and demand dynamics, ecosystem development, and macroeconomic conditions to provide investors with professional price forecasts and practical investment strategies.
I. SNT Price History Review and Market Status
SNT Historical Price Evolution Trajectory
- 2017: Status conducted its ICO in June, raising approximately 300,000 ETH at a cost price of 0.0001 ETH per SNT (approximately $0.036559), marking the project's initial market entry.
- 2018: SNT reached its all-time high of $0.684918 on January 3, representing a period of significant market enthusiasm for Ethereum-based messaging and DApp platforms.
- 2020: The token experienced substantial correction, touching its all-time low of $0.00592935 on March 13 during broader cryptocurrency market volatility.
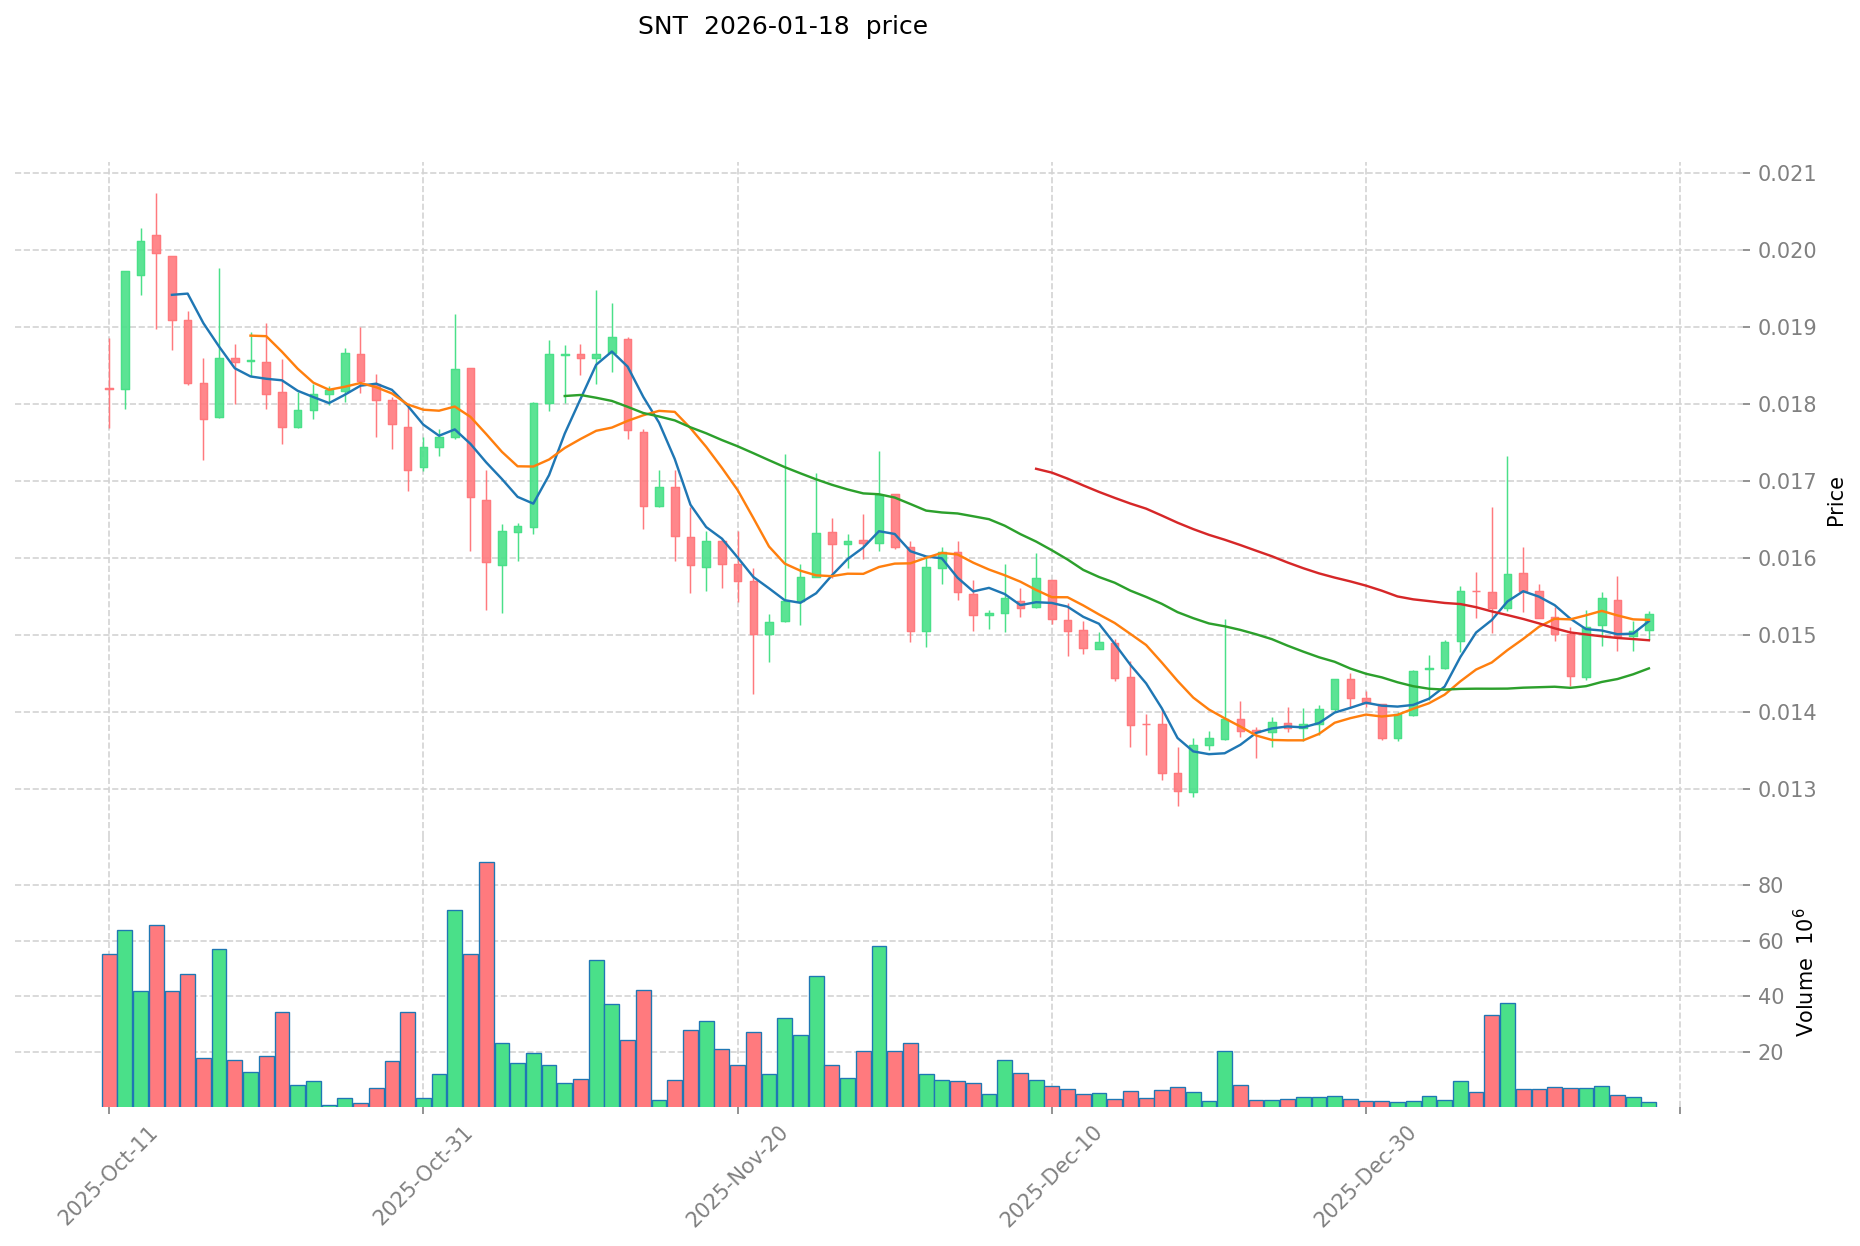
- 2025-2026: SNT demonstrated recovery momentum with a 30-day price increase of 10.6%, though the token remains approximately 69.89% below its level from one year ago.
SNT Current Market Position
As of January 19, 2026, SNT is trading at $0.01503, experiencing slight short-term weakness with a 1.5% decline over the past 24 hours. The token's intraday range spans from $0.01484 to $0.0153. The 24-hour trading volume stands at $30,489, indicating moderate market activity.
SNT maintains a market capitalization of approximately $59.53 million with a circulating supply of 3.96 billion tokens, representing 58.2% of its total supply of 6.80 billion tokens. The token ranks #493 by market capitalization, accounting for 0.0030% of the total cryptocurrency market. With a fully diluted market cap of $102.28 million and the market cap to FDV ratio at 58.2%, there remains potential dilution risk from the remaining uncirculated supply.
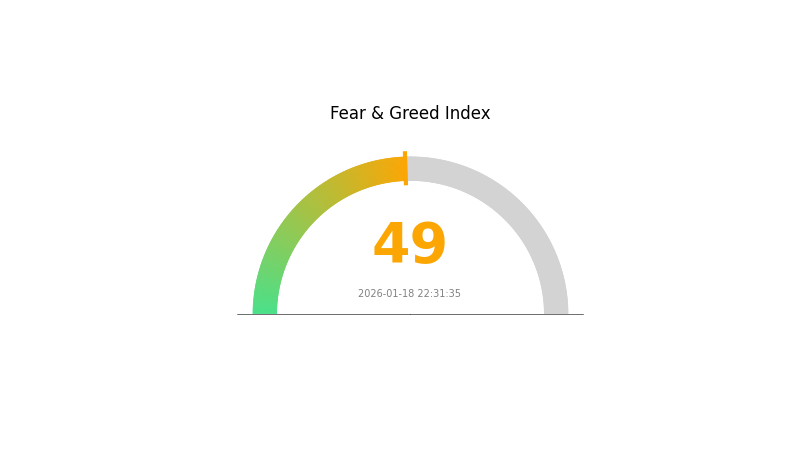
The token is held by approximately 76,376 addresses and is listed on 11 exchanges. SNT's contract is deployed on the Ethereum network at address 0x744d70FDBE2Ba4CF95131626614a1763DF805B9E. Current market sentiment indicators show a neutral Fear and Greed Index reading of 49.
Click to view current SNT market price
SNT Market Sentiment Indicator
2026-01-18 Fear and Greed Index: 49 (Neutral)
Click to view current Fear & Greed Index
The market is currently in a neutral state with the Fear and Greed Index at 49, indicating a balanced sentiment between buyers and sellers. This midpoint reading suggests the cryptocurrency market is experiencing neither excessive fear nor unbridled optimism. Investors should maintain a cautious yet opportunistic approach, as such conditions often precede significant price movements. Monitor market developments closely on Gate.com to identify potential entry or exit points.
SNT Holding Distribution
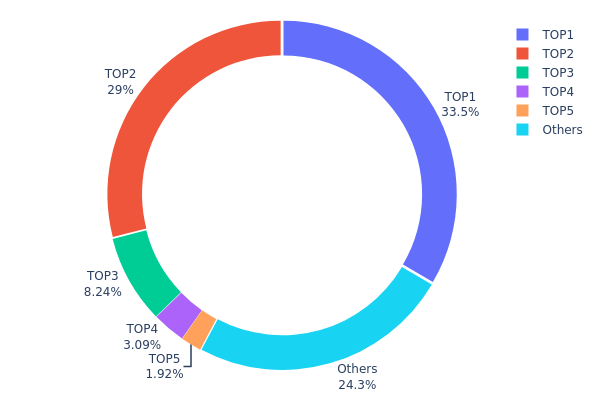
The holding distribution chart reveals the allocation of SNT tokens across different wallet addresses, providing insights into the token's concentration level and decentralization status. This metric is crucial for assessing market structure, as concentrated holdings can significantly impact price volatility and trading dynamics. By analyzing the distribution pattern, investors can better understand the potential risks associated with token concentration and evaluate the overall health of the token's on-chain ecosystem.
Based on the current data, SNT exhibits a notably concentrated holding structure. The top two addresses collectively control 62.46% of the total token supply, with the largest address holding 33.46% and the second-largest address holding 29.00%. This high concentration level suggests that a significant portion of SNT tokens is controlled by a small number of entities, which could be exchanges, institutional holders, or project-related wallets. The third through fifth addresses hold 8.24%, 3.09%, and 1.92% respectively, while all remaining addresses combined account for only 24.29% of the total supply.
This concentration pattern indicates several potential implications for market dynamics. The dominance of the top two addresses creates a relatively centralized token distribution, which may expose the market to increased volatility risks if these major holders decide to adjust their positions. Such concentration can also limit liquidity distribution and potentially facilitate price manipulation scenarios. However, it's worth noting that if these large holdings belong to exchange wallets or locked project reserves, the actual circulating concentration may differ from the apparent distribution. The relatively modest 24.29% held by smaller addresses suggests limited retail participation or widespread distribution, reflecting a market structure that remains heavily influenced by large stakeholders.
Click to view current SNT Holding Distribution
| Top |
Address |
Holding Qty |
Holding (%) |
| 1 |
0x3542...27b349 |
2277008.64K |
33.46% |
| 2 |
0xbbf0...af6022 |
1973412.35K |
29.00% |
| 3 |
0x5b0b...08c565 |
560974.03K |
8.24% |
| 4 |
0x57d7...5feafa |
210437.99K |
3.09% |
| 5 |
0x326d...70a601 |
130776.82K |
1.92% |
| - |
Others |
1652260.34K |
24.29% |
II. Core Factors Influencing SNT's Future Price
Market Sentiment and Investor Behavior
- Retail Psychology: Market sentiment plays a significant role in SNT's price movements, with investor confidence and trading patterns directly affecting short-term volatility.
- Price Discovery Mechanism: The market continuously reassesses SNT's value based on changing perceptions and external factors.
- Historical Pattern: Following its notable ICO and price surge during the 2017 bull market, SNT experienced substantial market capitalization contraction during bear markets, demonstrating its sensitivity to overall market sentiment.
Regulatory and Policy Environment
- Policy Oversight: Regulatory policies remain a critical factor affecting SNT's price trajectory, with potential policy changes creating uncertainty in the digital currency market.
- Risk Factors: Investment in digital currencies faces various challenges including market volatility, policy regulations, and technical limitations that may lead to significant price fluctuations.
Technological Innovation
- DApp Solutions: The project continues developing and implementing new solutions, focusing on unique decentralized application capabilities.
- Technical Development: Ongoing technological advancements and ecosystem improvements influence market perception and long-term value proposition.
Macroeconomic Trends
- Economic Indicators: Broader macroeconomic trends affect cryptocurrency markets, including inflation rates, monetary policies, and overall economic conditions.
- Market Cycles: SNT's performance remains tied to cryptocurrency market cycles and broader financial market conditions.
Investors should note that these factors interact dynamically and may create combined effects on price movements. While technological development shows promise, market participants should maintain awareness of the inherent volatility and risks associated with cryptocurrency investments.
III. 2026-2031 SNT Price Prediction
2026 Outlook
- Conservative prediction: $0.00946 - $0.01501
- Neutral prediction: Around $0.01501
- Optimistic prediction: Up to $0.01771 (requires favorable market conditions and increased adoption)
2027-2029 Outlook
- Market stage expectation: Gradual recovery and growth phase, with steady adoption of Status Network Token in decentralized communication ecosystems
- Price range predictions:
- 2027: $0.01505 - $0.02241 (approximately 8% growth)
- 2028: $0.01454 - $0.02191 (approximately 28% cumulative growth)
- 2029: $0.01136 - $0.02973 (approximately 37% cumulative growth)
- Key catalysts: Expansion of decentralized messaging adoption, potential protocol upgrades, and broader Web3 integration
2030-2031 Long-term Outlook
- Baseline scenario: $0.01814 - $0.02519 (assuming steady ecosystem development)
- Optimistic scenario: $0.02823 - $0.03035 (assuming accelerated adoption and enhanced utility)
- Transformative scenario: Up to $0.03582 (under extremely favorable conditions including mass adoption of decentralized communication platforms)
- 2026-01-19: SNT trading within initial forecast range of $0.00946 - $0.01771 (early-stage market positioning)
| Year |
Predicted High Price |
Predicted Average Price |
Predicted Low Price |
Price Change |
| 2026 |
0.01771 |
0.01501 |
0.00946 |
0 |
| 2027 |
0.02241 |
0.01636 |
0.01505 |
8 |
| 2028 |
0.02191 |
0.01939 |
0.01454 |
28 |
| 2029 |
0.02973 |
0.02065 |
0.01136 |
37 |
| 2030 |
0.03552 |
0.02519 |
0.01814 |
67 |
| 2031 |
0.03582 |
0.03035 |
0.02823 |
101 |
IV. SNT Professional Investment Strategies and Risk Management
SNT Investment Methodology
(1) Long-term Holding Strategy
- Target Investors: Investors focused on decentralized communication and Ethereum ecosystem growth
- Operational Recommendations:
- Accumulate SNT during market corrections when prices approach historical support levels
- Monitor Status platform user adoption metrics and DApp ecosystem development milestones
- Consider dollar-cost averaging to mitigate entry price volatility
- Storage Solution: Utilize Gate Web3 Wallet for secure SNT storage with multi-signature protection
(2) Active Trading Strategy
- Technical Analysis Tools:
- Moving Averages: Apply 50-day and 200-day moving averages to identify trend reversals and momentum shifts
- Relative Strength Index (RSI): Monitor RSI levels to detect overbought conditions above 70 and oversold conditions below 30
- Swing Trading Essentials:
- Establish clear entry and exit points based on support at $0.0148 and resistance at $0.0153 levels
- Implement stop-loss orders to limit downside exposure, positioning stops below key support zones
SNT Risk Management Framework
(1) Asset Allocation Principles
- Conservative Investors: Allocate 2-3% of crypto portfolio to SNT
- Aggressive Investors: Allocate 5-8% of crypto portfolio to SNT
- Professional Investors: Allocate 8-12% with active hedging strategies
(2) Risk Hedging Solutions
- Portfolio Diversification: Balance SNT holdings with established cryptocurrencies and stablecoins to reduce concentration risk
- Position Sizing: Limit individual position exposure to prevent significant capital erosion during adverse price movements
(3) Secure Storage Solutions
- Software Wallet Recommendation: Gate Web3 Wallet provides integrated security features for SNT and ERC-20 token management
- Multi-Signature Configuration: Implement multi-signature wallets for holdings exceeding moderate investment thresholds
- Security Precautions: Never share private keys or seed phrases, enable two-factor authentication, and regularly verify wallet addresses before transactions
V. SNT Potential Risks and Challenges
SNT Market Risks
- Price Volatility: SNT exhibits significant price fluctuations with 24-hour changes reaching -1.5% and annual declines of -69.89%, requiring strong risk tolerance
- Liquidity Constraints: With a circulating market cap of approximately $59.5 million, large transactions may experience slippage and limited order book depth
- Market Sentiment Dependency: Token performance correlates strongly with broader Ethereum ecosystem sentiment and decentralized application adoption trends
SNT Regulatory Risks
- Decentralized Communication Scrutiny: Encrypted messaging platforms face potential regulatory examination regarding privacy standards and compliance requirements
- Token Classification Uncertainty: Evolving regulatory frameworks may impact SNT's classification and permissible use cases across different jurisdictions
- Cross-border Transaction Limitations: Regulatory restrictions on cryptocurrency transactions could affect Status platform's global user accessibility
SNT Technical Risks
- Smart Contract Vulnerabilities: Dependence on Ethereum smart contracts exposes SNT to potential code exploits or protocol-level security weaknesses
- Ethereum Network Dependency: Performance and transaction costs are tied to Ethereum network conditions, including gas fee fluctuations and network congestion
- Platform Adoption Challenges: Status faces competitive pressures from established communication platforms and emerging Web3 social applications
VI. Conclusion and Action Recommendations
SNT Investment Value Assessment
Status (SNT) represents a pioneering approach to decentralized communication and DApp integration within the Ethereum ecosystem. The platform's comprehensive functionality—combining encrypted messaging, DApp browsing, and wallet services—positions it as a potential infrastructure component for Web3 adoption. However, the token faces considerable challenges, including a substantial decline of -69.89% over the past year and relatively modest market capitalization of $59.5 million. Long-term value proposition depends on increasing user adoption, successful ecosystem expansion, and broader acceptance of decentralized communication protocols. Short-term risks include continued price volatility, competitive market dynamics, and regulatory uncertainties surrounding encrypted communications.
SNT Investment Recommendations
✅ Beginners: Limit exposure to 1-2% of total crypto portfolio, focusing on educational understanding of decentralized communication platforms before increasing allocation
✅ Experienced Investors: Consider 3-5% allocation with active monitoring of platform development milestones and user growth metrics, implementing stop-loss protections
✅ Institutional Investors: Evaluate SNT within broader Web3 infrastructure thesis, allocating 5-10% with hedging strategies and thorough due diligence on competitive positioning
SNT Trading Participation Methods
- Spot Trading on Gate.com: Access SNT/USDT trading pairs with competitive liquidity and advanced order types for precise execution
- Dollar-Cost Averaging: Establish systematic purchase schedules to mitigate timing risk and reduce average acquisition costs
- Portfolio Rebalancing: Periodically adjust SNT holdings based on performance relative to other Ethereum ecosystem tokens and overall investment objectives
Cryptocurrency investments carry extremely high risk. This article does not constitute investment advice. Investors should make prudent decisions based on their own risk tolerance and are advised to consult professional financial advisors. Never invest more than you can afford to lose.
FAQ
What is SNT (Status Network Token) and what is its current market value?
SNT (Status Network Token) is the native token of the Status platform, a decentralized messaging and commerce network. As of 2026-01-18, SNT's market value is $15.13 per token, with a market cap of $72.64 million and a 24-hour trading volume of $54.88K.
What are the key factors that influence SNT price movements?
SNT price is influenced by Status app adoption and user growth, overall crypto market sentiment, Ethereum network performance as an ERC-20 token, regulatory news on privacy platforms, partnerships and integrations, governance token utility demand, competition from other messaging dApps, and DeFi ecosystem trends.
What is the price prediction for SNT in 2024 and 2025?
SNT was predicted to reach $0.040866 in 2024. For 2025, predictions remain uncertain and may vary based on market conditions and project developments.
How does SNT compare to other utility tokens in the blockchain ecosystem?
SNT distinguishes itself through governance rights, enabling holders to vote on network changes. Unlike many utility tokens focused solely on transactions, SNT offers unique governance participation, making it a differentiated utility token with community decision-making power.
What are the risks and volatility factors to consider when predicting SNT price?
SNT price volatility stems from market sentiment swings, speculative trading activity, regulatory developments, and broader crypto market trends. Trading volume fluctuations and liquidity conditions significantly impact price movements. Investor perception and macroeconomic factors also drive substantial price variations.
SNT has demonstrated modest price fluctuations recently, trading between 4.3000 and 4.4500. The token shows consolidation patterns with minor volatility. Limited significant trends are visible in short-term data, suggesting a relatively stable price movement phase currently.
How does the adoption of the Status app affect SNT token price?
Increased Status app adoption drives higher platform usage and user engagement, typically boosting SNT demand and price. Growing transaction volume and network effects create positive market sentiment, supporting SNT price appreciation over time.
* The information is not intended to be and does not constitute financial advice or any other recommendation of any sort offered or endorsed by Gate.