This comprehensive analysis examines Solana's (SOL) price dynamics and market potential from 2026-2031, currently trading at $138.67 with a market cap of $78.38 billion. The article integrates SOL's historical performance, ecosystem development, and macroeconomic factors to forecast price scenarios ranging from $94.36 to $301.69 by 2031. Key drivers include network stability improvements through Firedancer client upgrades, institutional adoption momentum, and DeFi ecosystem expansion with current TVL at $275 million. The analysis provides actionable investment strategies for beginners, experienced traders, and institutional investors, emphasizing risk management through diversification and position sizing. Critical risks involve network stability challenges, regulatory uncertainty, and intense competition from Ethereum and emerging Layer-1 blockchains. Investors on Gate exchange can access real-time market data, secure custody solutions, and trading mechanisms to participate in SOL's evolving market.
Introduction: SOL's Market Position and Investment Value
Solana (SOL), positioned as a high-performance Layer 1 blockchain protocol, has achieved significant milestones since its founding in 2017 by former engineers from Qualcomm, Intel, and Dropbox. As of 2026, Solana has secured the 6th position in global cryptocurrency rankings with a market capitalization of approximately $78.38 billion, a circulating supply of around 565.20 million tokens, and a price hovering near $138.67. This asset, recognized as a scalable blockchain solution focusing on maintaining decentralization and security without compromising performance, is playing an increasingly critical role in decentralized applications, DeFi protocols, and NFT ecosystems.
This article will comprehensively analyze SOL's price trends from 2026 to 2031, combining historical patterns, market supply and demand dynamics, ecosystem development, and macroeconomic conditions to provide investors with professional price forecasts and practical investment strategies.
I. SOL Price History Review and Market Status
SOL Historical Price Evolution Trajectory
- 2020: Solana launched on the market in March 2020 at an initial price of $0.22, reaching its historical low of $0.500801 on May 12, 2020
- 2021-2024: During the crypto market cycle, SOL experienced significant growth, with price fluctuations reflecting the broader market trends and ecosystem development
- 2025: SOL reached its historical high of $293.31 on January 19, 2025, marking a peak in its price trajectory
SOL Current Market Status
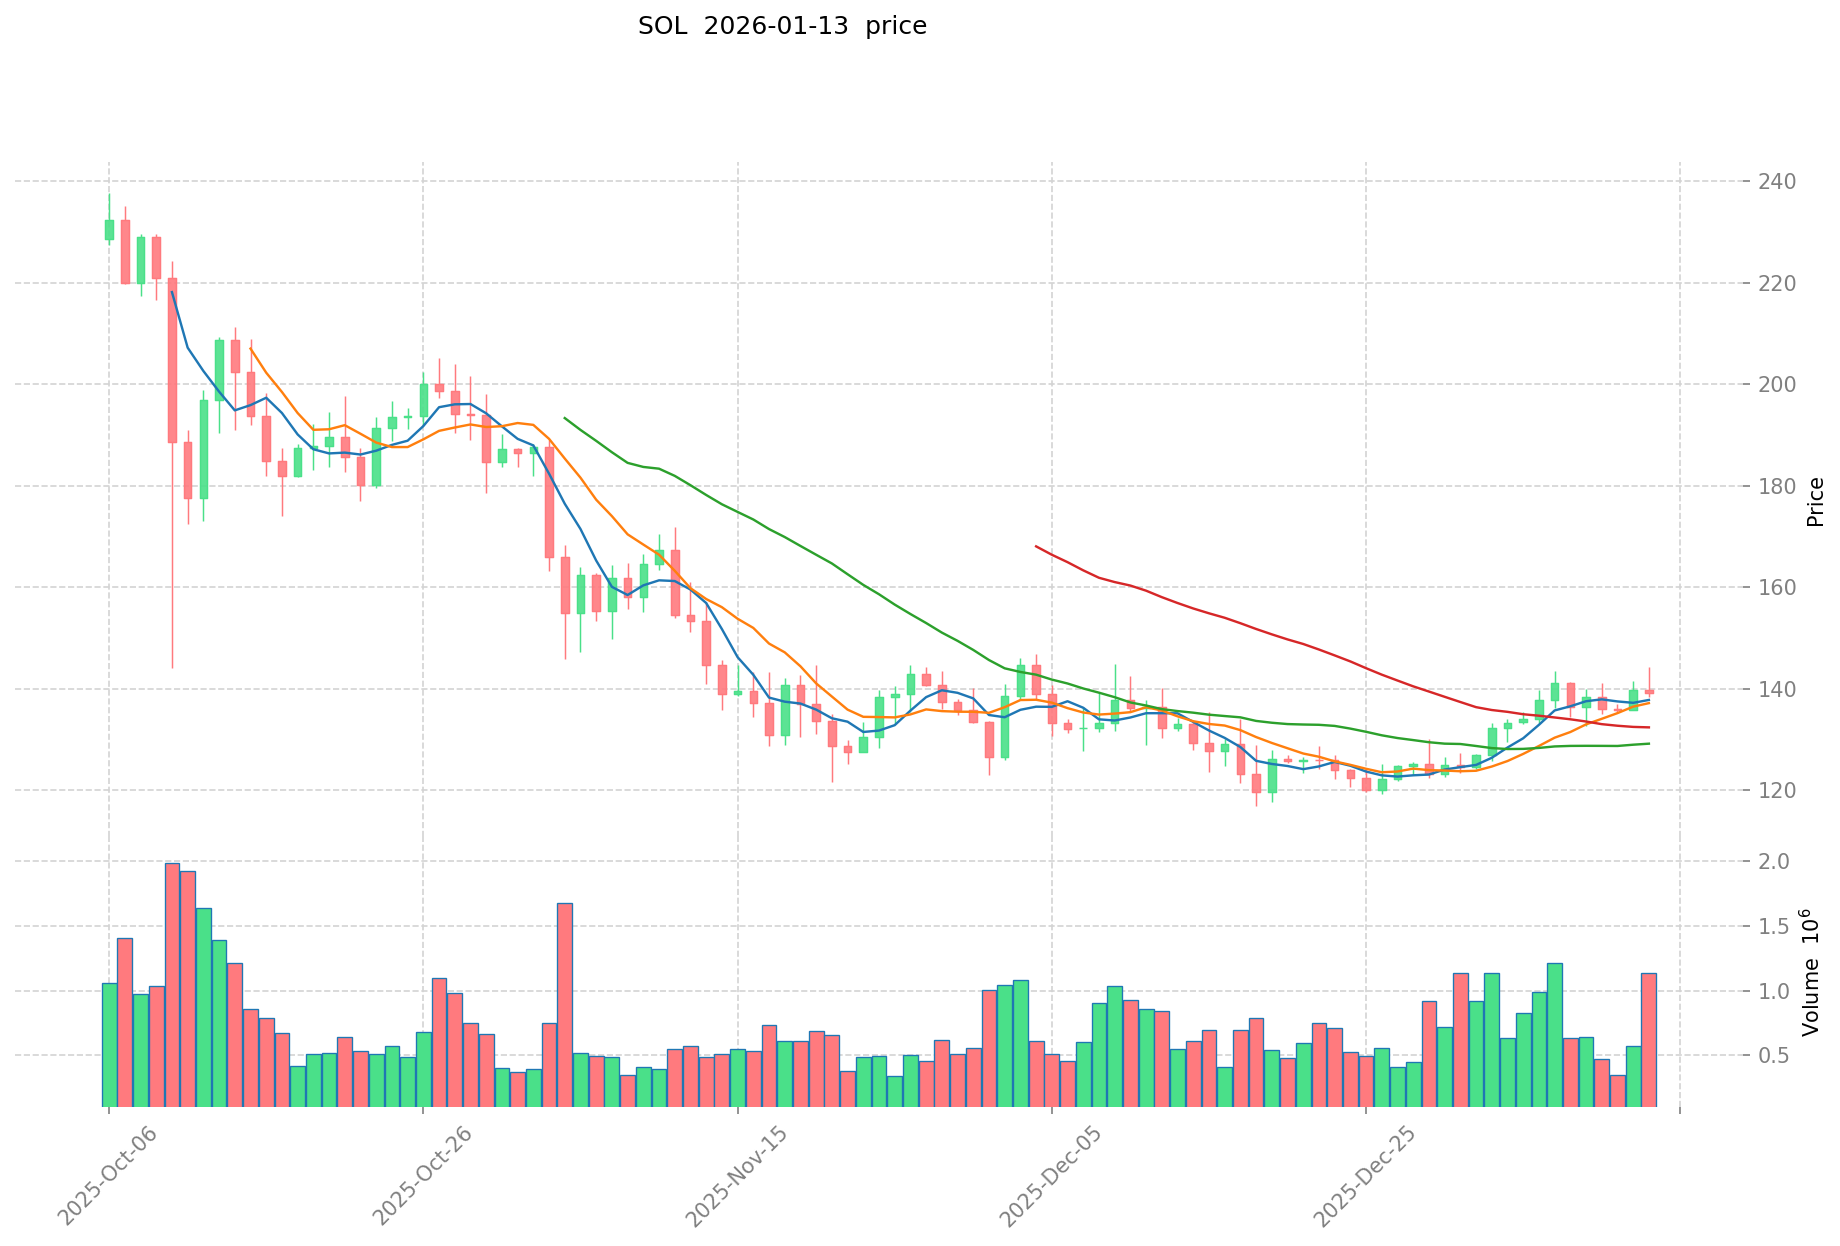
As of January 13, 2026, SOL is trading at $138.67, showing a 24-hour price decline of 2.75%. The token has demonstrated mixed short-term performance, with a 1-hour increase of 0.1% and a 7-day gain of 0.33%. Over the past 30 days, SOL has posted a positive return of 4.42%, though it remains down 26.36% from its price one year ago.
The 24-hour trading range spans from $137.85 to $144.3, indicating moderate intraday volatility. SOL currently ranks 6th among cryptocurrencies by market capitalization, with a circulating market cap of $78.38 billion and a fully diluted market cap of $85.73 billion. The circulating supply stands at 565.20 million SOL tokens, representing 91.42% of the total supply of 618.23 million tokens.
With a market dominance of 2.62%, SOL maintains its position as a leading blockchain protocol. The token has attracted a substantial user base of 2.75 million holders and is listed on 79 cryptocurrency exchanges. The 24-hour trading volume of $139.15 million reflects continued market interest and liquidity.
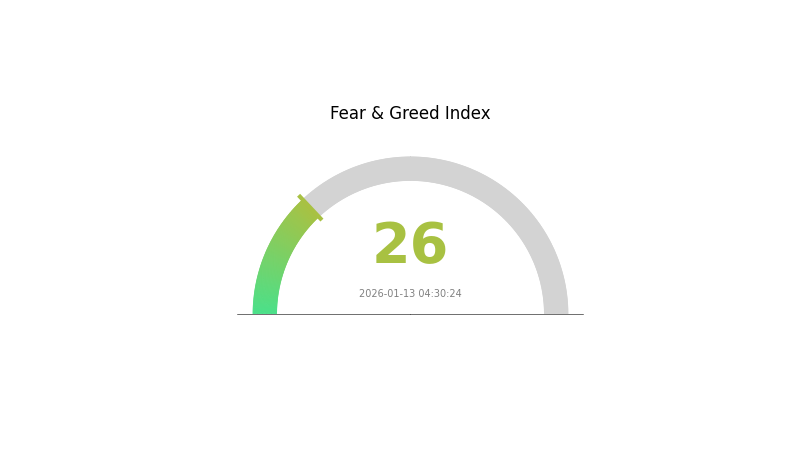
The current market sentiment index indicates a "Fear" reading of 26, suggesting cautious positioning among market participants. The ratio of market cap to fully diluted valuation stands at 91.42%, indicating a relatively high proportion of tokens already in circulation.
Click to view current SOL market price
SOL Market Sentiment Indicator
2026-01-13 Fear and Greed Index: 26 (Fear)
Click to view current Fear & Greed Index
The SOL market is currently experiencing a fear-dominated sentiment with an index reading of 26. This low score indicates significant market anxiety and pessimism among investors. During such periods, extreme fear often creates potential buying opportunities for contrarian traders, while risk-averse investors may prefer to hold or increase defensive positions. Market participants should monitor key support levels and maintain disciplined trading strategies. On Gate.com, you can track real-time sentiment indicators and adjust your investment approach accordingly.
SOL Holdings Distribution
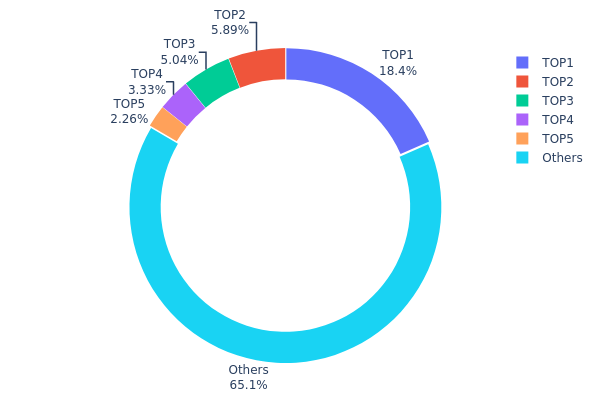
The holdings distribution chart illustrates the concentration of SOL tokens across different wallet addresses, providing insights into asset ownership structure and decentralization levels within the network. This metric is crucial for assessing potential market manipulation risks and overall ecosystem health.
According to current data, the top holder controls approximately 113,787.99K SOL, representing 18.40% of total supply, while the second and third largest addresses hold 5.88% and 5.04% respectively. The top five addresses collectively account for 34.91% of total supply, with the remaining 65.09% distributed among other addresses. This concentration pattern indicates a moderately centralized holding structure, where roughly one-third of supply remains controlled by a limited number of major stakeholders. Such distribution characteristics suggest potential vulnerability to large-scale sell pressure from whale addresses.
From a market structure perspective, this concentration level presents both opportunities and risks. The presence of large holders can provide liquidity stability during normal market conditions, but simultaneously increases the probability of significant price volatility if major addresses initiate substantial position adjustments. The 65.09% holdings distributed among smaller addresses demonstrates reasonable participation from retail and mid-tier investors, offering some degree of decentralization that helps mitigate single-point manipulation risks. However, the ability of top addresses to collectively influence 34.91% of supply warrants cautious monitoring, particularly during periods of heightened market uncertainty or major protocol updates.
Click to view current SOL Holdings Distribution
| Top |
Address |
Holding Qty |
Holding (%) |
| 1 |
4ZJhPQ...oekbPY |
113787.99K |
18.40% |
| 2 |
9WzDXw...YtAWWM |
36394.18K |
5.88% |
| 3 |
2RH6rU...aEFFSK |
31177.57K |
5.04% |
| 4 |
6iQKfE...e9pVSS |
20604.06K |
3.33% |
| 5 |
4cpnpi...FTiwJt |
13982.96K |
2.26% |
| - |
Others |
402144.62K |
65.09% |
II. Core Factors Influencing SOL's Future Price
Supply Mechanism
- Staking and Inflation Model: SOL operates under an inflation mechanism where the inflation rate gradually decreases over time, eventually stabilizing. More than 60% of SOL tokens are staked within the network to maintain security and generate yields. This staking locks a significant portion of tokens, reducing circulating supply in the market.
- Historical Pattern: The staking mechanism has historically provided potential price support by limiting available supply. The locked tokens reduce selling pressure during market downturns.
- Current Impact: The inflation generated by the network needs to be absorbed by demand growth driven by ecosystem expansion. The balance between new token issuance and ecosystem adoption remains a key variable affecting price dynamics.
Institutional and Major Holder Dynamics
- Institutional Interest: Recent expectations surrounding spot ETF approvals have attracted renewed investor attention to SOL, potentially signaling growing institutional interest in the asset.
- Network Validation: Validator revenue sustainability and staking inflation present ongoing considerations, though institutional capital inflows may provide upward price momentum.
- Ecosystem Funding: External capital participation requires monitoring, as major funding initiatives could signal confidence in the platform's long-term viability.
Macroeconomic Environment
- Monetary Policy Impact: SOL's price exhibits correlation with Bitcoin and broader risk assets. Global interest rate policies and liquidity conditions influence the valuation of cryptocurrencies, including SOL. Federal Reserve monetary policy decisions and inflation data directly affect price trends.
- Risk Asset Correlation: During Bitcoin-led bull markets, capital typically flows more actively into assets with growth potential like SOL. Conversely, during bear markets or correction periods, capital may flow back, potentially resulting in larger declines for SOL.
- Market Sentiment: Macroeconomic factors and regulatory developments can significantly impact investor sentiment toward cryptocurrencies.
Technical Development and Ecosystem Building
- Firedancer Client: The development team continues advancing optimization efforts, with the Firedancer client aimed at enhancing network resilience and performance representing an important positive catalyst. Each successful major upgrade may become a driver for price appreciation.
- Network Stability: Solana's network has experienced interruptions due to transaction overload in the past, which has impacted market confidence. Long-term stable network operation remains essential for investor confidence.
- DeFi Ecosystem: Decentralized exchanges and lending protocols lock substantial amounts of SOL as collateral and liquidity. Growth in Total Value Locked (TVL) serves as an indicator of ecosystem health. Current TVL stands at approximately $275 million, ranking tenth among blockchains.
- NFT and Consumer Applications: The NFT market, along with gaming and social applications, attracts numerous users whose daily transactions require SOL for transaction fees. The platform hosts over 180 decentralized applications (DApps) covering DeFi, NFT, gaming, and other sectors.
- Competitive Landscape: Solana faces competition from Ethereum and its Layer 2 solutions, as well as emerging blockchains like Avalanche, Sui, and Aptos, which approach the market from different technical perspectives, competing for developers and users.
III. 2026-2031 SOL Price Prediction
2026 Outlook
- Conservative Forecast: $94.36 - $138.76
- Neutral Forecast: Around $138.76
- Optimistic Forecast: Up to $206.75 (requires sustained network growth and favorable market conditions)
2027-2029 Mid-term Outlook
- Market Phase Expectation: Gradual appreciation phase with increasing network adoption and ecosystem expansion
- Price Range Forecast:
- 2027: $167.57 - $214.22 (approximately 24% growth from 2026)
- 2028: $141.25 - $253.47 (approximately 39% growth from 2026)
- 2029: $140.79 - $279.35 (approximately 60% growth from 2026)
- Key Catalysts: Enhanced scalability solutions, institutional adoption momentum, and broader DeFi integration on Solana network
2030-2031 Long-term Outlook
- Baseline Scenario: $145.82 - $251.41 (assuming steady market maturation)
- Optimistic Scenario: $259.96 - $301.69 (contingent on widespread mainstream adoption)
- Transformative Scenario: Approaching $301.69 (requires breakthrough developments in blockchain technology and regulatory clarity)
- 2026-01-13: SOL baseline projection remains stable with conservative floor at $94.36
| Year |
Predicted High Price |
Predicted Average Price |
Predicted Low Price |
Price Change |
| 2026 |
206.75 |
138.76 |
94.3568 |
0 |
| 2027 |
214.22 |
172.76 |
167.57 |
24 |
| 2028 |
253.47 |
193.49 |
141.25 |
39 |
| 2029 |
279.35 |
223.48 |
140.79 |
60 |
| 2030 |
301.69 |
251.41 |
145.82 |
80 |
| 2031 |
287.62 |
276.55 |
259.96 |
99 |
IV. SOL Professional Investment Strategy and Risk Management
SOL Investment Methodology
(I) Long-term Holding Strategy
- Suitable for: investors seeking exposure to blockchain infrastructure with strong fundamentals
- Operational Recommendations:
- Consider dollar-cost averaging to mitigate timing risk in volatile market conditions
- Monitor network development progress and ecosystem adoption metrics regularly
- Storage Solution: Utilize secure self-custody options such as Gate Web3 Wallet for enhanced security and asset control
(II) Active Trading Strategy
- Technical Analysis Tools:
- Moving Averages: Track 50-day and 200-day moving averages to identify potential trend reversals and momentum shifts
- Volume Analysis: Monitor on-chain transaction volume and trading volume patterns to gauge market sentiment
- Swing Trading Key Points:
- Identify support levels around recent price ranges and resistance near previous peaks
- Set stop-loss orders to manage downside risk during volatile market movements
SOL Risk Management Framework
(I) Asset Allocation Principles
- Conservative Investors: 2-5% of crypto portfolio allocation
- Aggressive Investors: 8-15% of crypto portfolio allocation
- Professional Investors: up to 20% with active hedging strategies
(II) Risk Hedging Solutions
- Portfolio Diversification: Allocate across multiple blockchain protocols and asset classes to reduce concentration risk
- Position Sizing: Limit individual position exposure based on personal risk tolerance and market volatility
(III) Secure Storage Solutions
- Self-Custody Wallet Recommendation: Gate Web3 Wallet provides comprehensive security features for SOL asset management
- Multi-Signature Solution: Consider multi-signature wallet configurations for larger holdings to enhance security
- Security Considerations: Never share private keys or seed phrases, enable two-factor authentication, and regularly update security protocols
V. SOL Potential Risks and Challenges
SOL Market Risks
- Volatility Risk: SOL has experienced significant price fluctuations, with recent 24-hour change of -2.75% and 1-year change of -26.36%, indicating substantial market volatility
- Liquidity Risk: During periods of market stress, trading liquidity may decline, potentially impacting execution prices
- Competition Risk: Solana faces intense competition from other Layer-1 blockchain platforms in the scalability and performance space
SOL Regulatory Risks
- Regulatory Uncertainty: Evolving global cryptocurrency regulations may impact Solana's operations and market accessibility
- Compliance Requirements: Potential changes in securities classification or registration requirements could affect token trading and distribution
- Geographic Restrictions: Certain jurisdictions may impose restrictions on cryptocurrency trading and holding
SOL Technical Risks
- Network Stability: Historical network outages and performance issues may affect user confidence and adoption
- Security Vulnerabilities: Smart contract exploits and protocol-level vulnerabilities present ongoing technical challenges
- Scalability Trade-offs: The balance between performance, security, and decentralization requires continuous optimization
VI. Conclusion and Action Recommendations
SOL Investment Value Assessment
Solana represents a high-performance blockchain infrastructure with demonstrated technical capabilities in scalability and transaction throughput. With a current market capitalization of approximately $78.38 billion and ranking 6th among cryptocurrencies, SOL maintains significant market presence. The current price of $138.67 reflects a substantial decline from its all-time high of $293.31 recorded on January 19, 2025, presenting both potential opportunity and elevated risk. The circulating supply represents 91.42% of total supply, indicating relatively mature token distribution. Long-term value proposition depends on continued ecosystem development, sustained network stability, and competitive positioning against alternative Layer-1 platforms. Short-term risks include market volatility, technical challenges, and broader cryptocurrency market sentiment.
SOL Investment Recommendations
✅ Beginners: Start with small position sizes to understand market dynamics, utilize Gate.com platform for secure trading, and focus on educational resources before significant capital allocation
✅ Experienced Investors: Consider strategic accumulation during market weakness while maintaining disciplined risk management and portfolio diversification
✅ Institutional Investors: Conduct thorough due diligence on network metrics, ecosystem growth, and competitive positioning before establishing positions, with appropriate hedging strategies
SOL Trading Participation Methods
- Spot Trading: Direct purchase and holding of SOL tokens through Gate.com platform with competitive trading fees
- Dollar-Cost Averaging: Systematic periodic purchases to reduce timing risk and smooth entry prices over time
- Portfolio Integration: Incorporate SOL as part of diversified cryptocurrency portfolio with appropriate weighting based on risk tolerance
Cryptocurrency investment carries extremely high risks, and this article does not constitute investment advice. Investors should make prudent decisions based on their own risk tolerance, and consulting professional financial advisors is recommended. Never invest more than you can afford to lose.
FAQ
SOL has demonstrated solid growth trajectory. As of early January 2026, SOL traded around $124-$129, reflecting strong market positioning. Throughout late 2025, the token maintained resilience with prices ranging between $123-$127, showcasing stable demand and consistent investor confidence in the Solana ecosystem.
What are the main factors affecting Solana (SOL) price?
Solana's price is primarily influenced by network performance, transaction volume, developer adoption, DeFi ecosystem growth, competition from other blockchains, overall cryptocurrency market trends, and regulatory developments. Increased usage and innovation on the platform drive demand for SOL tokens.
How to analyze and predict SOL's future price trends?
Analyze SOL by monitoring blockchain technology advancements, network transaction volume, ecosystem development, and market demand. SOL reached $235.38 in early 2026 with potential for further growth driven by DeFi adoption and institutional investment.
How is the price correlation between SOL and other mainstream public chain tokens such as ETH and BNB?
SOL and BNB show similar long-term price appreciation trends, both outperforming ETH. As of 2026, SOL displays 37% growth, BNB 34%, and ETH 24%, indicating moderate positive correlation among these major Layer 1 tokens.
What are the main risks and uncertainties in SOL price prediction?
Main risks include regulatory uncertainty and token unlock schedules. Policy changes may impact market participation, while early investor token releases can cause periodic price volatility. Market sentiment and macro conditions also significantly influence SOL price movements.
What is the target price prediction for SOL by professional institutions?
Professional institutions predict Solana(SOL)price targets between $200 to $400 based on market trends and technical analysis. These projections remain relevant through 2026.
* The information is not intended to be and does not constitute financial advice or any other recommendation of any sort offered or endorsed by Gate.