This article offers an expert analysis of the SOLV Protocol's market position and price forecast for 2025-2030. It delves into SOLV's historical price trajectory, current market status, and factors influencing future price movements, such as macroeconomic environment and technological developments. The piece provides investment strategies and risk management frameworks tailored for beginner, experienced, and institutional investors. With insights into market sentiment, liquidity dynamics, and token holdings concentration, readers will understand SOLV's potential risks and opportunities within the DeFi ecosystem. Ideal for Bitcoin and digital asset investment enthusiasts, it emphasizes SOLV's role in unlocking liquidity and maximizing idle Bitcoin asset utility.
Introduction: Market Position and Investment Value of SOLV
SOLV (Solv Protocol) is a leading Bitcoin staking protocol that builds a thriving Bitcoin-centric financial ecosystem by unlocking liquidity and maximizing the utility of idle Bitcoin assets. Since its launch, SOLV has established itself as a significant player in the Bitcoin DeFi landscape. As of December 2025, SOLV has achieved a market capitalization of approximately $22.62 million, with a circulating supply of 1.48 billion tokens trading at around $0.01526 per token. This innovative protocol represents a crucial infrastructure component in enabling efficient Bitcoin asset utilization across decentralized finance.
This comprehensive analysis will examine SOLV's price trajectory from 2025 through 2030, integrating historical price patterns, market supply-demand dynamics, ecosystem development, and macroeconomic factors to deliver professional price forecasts and actionable investment strategies for investors seeking exposure to Bitcoin-centric financial solutions.
I. SOLV Price History Review and Current Market Status
SOLV Historical Price Evolution Trajectory
- January 2025: SOLV reached its all-time high of $0.1737 on January 17, 2025, marking a peak performance period for the token.
- October 2025: SOLV declined to its all-time low of $0.00278 on October 10, 2025, representing a significant correction from previous highs.
SOLV Current Market Situation
As of December 20, 2025, SOLV is trading at $0.01526, reflecting a volatile market performance over the year. The token has experienced substantial downward pressure, with a one-year decline of -93.30%, though recent shorter-term movements show recovery signs with a 24-hour gain of 4.44% and a 7-day gain of 1.94%.
The current market capitalization stands at $22.62 million with a fully diluted valuation of $147.41 million, representing a 15.35% circulating supply ratio. The 24-hour trading volume is approximately $140,890.59, indicating moderate liquidity levels. SOLV maintains a market ranking of 815 with a market dominance of 0.0046%.
The token is held by 127,589 unique addresses and is actively traded on 31 exchanges, with Gate.com supporting SOLV trading. The current market sentiment reflects extreme fear (VIX level of 20), suggesting heightened market anxiety and volatility.
Recent price action shows SOLV trading within a 24-hour range of $0.01461 to $0.01533, with the 30-day performance declining by -6.04%, indicating consolidation within a challenging broader market environment.
Click to view current SOLV market price

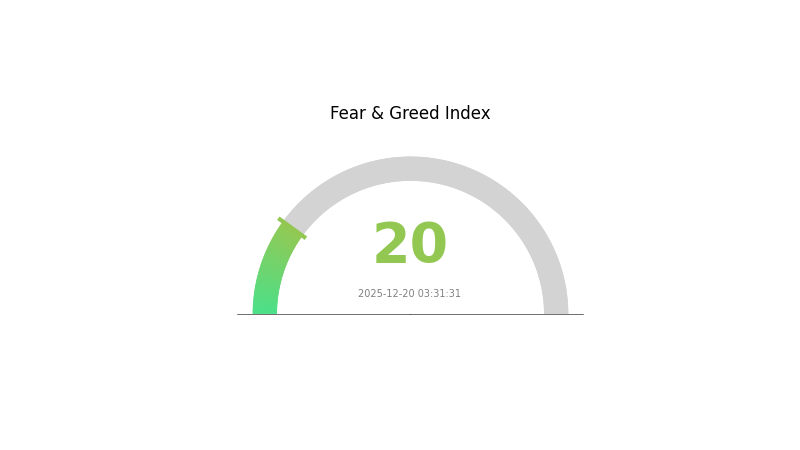
SOLV Market Sentiment Indicator
2025-12-20 Fear and Greed Index: 20 (Extreme Fear)
Click to view current Fear & Greed Index
The cryptocurrency market is currently experiencing extreme fear, with the index plummeting to 20. This indicates severe market pessimism and heightened risk aversion among investors. Such extreme readings often present contrarian opportunities, as oversold conditions may precede market reversals. However, extreme fear also signals elevated volatility and potential downside risks. Investors should exercise caution and conduct thorough analysis before making investment decisions during this period of intense market uncertainty.
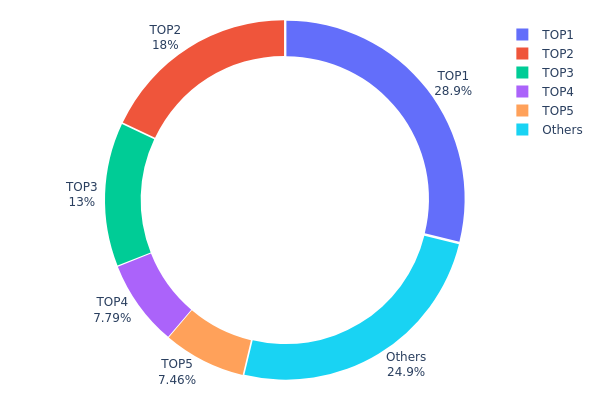
SOLV Holdings Distribution
The address holdings distribution map represents the concentration of SOLV tokens across blockchain addresses, revealing the ownership structure and decentralization characteristics of the token. By analyzing the top token holders and their respective percentages, this metric provides critical insights into potential market risks, liquidity dynamics, and governance implications.
SOLV exhibits pronounced concentration characteristics, with the top five addresses collectively controlling 75.11% of the total token supply. The largest holder commands 28.86% of all tokens, while the second and third holders account for 18.00% and 13.00% respectively. This significant concentration among a limited number of addresses raises concerns regarding decentralization. The remaining 24.89% distributed across other addresses suggests that the majority of SOLV's liquidity and supply is held by a relatively small cohort of stakeholders, potentially creating dependencies on institutional or large-scale investors for market stability.
This distribution pattern carries material implications for market dynamics and price stability. Concentrated holdings increase susceptibility to sudden selling pressure or coordinated market movements, as major holders possess substantial influence over available liquidity. The skewed ownership structure may also amplify volatility during periods of market uncertainty, as large stakeholders' decisions can disproportionately impact price discovery mechanisms. Furthermore, such concentration reflects a centralized token distribution model that contradicts principles of decentralized finance, potentially limiting organic community participation and reducing resilience to manipulative trading activities.
Click to view current SOLV holdings distribution
| Top |
Address |
Holding Qty |
Holding (%) |
| 1 |
0xbf1f...b44ca0 |
2424240.00K |
28.86% |
| 2 |
0x82b3...a61c5f |
1512000.00K |
18.00% |
| 3 |
0x07ea...0b8205 |
1092000.00K |
13.00% |
| 4 |
0xa354...e254ef |
654360.00K |
7.79% |
| 5 |
0x5a52...70efcb |
626990.43K |
7.46% |
| - |
Others |
2090409.57K |
24.89% |
Core Factors Influencing SOLV's Future Price
Macroeconomic Environment
-
Monetary Policy Impact: 2025 is expected to usher in a cycle of interest rate cuts and accommodative monetary policies, which could create a favorable environment for cryptocurrency adoption and investment.
-
Geopolitical Factors: Shifts in government policies toward cryptocurrencies, including potential positive regulatory stances, may significantly influence market sentiment and SOLV's valuation trajectory.
Technology Development and Ecosystem Building
-
ERC-3525 Standard Innovation: SOLV Protocol serves as the pioneer of the ERC-3525 standard, which introduces semi-fungible token capabilities. This innovation enables more sophisticated token management and utility compared to traditional ERC-20 and ERC-721 standards.
-
Bitcoin Staking Infrastructure: SOLV is positioning itself as a core force in standardizing Bitcoin staking mechanisms. The protocol's framework aims to facilitate large-scale Bitcoin staking adoption by ensuring security, liquidity, and standardization across the industry.
-
Ecosystem Security and Liquidity: Future challenges and growth depend on SOLV's ability to maintain security and liquidity standards while establishing its standardized framework as an industry-wide foundation that gains broad acceptance across the Web3 ecosystem.
Three、2025-2030 SOLV Price Forecast
2025 Outlook
- Conservative Forecast: $0.01068 - $0.01525
- Neutral Forecast: $0.01525
- Optimistic Forecast: $0.01906 (requires sustained ecosystem development and institutional adoption)
2026-2028 Medium-term Outlook
- Market Stage Expectation: Gradual recovery and growth phase with increasing market participation and protocol maturation
- Price Range Forecast:
- 2026: $0.01132 - $0.02539
- 2027: $0.01085 - $0.03127
- 2028: $0.02391 - $0.02759
- Key Catalysts: Enhanced tokenomics implementation, strategic partnerships expansion, increased DeFi integration, and growing user base adoption on major platforms like Gate.com
2029-2030 Long-term Outlook
- Base Case Scenario: $0.02074 - $0.02855 (assuming continued ecosystem growth and moderate market conditions)
- Optimistic Scenario: $0.02524 - $0.03107 (assuming accelerated protocol adoption and favorable market sentiment)
- Transformation Scenario: Sustained upward trajectory approaching $0.03107+ (enabled by breakthrough technological innovations, major enterprise partnerships, and significant market expansion)
- December 20, 2025: SOLV trading near $0.01525 (consolidating within annual range, awaiting catalyst triggers)
| 年份 |
预测最高价 |
预测平均价格 |
预测最低价 |
涨跌幅 |
| 2025 |
0.01906 |
0.01525 |
0.01068 |
0 |
| 2026 |
0.02539 |
0.01716 |
0.01132 |
12 |
| 2027 |
0.03127 |
0.02127 |
0.01085 |
39 |
| 2028 |
0.02759 |
0.02627 |
0.02391 |
72 |
| 2029 |
0.02855 |
0.02693 |
0.02074 |
76 |
| 2030 |
0.03107 |
0.02774 |
0.02524 |
81 |
Solv Protocol (SOLV) Professional Investment Strategy and Risk Management Report
IV. SOLV Professional Investment Strategy and Risk Management
SOLV Investment Methodology
(1) Long-term Holding Strategy
- Suitable for: Bitcoin ecosystem enthusiasts and institutional investors seeking exposure to Bitcoin staking protocols
- Operational Suggestions:
- Accumulate SOLV during market downturns, particularly when prices fall below previous support levels
- Hold through market cycles to benefit from the maturation of Bitcoin-centric financial ecosystems
- Set a multi-year investment horizon to capture protocol adoption growth and increased Bitcoin staking demand
(2) Active Trading Strategy
- Market Structure Analysis:
- Volume Analysis: Monitor the 24-hour trading volume of 140,890.59 SOLV to identify liquidity conditions and potential breakout opportunities
- Price Action: Track support at 0.01461 and resistance at 0.01533 for intraday trading decisions
- Wave Trading Key Points:
- The 24-hour price increase of 4.44% suggests short-term bullish momentum that may present swing trading opportunities
- Consider the 30-day decline of -6.04% as a potential indicator of consolidation, presenting accumulation opportunities for longer-term positions
- Monitor the asset's recovery trajectory from the all-time low of 0.00278 (reached on October 10, 2025) as a gauge of protocol health recovery
SOLV Risk Management Framework
(1) Asset Allocation Principles
- Conservative Investors: 1-2% of portfolio allocation
- Active Investors: 2-5% of portfolio allocation
- Professional Investors: 5-10% of portfolio allocation
(2) Risk Hedging Solutions
- Position Sizing: Implement strict position sizing limits to prevent excessive exposure to Bitcoin staking protocol volatility
- Rebalancing Schedule: Conduct quarterly rebalancing to maintain target allocation weights and lock in gains during strong performance periods
(3) Security Storage Solutions
- Hot Wallet Management: For active trading, use Gate.com's Web3 wallet for convenient access and real-time transaction capabilities
- Cold Storage Protocol: For long-term holdings, transfer SOLV to offline storage solutions to eliminate counterparty risk and exchange-related vulnerabilities
- Security Best Practices: Enable two-factor authentication on all exchange accounts, never share private keys, and verify contract addresses before transactions to prevent phishing attacks
V. SOLV Potential Risks and Challenges
SOLV Market Risks
- Liquidity Risk: With a market cap of $22.62 million and only 31 exchange listings, SOLV faces potential liquidity challenges during market stress periods, potentially resulting in unfavorable execution prices
- Extreme Volatility: The 1-year price decline of -93.30% (from approximately 0.459 to current 0.01526) demonstrates extreme volatility, indicating SOLV is highly sensitive to market sentiment shifts and Bitcoin staking trend changes
- Circulation Supply Concentration: Only 15.35% of total supply is currently circulating, creating significant dilution risk when additional tokens enter the market
SOLV Regulatory Risks
- Bitcoin Staking Regulatory Uncertainty: As Bitcoin staking protocols operate in an evolving regulatory landscape, changes in cryptocurrency staking classification could impact SOLV's operational framework
- Jurisdictional Restrictions: Different countries may impose varying restrictions on staking rewards or protocol participation, potentially limiting SOLV's addressable market
- Compliance Challenges: Regulatory bodies may introduce stricter requirements for Bitcoin-related protocols, potentially increasing compliance costs and operational complexity
SOLV Technical Risks
- Protocol Scalability: As the Bitcoin staking ecosystem expands, SOLV must demonstrate sustained technical capability to handle increased transaction volume and user demand
- Smart Contract Vulnerability: BSC-based token protocols are subject to smart contract risks, potential code vulnerabilities, and exploitation vectors
- Bitcoin Integration Dependencies: SOLV's functionality depends on the stability and security of both the BSC network and Bitcoin network, creating multi-layer technical dependencies
VI. Conclusion and Action Recommendations
SOLV Investment Value Assessment
Solv Protocol represents an emerging opportunity within the Bitcoin staking ecosystem, addressing the significant challenge of unlocking liquidity from idle Bitcoin assets. The protocol's positioning in the Bitcoin-centric financial ecosystem aligns with long-term trends in cryptocurrency infrastructure development. However, investors must acknowledge the extreme volatility (93.30% annual decline) and limited liquidity profile (market cap of $22.62 million). The project shows early-stage characteristics with meaningful downside risk, but potential upside for those believing in Bitcoin staking protocol adoption. Success depends critically on achieving product-market fit, expanding Bitcoin staking adoption, and navigating regulatory developments in the emerging staking protocol space.
SOLV Investment Recommendations
✅ Beginners: Start with micro-positions (0.5-1% of portfolio) using dollar-cost averaging over 3-6 months to reduce timing risk and familiarize yourself with SOLV's performance characteristics before scaling allocation
✅ Experienced Investors: Implement a core-satellite strategy with a small core position (2-3%) for long-term exposure and tactical satellite positions (2-3%) for active trading around identified support and resistance levels
✅ Institutional Investors: Conduct dedicated due diligence on the Solv Protocol team, roadmap execution, and Bitcoin staking market adoption metrics before committing capital; establish clear exit criteria based on protocol milestones and market conditions
SOLV Trading Participation Methods
- Gate.com Direct Trading: Execute SOLV spot trading directly on Gate.com with competitive spreads and reliable liquidity for both spot purchases and sales
- Limit Order Strategy: Place limit orders at support levels (0.01461) to accumulate positions during pullbacks and at resistance levels (0.01533) to take profits
- Portfolio Tracking: Use Gate.com's portfolio monitoring tools to track SOLV performance against Bitcoin staking sector benchmarks and rebalance according to your target allocation
Cryptocurrency investments carry extreme risk. This report does not constitute investment advice. Investors should make decisions based on their own risk tolerance and are strongly advised to consult with professional financial advisors. Never invest more capital than you can afford to lose completely.
FAQ
What is the future of Solv coin?
Solv coin is projected to reach $0.04118 by 2030, representing a potential 172.73% increase. The future depends on market adoption, protocol development, and ecosystem growth. Strong fundamentals position SOLV for long-term value appreciation in the Web3 space.
Can solv coin reach $1?
Yes, Solv coin reaching $1 is possible with significant market adoption and technological advancement. While speculative, sustained growth in the DeFi ecosystem and increased utility could drive substantial price appreciation over time.
What factors influence SOLV price movements?
SOLV price is influenced by market sentiment, trading volume, technological developments, user adoption trends, and broader crypto market conditions.
* The information is not intended to be and does not constitute financial advice or any other recommendation of any sort offered or endorsed by Gate.