This comprehensive article provides professional SUI price analysis and market forecasts for 2026-2031, designed for investors seeking Layer 1 blockchain exposure. The analysis examines SUI's market position—currently trading at $1.7976 with $6.82B market cap (ranked 22nd)—combining historical trends, supply mechanics, and ecosystem developments. Key sections address core price drivers including token unlock schedules, institutional adoption through ETF applications, and DeFi ecosystem expansion reaching $1.81B TVL. The article presents tiered price predictions: 2026 outlook $1.43-$2.28, with 2031 reaching $1.66-$3.49 under various scenarios. Professional investment strategies cover long-term holding, active trading techniques, and risk management frameworks suitable for beginner through institutional investors. Critical risk factors including 61.99% yearly decline, regulatory uncertainties, and market concentration are thoroughly analyzed. Practical guidance includes secure storage via Gate Web3 Wallet and p
Introduction: SUI's Market Position and Investment Value
Sui (SUI), as a permissionless Layer 1 blockchain designed to support the next billion users in web3, has demonstrated remarkable growth since its launch in 2023. As of 2026, SUI has achieved a market capitalization of approximately $6.82 billion, with a circulating supply of around 3.79 billion tokens, and a current price hovering near $1.80. This asset, recognized for its horizontal scalability and low-cost infrastructure, is playing an increasingly critical role in decentralized application development and web3 ecosystem expansion.
This article will comprehensively analyze SUI's price trends from 2026 to 2031, combining historical patterns, market supply and demand dynamics, ecosystem development, and macroeconomic conditions to provide investors with professional price predictions and practical investment strategies.
I. SUI Price History Review and Market Status
SUI Historical Price Evolution Trajectory
- 2023: SUI launched in May 2023 at $0.1, experiencing significant volatility throughout its first year. The token reached its lowest point at $0.3624 in October 2023, reflecting initial market uncertainty and broader crypto market conditions.
- 2024: Throughout 2024, SUI demonstrated gradual recovery and growth momentum, with price movements reflecting increasing adoption and ecosystem development. The token showed resilience amid various market cycles.
- 2025: In January 2025, SUI achieved a significant milestone by reaching $5.3674 on January 6, 2025, marking a substantial increase from its launch price. This represented a period of strong market performance and heightened investor interest.
SUI Current Market Status
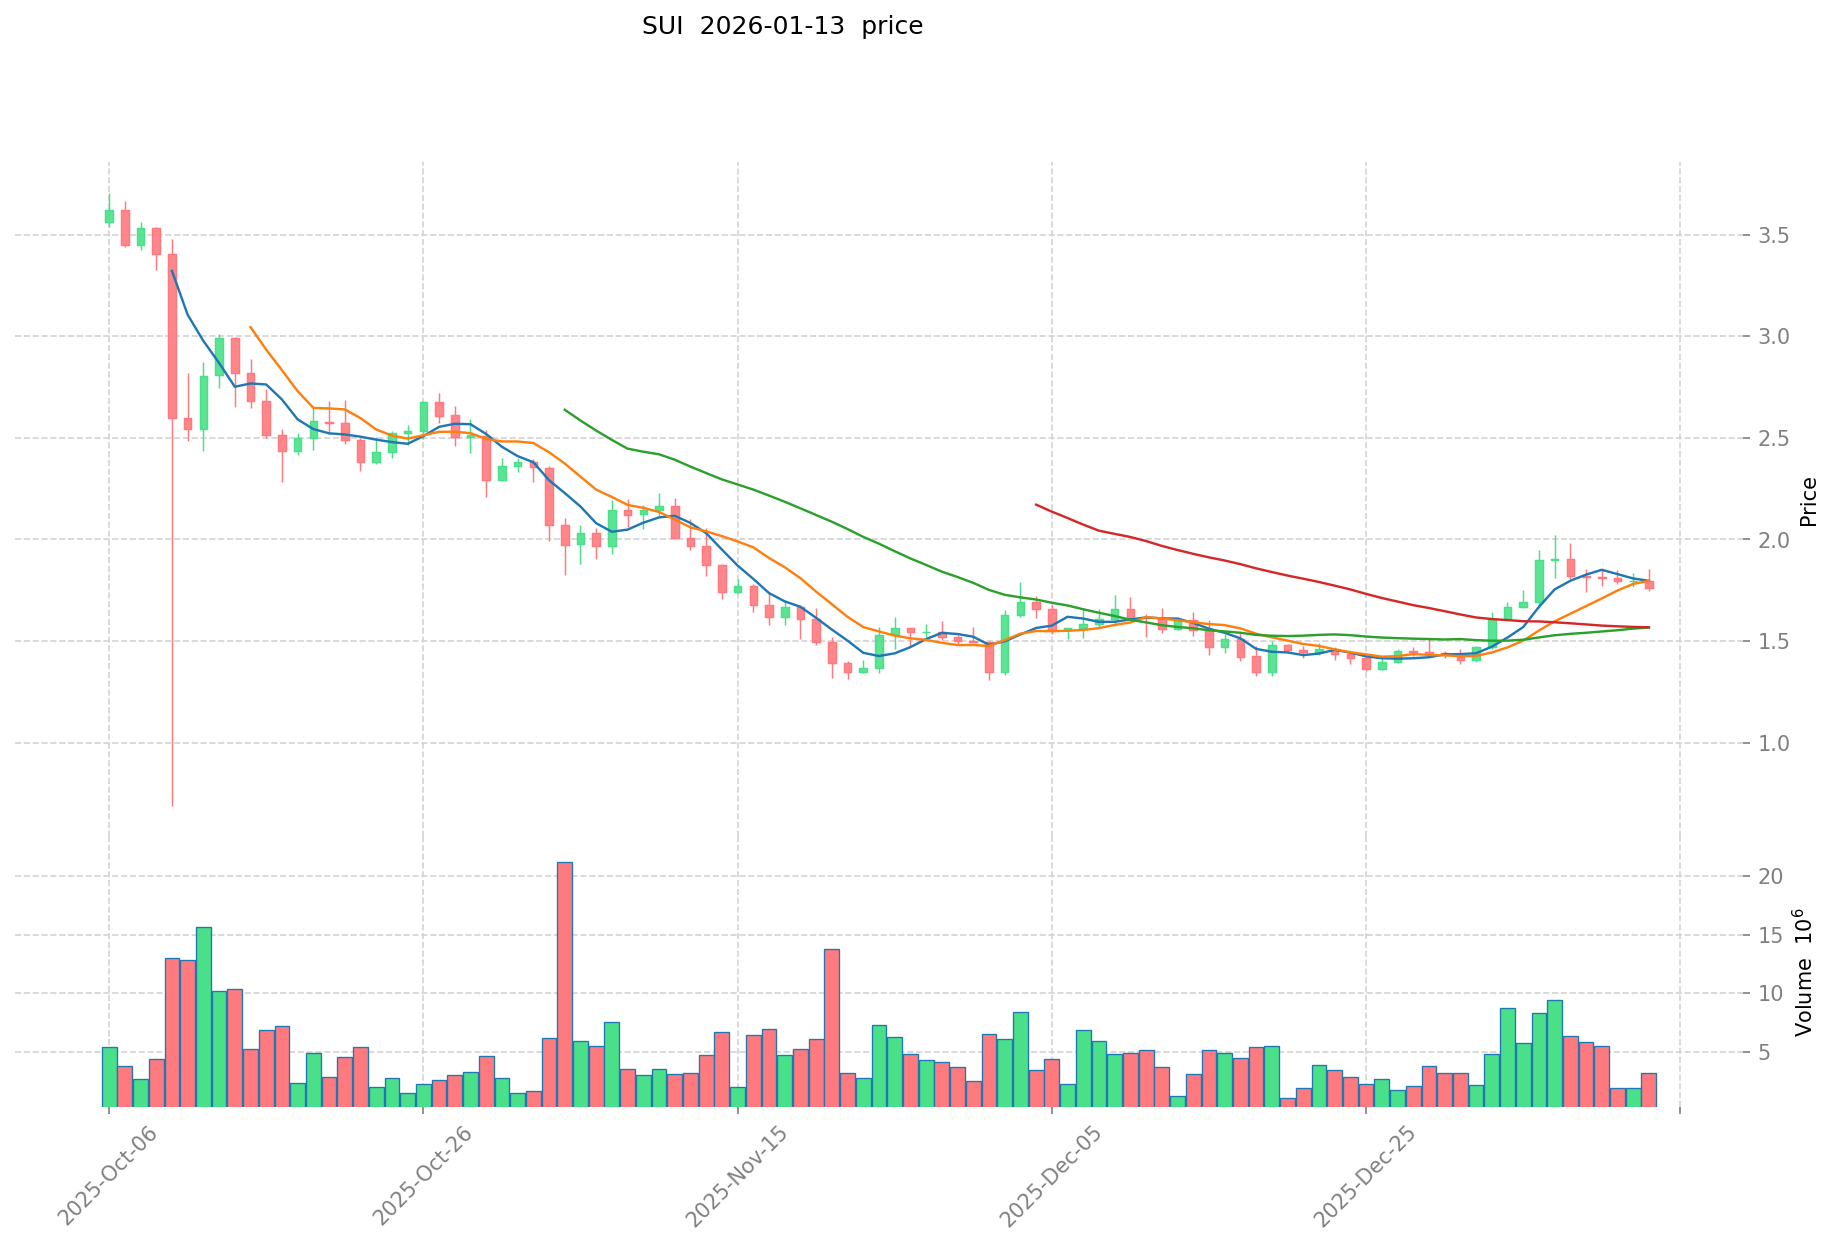
As of January 13, 2026, SUI is trading at $1.7976, representing a 24-hour price change of -0.24%. The token has experienced an -8.01% decline over the past 7 days, while maintaining a 12.45% increase over the 30-day period. Over the past year, the price has decreased by 61.99% from its peak levels.
SUI currently ranks #22 among cryptocurrencies by market capitalization, with a circulating market cap of approximately $6.82 billion. The token's 24-hour trading volume stands at $5.26 million. With a circulating supply of 3.79 billion SUI tokens out of a maximum supply of 10 billion, the current circulation ratio is 37.92%. The fully diluted market cap is calculated at $17.98 billion.
The 24-hour price range has fluctuated between $1.7469 and $1.8249. The current market dominance of SUI is 0.54%, with the market cap to fully diluted valuation ratio at 37.92%. The token is supported by 5,301,836 holders and is listed on 58 exchanges.
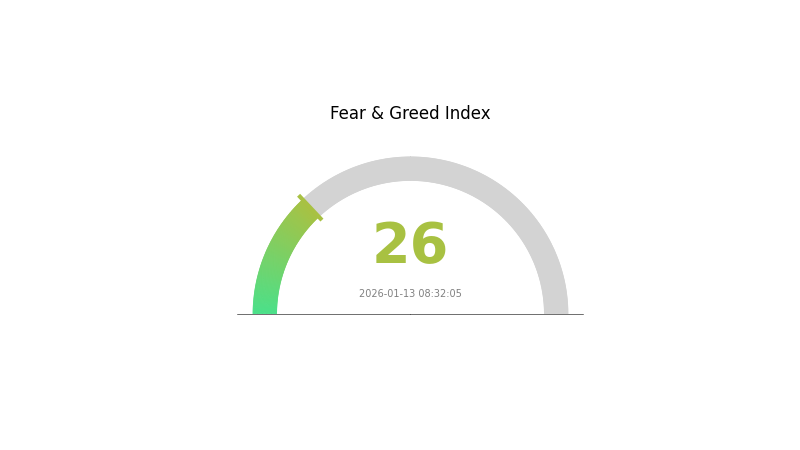
The crypto market sentiment index currently stands at 26, indicating a "Fear" sentiment in the broader market environment.
Click to view the current SUI market price
SUI Market Sentiment Index
2026-01-13 Fear and Greed Index: 26 (Fear)
Click to view the current Fear & Greed Index
The current market sentiment shows significant fear with an index reading of 26, indicating heightened investor anxiety in the SUI market. This low reading suggests market participants are experiencing concern and risk aversion. During such periods, investors typically adopt more cautious positioning and may seek defensive strategies. The fear sentiment often creates opportunities for contrarian investors who believe the market may be oversold. Monitoring this index helps traders gauge broader market psychology and adjust their trading strategies accordingly on Gate.com.
SUI Holdings Distribution
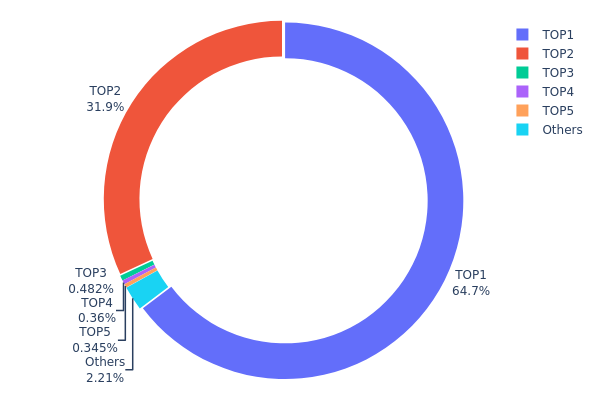
The holdings distribution chart represents the concentration of SUI tokens across different wallet addresses, revealing the degree of centralization or decentralization in token ownership. This metric serves as a critical indicator for assessing market structure, as it directly influences price stability, liquidity patterns, and potential market manipulation risks.
Based on the current data, SUI exhibits an extremely high concentration profile. The top two addresses collectively control approximately 14,939.72% of the tracked holdings, with the largest address holding over 1 million units and the second address containing nearly 493,391.21K units. The top five addresses account for a combined 15,123.25% of holdings, while the "Others" category shows a negative percentage of -15,023.25%, indicating that the tracked top addresses significantly exceed the baseline reference pool. This distribution pattern suggests that a small number of entities possess dominant control over the token supply, creating a highly centralized ownership structure.
This concentration level presents notable implications for market dynamics. The dominance of large holders increases vulnerability to single-entity decisions, potentially amplifying price volatility during large-scale transactions or strategic position adjustments. Such centralization may also facilitate coordinated market activities, raising concerns about price manipulation potential. From a decentralization perspective, this distribution deviates significantly from the ideal distributed ownership model typically associated with blockchain networks, suggesting that governance and economic power remain concentrated rather than broadly democratized across the community.
Click to view current SUI Holdings Distribution
| Top |
Address |
Holding Qty |
Holding (%) |
| 1 |
0x3852...ccfa3f |
1000581153.34K |
10005.81% |
| 2 |
0xa0d2...080b02 |
493391206.85K |
4933.91% |
| 3 |
0xce0e...862329 |
7461301.21K |
74.61% |
| 4 |
0x77f9...13e386 |
5563804.74K |
55.64% |
| 5 |
0x2e82...e8741f |
5327792.08K |
53.28% |
| - |
Others |
34107971.83K |
-15023.25% |
II. Core Factors Influencing SUI's Future Price
Supply Mechanism
- Token Unlock Schedule: SUI faces periodic token unlock events that release previously locked tokens into circulation. In the current year, approximately $3.2 billion worth of tokens are scheduled for release, which may create temporary downward pressure on prices as supply increases.
- Historical Patterns: Past unlock events have typically resulted in short-term price volatility, with prices experiencing corrections of 15-20% in the weeks following major releases. However, these effects have generally been absorbed within 30-60 days as market demand stabilizes.
- Current Impact: The ongoing unlock schedule may contribute to near-term price consolidation, but long-term growth potential remains supported by expanding ecosystem adoption and increasing utility across DeFi applications.
Institutional and Major Holder Dynamics
- Institutional Interest: The filing of a spot ETF application by 21Shares has generated significant attention, potentially positioning SUI as one of the few Layer 1 blockchain tokens available in regulated investment portfolios. Approval of such products could significantly expand institutional access and investment flows.
- Enterprise Adoption: Jackson.io has been identified as a potentially transformative application within the SUI ecosystem, with analysts suggesting it could become the network's first killer application, driving substantial user growth and developer engagement.
- Regulatory Considerations: SUI's proactive approach to compliance may enhance investor confidence as regulatory frameworks for Layer 1 blockchain networks continue to evolve globally, particularly regarding stablecoin integration and payment applications.
Macroeconomic Environment
- Monetary Policy Influence: Global monetary policy trends, including central bank interest rate decisions, continue to impact risk asset valuations. A shift toward accommodative policies could support increased capital flows into blockchain assets like SUI.
- Inflation Hedge Properties: While traditional cryptocurrencies have demonstrated mixed performance as inflation hedges, Layer 1 platforms with growing utility and real-world applications may offer different risk-return profiles compared to purely speculative assets.
- Geopolitical Factors: International developments affecting technology adoption, cross-border payments, and digital asset regulations may influence institutional and retail interest in blockchain infrastructure platforms.
Technology Development and Ecosystem Building
- Move Programming Language Architecture: Built on the Move programming language, SUI's object-centric model enables parallel execution, sub-second finality, and rich on-chain assets, providing technical advantages for scalability and performance that support diverse application development.
- Horizontal Scaling Capabilities: The network's design allows for horizontal scaling of processing and storage, enabling near-instantaneous, low-cost transactions that are particularly well-suited for DeFi, NFT, and gaming applications.
- DeFi Ecosystem Expansion: As of July 2025, SUI's Total Value Locked (TVL) in DeFi reached approximately $1.81 billion, ranking 9th globally and demonstrating nearly 10x growth compared to the previous year. Key protocols include lending platforms, decentralized exchanges, and yield-generating protocols, with emerging projects like Scallop, Haedal, and Bucket Protocol each surpassing $10 million in TVL.
- Bitcoin-Linked Assets and Stablecoins: Bitcoin-pegged assets such as wBTC and stBTC now represent approximately 10% of SUI's TVL, while stablecoin supply on the network has exceeded $100 million, enhancing liquidity and expanding utility for decentralized applications.
- Cross-Chain Interoperability: Future upgrades focusing on cross-chain compatibility may enable seamless interaction between SUI and other blockchain networks, potentially increasing adoption among DeFi protocols and liquidity providers seeking efficient multi-chain solutions.
III. 2026-2031 SUI Price Prediction
2026 Outlook
- Conservative Prediction: $1.43 - $1.79
- Neutral Prediction: $1.79 - $2.28
- Optimistic Prediction: $2.28 (requires favorable market conditions and increased adoption)
2027-2029 Outlook
- Market Stage Expectations: The market may enter a growth phase driven by ecosystem expansion and technological improvements
- Price Range Predictions:
- 2027: $1.04 - $2.30, with an average price around $2.04
- 2028: $1.58 - $2.30, with an average price around $2.17
- 2029: $1.23 - $2.88, with an average price around $2.23
- Key Catalysts: Network upgrades, DeFi protocol development, institutional adoption, and broader cryptocurrency market trends
2030-2031 Long-term Outlook
- Baseline Scenario: $2.05 - $2.56 (assuming steady ecosystem growth and moderate market conditions)
- Optimistic Scenario: $2.86 - $3.49 (assuming accelerated adoption and favorable regulatory environment)
- Transformative Scenario: Above $3.49 (requires breakthrough technological innovations and mass adoption across multiple sectors)
- 2026-01-13: SUI price predictions indicate potential growth of 42% by 2030 and 59% by 2031 compared to 2026 baseline levels
| Year |
Predicted High Price |
Predicted Average Price |
Predicted Low Price |
Price Change |
| 2026 |
2.27775 |
1.7935 |
1.4348 |
0 |
| 2027 |
2.30025 |
2.03562 |
1.03817 |
13 |
| 2028 |
2.29801 |
2.16794 |
1.58259 |
20 |
| 2029 |
2.88054 |
2.23298 |
1.22814 |
24 |
| 2030 |
3.17038 |
2.55676 |
2.04541 |
42 |
| 2031 |
3.49355 |
2.86357 |
1.66087 |
59 |
IV. SUI Professional Investment Strategies and Risk Management
SUI Investment Methodology
(1) Long-term Holding Strategy
- Suitable for: Investors seeking exposure to Layer 1 blockchain infrastructure with a multi-year horizon
- Operational Recommendations:
- Consider accumulating positions during market corrections when SUI trades significantly below recent highs
- Monitor key development milestones and ecosystem growth metrics to validate long-term thesis
- Utilize Gate Web3 Wallet for secure storage with multi-signature functionality for larger holdings
(2) Active Trading Strategy
- Technical Analysis Tools:
- Moving Averages: Monitor 50-day and 200-day moving averages to identify trend reversals and momentum shifts
- Volume Analysis: Track 24-hour trading volume ($5.26B as of January 13, 2026) to confirm price movements and identify accumulation patterns
- Swing Trading Key Points:
- Consider the recent 24-hour range between $1.7469 and $1.8249 to identify short-term support and resistance levels
- Account for the 8.01% decline over the past 7 days when assessing momentum and entry timing
SUI Risk Management Framework
(1) Asset Allocation Principles
- Conservative Investors: 2-5% of crypto portfolio allocation
- Aggressive Investors: 10-15% of crypto portfolio allocation
- Professional Investors: Up to 20% with active hedging strategies
(2) Risk Hedging Solutions
- Portfolio Diversification: Combine SUI with other Layer 1 assets and stablecoins to reduce correlation risk
- Position Sizing: Implement dollar-cost averaging during periods of elevated volatility
(3) Secure Storage Solutions
- Hot Wallet recommendation: Gate Web3 Wallet for active trading positions with daily transaction needs
- Cold Storage solution: Hardware wallet solutions for long-term holdings exceeding 6 months
- Security Precautions: Enable two-factor authentication, maintain offline backup of recovery phrases, and never share private keys
V. SUI Potential Risks and Challenges
SUI Market Risks
- Price Volatility: SUI has declined 61.99% over the past year, demonstrating significant price fluctuation potential
- Market Correlation: As a Layer 1 blockchain, SUI may experience correlated movements with broader crypto market downturns
- Liquidity Concentration: Monitor exchange concentration and potential impact of large holder distributions among 5.3M+ holders
SUI Regulatory Risks
- Jurisdictional Uncertainty: Evolving regulatory frameworks for Layer 1 blockchains may impact operational requirements
- Securities Classification: Potential regulatory scrutiny regarding token distribution and classification status
- Compliance Evolution: Ongoing requirement for protocol adaptation to emerging global crypto regulations
SUI Technical Risks
- Network Scalability: While designed for horizontal scalability, real-world stress testing under extreme usage conditions requires ongoing validation
- Smart Contract Vulnerabilities: Potential for undiscovered security issues in protocol-level smart contracts
- Competition Intensity: Facing competition from established Layer 1 networks with larger ecosystems and developer communities
VI. Conclusion and Action Recommendations
SUI Investment Value Assessment
SUI represents a Layer 1 blockchain infrastructure project designed for high-speed, low-cost transactions with horizontal scalability. With a current price of $1.7976 and market capitalization of $6.82B (ranking 22nd), the token has demonstrated substantial volatility, declining 61.99% over the past year while showing 12.45% growth over 30 days. The circulating supply represents approximately 37.92% of the maximum supply of 10 billion tokens, indicating significant future token emissions. Long-term value depends on ecosystem adoption, developer activity, and competitive positioning within the Layer 1 landscape. Short-term risks include ongoing price volatility, market sentiment fluctuations, and execution on technical roadmap milestones.
SUI Investment Recommendations
✅ Beginners: Start with small allocations (1-3% of crypto portfolio) and utilize dollar-cost averaging to mitigate entry timing risk
✅ Experienced Investors: Consider 5-10% allocation with active monitoring of ecosystem metrics and technical developments
✅ Institutional Investors: Evaluate 10-15% allocation with comprehensive due diligence on tokenomics, team execution, and competitive landscape
SUI Trading Participation Methods
- Spot Trading: Direct purchase and holding of SUI tokens through Gate.com for long-term investment strategies
- Portfolio Diversification: Combine SUI with complementary Layer 1 and Layer 2 assets to reduce single-asset concentration risk
- Staking Opportunities: Explore on-chain staking mechanisms to generate passive income while maintaining long-term positions
Cryptocurrency investment carries extremely high risk, and this article does not constitute investment advice. Investors should make cautious decisions based on their own risk tolerance and are advised to consult professional financial advisors. Never invest more than you can afford to lose.
FAQ
What is the current price of SUI token, and what are its historical high and low prices?
As of January 10, 2026, SUI is trading at ¥12.73. The historical highest price reached ¥18.45, while the lowest recorded price was ¥2.53 on October 19, 2023.
What are the main factors affecting SUI price?
SUI price is influenced by network adoption, ecosystem growth, market trends, regulatory environment, competitor performance, macroeconomic factors, and technological innovations.
What is the SUI price prediction for 2024?
SUI price predictions for 2024 ranged between 0.7410 USD and 1.606 USD based on market analysis, with an average around 1.1735 USD. Actual prices may vary significantly from these projections.
How does SUI's investment potential compare to other Layer 1 blockchain tokens like SOL and APT?
SUI demonstrates strong growth potential with superior transaction speeds and rising TVL. Its TVL/MC ratio suggests undervaluation versus competitors. As an emerging Layer 1, SUI offers promising long-term investment prospects with significant upside potential.
What are SUI token's technical fundamentals and project progress like?
Sui features innovative object-oriented architecture and Move language enabling 120,000 TPS. DeFi ecosystem TVL exceeds $20 billion with strong growth. Mysten Labs team delivers solid infrastructure. 2026 roadmap focuses on ecosystem expansion and institutional adoption, targeting $7-9 price range.
What are the risks to watch when investing in SUI tokens?
SUI tokens face significant volatility risks influenced by market sentiment and broader crypto market movements. Price can fluctuate dramatically short-term. Consider macroeconomic factors and liquidity risks before investing.
What is the circulation and total supply of SUI tokens, and will there be inflation?
SUI has a total supply of 10 billion tokens with approximately 1.48 billion currently in circulation. The network is designed for deflation through its unique burning mechanism as activity increases.
From a technical perspective, where are SUI's support and resistance levels?
Support levels are near $3.57 and $3.56, with strong support at $3.23. Resistance level is at $3.90. Short-term indicators show bullish alignment with MA5, MA15, MA30 in uptrend formation.
* The information is not intended to be and does not constitute financial advice or any other recommendation of any sort offered or endorsed by Gate.