This comprehensive guide analyzes Threshold (T), a privacy-focused infrastructure token trading at $0.010148 as of January 2026, with market cap of $113.2 million. The article examines T's price trajectory from 2026 through 2031, combining historical patterns, supply dynamics, and macroeconomic factors. It provides conservative and optimistic price forecasts, ranging from $0.00689 to $0.02622 by 2031. The analysis covers core market influences including institutional positioning, technology development, and ecosystem expansion. Detailed investment strategies cater to beginners, experienced traders, and institutional investors on Gate, complemented by comprehensive risk management frameworks and secure storage recommendations using Gate Web3 Wallet. The guide addresses regulatory risks, technical vulnerabilities, and liquidity constraints while evaluating T's long-term value proposition in privacy technology infrastructure.
Introduction: T's Market Position and Investment Value
Threshold (T), positioned as a privacy-focused infrastructure solution for public blockchain networks, has been making significant strides in the decentralized privacy sector since its launch in 2022 through the merger of NuCypher (NU) and Keep Network (KEEP). As of January 17, 2026, Threshold maintains a market capitalization of approximately $113.2 million, with a circulating supply of 11.155 billion tokens, trading at around $0.010148. This asset, recognized as a comprehensive privacy and cross-chain bridge solution, is playing an increasingly important role in areas such as proxy re-encryption (PRE), threshold signatures (TSS), distributed key generation (DKG), and random beacon services.
This article will comprehensively analyze T's price trajectory from 2026 through 2031, combining historical patterns, market supply-demand dynamics, ecosystem development, and macroeconomic conditions to provide investors with professional price forecasts and practical investment strategies.
I. T Price History Review and Market Status
T Historical Price Evolution Trajectory
- 2022: Threshold Network (T) token formed through the merger of NuCypher (NU) and Keep Network (KEEP) tokens with conversion ratios of 1 NU = 3.26 T and 1 KEEP = 4.78 T, reaching a notable price level of $0.226934 on March 2, 2022
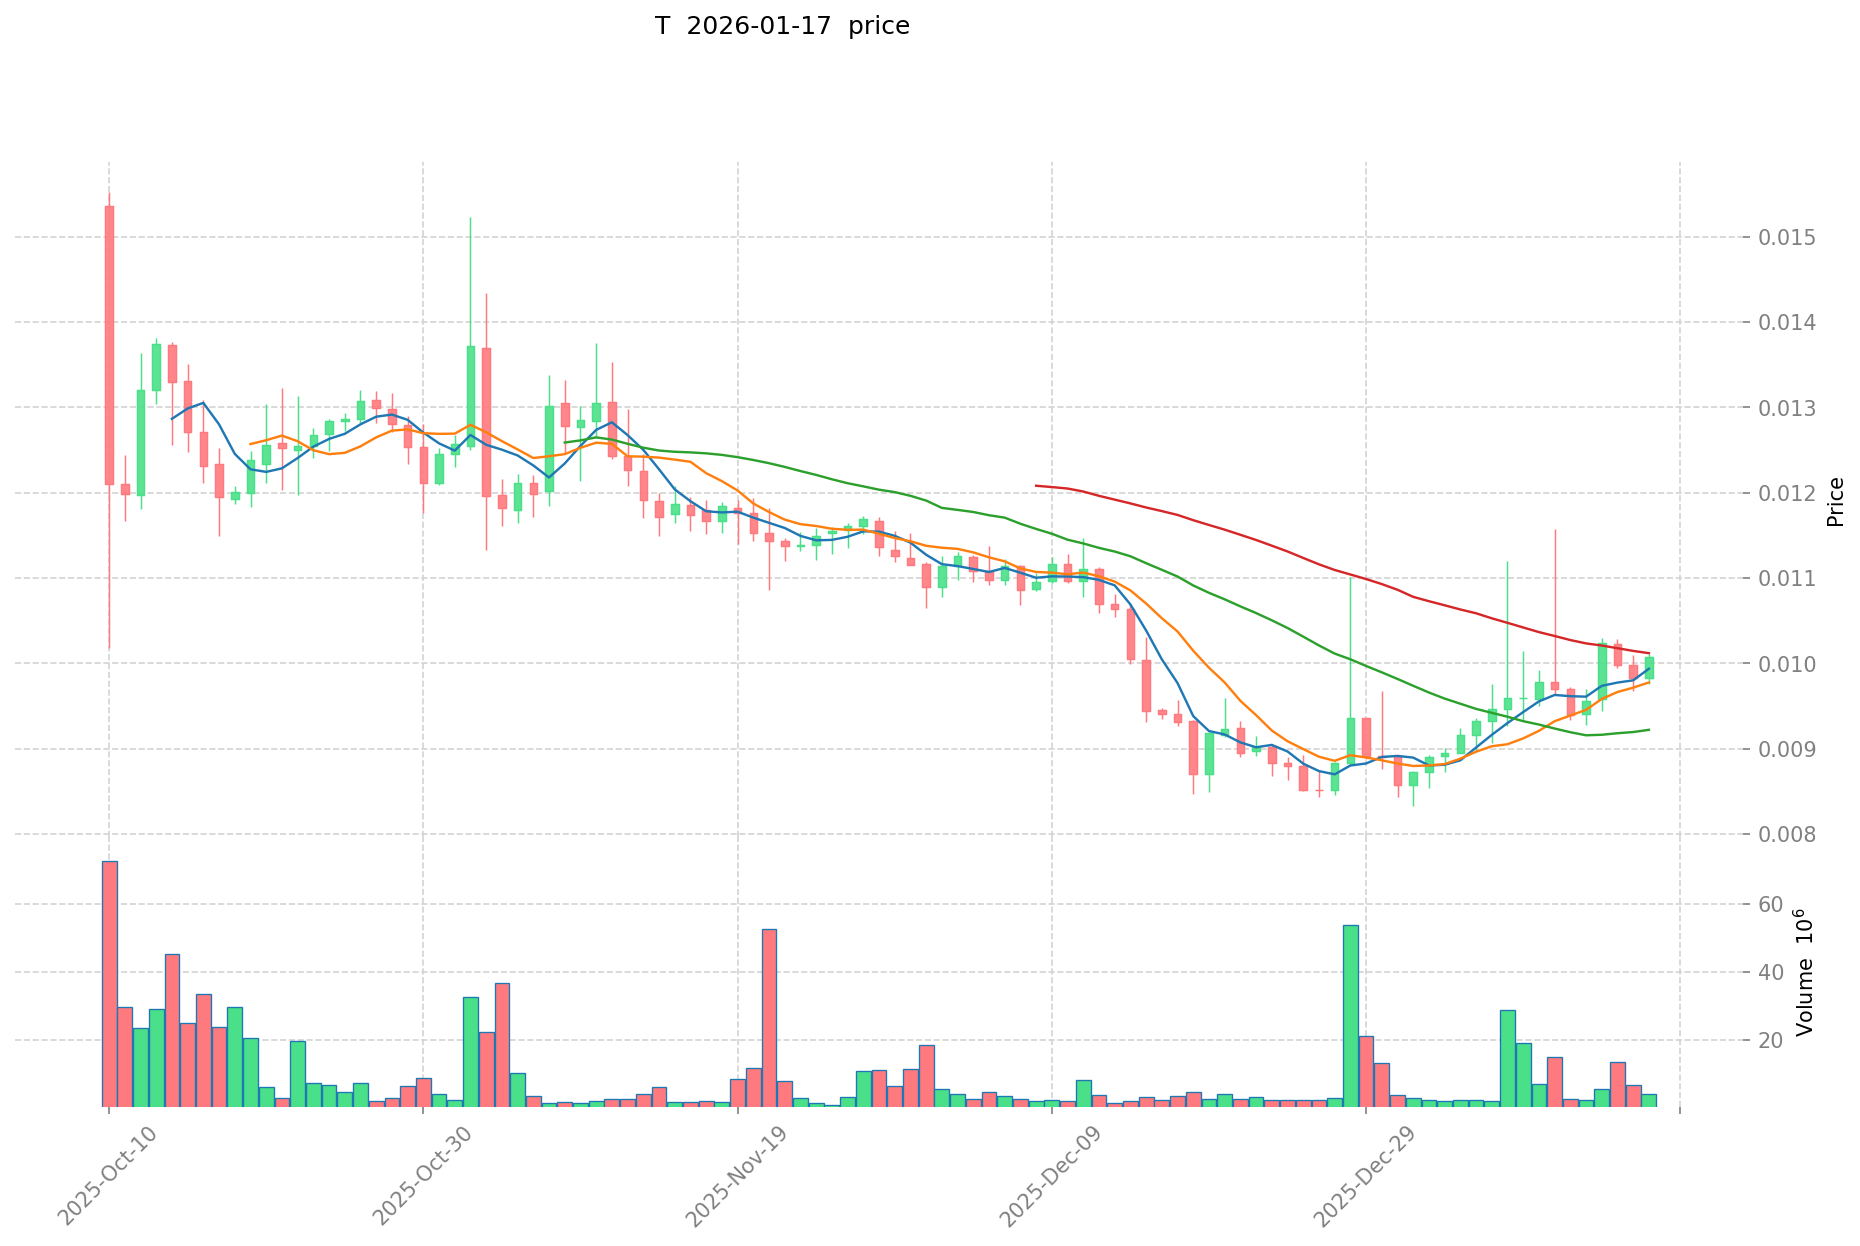
- 2026: Market experienced significant volatility, with price declining to $0.00833935 on January 1, 2026
T Current Market Status
As of January 17, 2026, Threshold (T) is trading at $0.010148, showing positive momentum across multiple timeframes. The token has demonstrated a 0.58% increase over the past hour, a 3.05% gain in the last 24 hours, and a 3.71% rise over the past week. The 30-day performance shows an 8.78% increase, indicating growing market interest in the short to medium term.
The 24-hour trading range spans from $0.009757 to $0.010182, with a total trading volume of $40,763.37. The market capitalization stands at $113,200,940, with a fully diluted valuation matching this figure, indicating that 100% of the maximum supply of 11,155,000,000 tokens is currently in circulation. The token holds a 0.0033% market dominance and ranks #338 in the cryptocurrency market.
Threshold is available for trading on 26 exchanges and has attracted 8,983 holders. The Gate.com sentiment indicator shows a neutral market emotion level of 50 (VIX), suggesting balanced market conditions. The token's smart contract is deployed on the Ethereum blockchain at address 0xcdf7028ceab81fa0c6971208e83fa7872994bee5.
Click to view current T market price
T Market Sentiment Index
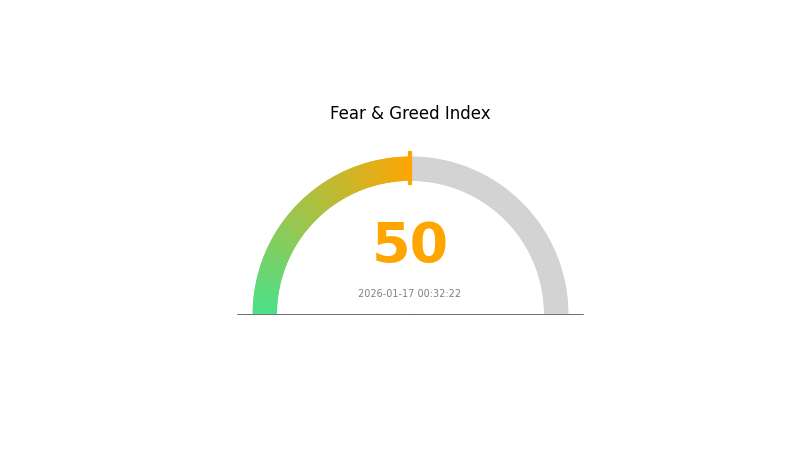
2026-01-17 Fear and Greed Index: 50 (Neutral)
Click to view current Fear & Greed Index
The cryptocurrency market is currently displaying a balanced emotional state with the Fear and Greed Index at 50, indicating neutrality. This midpoint reading suggests that market participants are neither excessively fearful nor overly greedy. Investors should maintain a measured approach, as the market remains in equilibrium without strong directional bias. Both bullish and bearish sentiments are equally represented, making it an opportune moment for thoughtful portfolio decisions on Gate.com.
T Holding Distribution
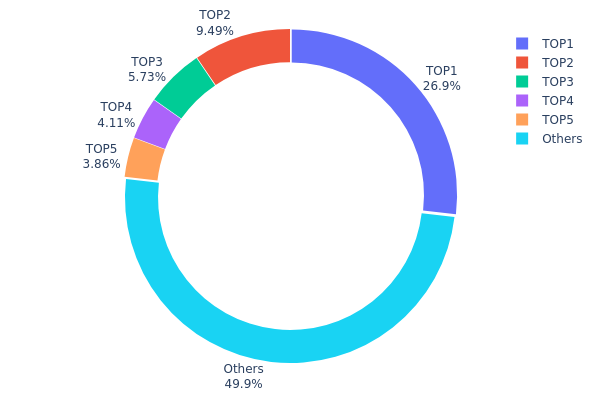
The holding distribution chart provides a visual representation of how T tokens are distributed across different wallet addresses on the blockchain. This metric serves as a crucial indicator of decentralization levels and potential concentration risks within the token's ecosystem. By analyzing the proportion of tokens held by top addresses versus the broader holder base, investors can assess the health of token distribution and identify potential centralization concerns that may impact market dynamics.
Based on the current data, T exhibits a moderately concentrated distribution pattern. The top address controls approximately 26.87% of the total supply (2.998M tokens), while the top five addresses collectively hold 49.96% of circulating tokens. This concentration level suggests a semi-centralized structure where major holders maintain significant influence over the token's market behavior. Notably, the remaining 50.04% is distributed among other addresses, indicating a relatively balanced distribution when compared to highly concentrated projects where top holders control over 70-80% of supply.
The current distribution structure presents both opportunities and risks for market participants. The substantial holdings by top addresses could introduce volatility risks, as large-scale sell-offs from these wallets may trigger significant price movements. However, the fact that nearly half the supply remains distributed among smaller holders suggests a developing community base that may provide stability during market fluctuations. This distribution pattern typically indicates a maturing project with growing adoption, though investors should remain vigilant regarding potential whale activity and its impact on price discovery mechanisms.
Click to view current T Holding Distribution
| Top |
Address |
Holding Qty |
Holding (%) |
| 1 |
0x9f01...dbd4ef |
2998164.92K |
26.87% |
| 2 |
0x593c...f15bb5 |
1058981.88K |
9.49% |
| 3 |
0x1cca...47680e |
639144.70K |
5.72% |
| 4 |
0xf668...e6908c |
457917.50K |
4.10% |
| 5 |
0xa79a...e6dd4c |
431045.38K |
3.86% |
| - |
Others |
5569745.62K |
49.96% |
II. Core Factors Influencing T's Future Price
Supply Mechanism
- Market Circulation Dynamics: The supply of T tokens follows a structured release schedule that directly impacts market availability. Historical patterns suggest that controlled supply mechanisms can help maintain price stability during periods of high demand.
- Historical Patterns: Past supply adjustments have shown correlation with price movements, particularly during periods of increased market activity. Phased release strategies have historically helped prevent excessive volatility.
- Current Impact: The current supply framework continues to play a role in price discovery, with market participants closely monitoring circulation metrics to assess potential price trajectories.
Institutional and Major Holder Dynamics
- Institutional Positioning: Major institutional participants have shown varying degrees of interest in digital assets, with positioning strategies evolving based on broader market conditions and regulatory developments.
- Corporate Adoption: Enterprise-level adoption of blockchain technologies continues to develop, with companies exploring applications across multiple sectors including finance, supply chain, and data management.
- Policy Framework: Regulatory approaches vary across jurisdictions, with some regions advancing clearer frameworks for digital asset classification and usage while others maintain more cautious stances.
Macroeconomic Environment
- Monetary Policy Impact: Central bank policies regarding interest rates and liquidity conditions influence risk asset valuations broadly. Changes in monetary stance can affect capital flows into digital assets as investors adjust portfolio allocations.
- Inflation Hedge Properties: Digital assets are sometimes considered as potential inflation hedges, though their actual effectiveness varies based on market conditions, adoption levels, and macroeconomic context.
- Geopolitical Factors: International relations and policy decisions can impact market sentiment toward digital assets, particularly regarding cross-border transactions and regulatory cooperation.
Technology Development and Ecosystem Building
- Infrastructure Enhancement: Ongoing improvements in blockchain infrastructure aim to address scalability, transaction speed, and energy efficiency concerns. These technical developments may influence long-term utility and adoption potential.
- Network Upgrades: Protocol improvements and consensus mechanism refinements continue to evolve, potentially affecting network performance and user experience over time.
- Ecosystem Applications: The development of decentralized applications and ecosystem projects contributes to utility expansion, though the pace and success of these initiatives vary significantly across different platforms and use cases.
III. 2026-2031 T Price Forecast
2026 Outlook
- Conservative forecast: $0.00689 - $0.01013
- Neutral forecast: $0.01013 (average scenario)
- Optimistic forecast: Up to $0.01338 (requires favorable market conditions and increased adoption)
2027-2029 Mid-term Outlook
- Market stage expectation: The token is anticipated to enter a gradual growth phase, with price volatility reflecting broader market sentiment and project development milestones
- Price range forecast:
- 2027: $0.0094 - $0.0134, with an average of $0.01176 (approximately 15% change from 2026)
- 2028: $0.00855 - $0.01748, with an average of $0.01258 (approximately 23% change from 2026)
- 2029: $0.01172 - $0.02225, with an average of $0.01503 (approximately 48% change from 2026)
- Key catalysts: Project ecosystem expansion, increased user adoption, potential partnerships, and overall cryptocurrency market recovery could drive price appreciation during this period
2030-2031 Long-term Outlook
- Baseline scenario: $0.01696 - $0.0205 in 2030 (assuming steady ecosystem development and sustained market interest, approximately 83% change from 2026)
- Optimistic scenario: $0.01566 - $0.02622 by 2031 (contingent on significant technological breakthroughs, widespread adoption, and favorable regulatory environment, approximately 92% change from 2026)
- Transformative scenario: Potential to reach the upper range of $0.02622 (requires exceptional market conditions, major platform integrations, and substantial ecosystem growth)
- 2026-01-17: T shows potential for multi-year growth trajectory, with forecasts suggesting progressive value appreciation through 2031
| Year |
Predicted High Price |
Predicted Average Price |
Predicted Low Price |
Price Change |
| 2026 |
0.01338 |
0.01013 |
0.00689 |
0 |
| 2027 |
0.0134 |
0.01176 |
0.0094 |
15 |
| 2028 |
0.01748 |
0.01258 |
0.00855 |
23 |
| 2029 |
0.02225 |
0.01503 |
0.01172 |
48 |
| 2030 |
0.0205 |
0.01864 |
0.01696 |
83 |
| 2031 |
0.02622 |
0.01957 |
0.01566 |
92 |
IV. T Professional Investment Strategy and Risk Management
T Investment Methodology
(1) Long-term Holding Strategy
- Suitable for: Investors seeking privacy-focused blockchain solutions with long-term value proposition
- Operational Recommendations:
- Consider accumulating positions during market corrections when the token trades near support levels
- Monitor developments in the privacy technology sector and Threshold's cryptographic infrastructure updates
- Secure Storage Solution: Use Gate Web3 Wallet for custody with multi-signature protection enabled
(2) Active Trading Strategy
- Technical Analysis Tools:
- Moving Averages: Apply 50-day and 200-day moving averages to identify trend reversals and momentum shifts
- Volume Analysis: Monitor 24-hour trading volume (currently $40,763) relative to historical averages to confirm breakout validity
- Swing Trading Key Points:
- Identify support zones near recent lows around $0.00976 and resistance near $0.01018
- Consider profit-taking strategies when approaching historical resistance levels while maintaining core positions
T Risk Management Framework
(1) Asset Allocation Principles
- Conservative Investors: 1-3% of crypto portfolio
- Aggressive Investors: 5-8% of crypto portfolio
- Professional Investors: Up to 10% with active hedging strategies
(2) Risk Hedging Solutions
- Diversification Strategy: Balance T holdings with established privacy coins and infrastructure tokens
- Position Sizing: Use dollar-cost averaging to mitigate volatility risk given the token's relatively small market cap of $113.2 million
(3) Secure Storage Solutions
- Hot Wallet Recommendation: Gate Web3 Wallet for active trading positions and frequent transactions
- Cold Storage Solution: Hardware wallet storage for long-term holdings exceeding 5% of total portfolio value
- Security Considerations: Implement two-factor authentication, regularly update wallet software, and never share private keys or seed phrases
V. T Potential Risks and Challenges
T Market Risks
- Volatility Exposure: T has experienced significant price fluctuations, with a 66.09% decline over the past year, indicating substantial downside risk
- Liquidity Constraints: With a market cap of $113.2 million and market dominance of only 0.0033%, large position exits may impact price significantly
- Competitive Pressure: The privacy technology sector faces intense competition from established protocols, potentially limiting market share growth
T Regulatory Risks
- Privacy Technology Scrutiny: Increased regulatory attention on privacy-enhancing technologies may create compliance challenges
- Cross-border Operations: Threshold's cross-chain bridge functionality may face regulatory uncertainty across different jurisdictions
- Token Classification: Potential changes in regulatory classification of utility tokens could affect market access and trading capabilities
T Technical Risks
- Smart Contract Vulnerabilities: The token operates on Ethereum (contract address: 0xcdf7028ceab81fa0c6971208e83fa7872994bee5), exposing it to potential smart contract exploits
- Network Dependencies: Reliance on Ethereum infrastructure means T is subject to base layer congestion and gas fee fluctuations
- Cryptographic Security: While Threshold provides advanced cryptographic tools (PRE, TSS, DKG, RB), any vulnerabilities in these systems could undermine user confidence
VI. Conclusion and Action Recommendations
T Investment Value Assessment
Threshold presents a specialized value proposition in the privacy infrastructure space, offering cryptographic building blocks for data protection and cross-chain functionality. The token's merger origins from NuCypher and Keep Network provide established technical foundations. However, the significant year-over-year decline of 66.09% and relatively small market presence indicate heightened risk. Short-term volatility remains elevated, while long-term value depends on adoption of privacy solutions and successful execution of the network's roadmap. The current market cap of $113.2 million suggests potential upside if privacy technology gains mainstream adoption, though investors should weigh this against substantial downside risk.
T Investment Recommendations
✅ Beginners: Allocate no more than 1-2% of crypto portfolio to T, focusing on education about privacy technologies before increasing exposure. Use Gate Web3 Wallet for secure storage and start with small positions to understand price behavior.
✅ Experienced Investors: Consider T as a speculative allocation of 3-5% within a diversified privacy technology portfolio. Implement stop-loss orders and actively monitor technical indicators given the token's volatility profile.
✅ Institutional Investors: Evaluate T as part of a thematic privacy infrastructure basket with appropriate hedging mechanisms. Conduct thorough due diligence on network governance, technology roadmap, and competitive positioning before establishing positions.
T Trading Participation Methods
- Spot Trading: Execute buy and sell orders on Gate.com spot markets to participate in price movements with full asset ownership
- Dollar-Cost Averaging: Establish regular purchase schedules to mitigate timing risk and smooth entry prices over market cycles
- Portfolio Integration: Combine T with complementary infrastructure tokens to create a balanced privacy technology exposure strategy
Cryptocurrency investment carries extreme risk, and this article does not constitute investment advice. Investors should make prudent decisions based on their risk tolerance and are advised to consult professional financial advisors. Never invest more than you can afford to lose.
FAQ
What factors influence T price predictions and forecasts?
T price predictions are influenced by market demand, trading volume, tokenomics, blockchain adoption rates, regulatory developments, macroeconomic conditions, and community sentiment.
The most reliable methods include technical analysis using RSI, MACD, and moving averages to identify trend strength. Monitor trading volume, market sentiment indicators, and on-chain metrics. Combine multiple tools for better accuracy in predicting T price movements.
What are the risks and limitations of T price prediction models?
T price prediction models face challenges with market volatility and incomplete data. They may struggle to capture sudden market shifts, regulatory changes, and external events. Historical patterns don't always predict future performance, potentially leading to prediction errors and financial losses.
How do historical price trends help in making accurate T price predictions?
Historical price trends identify recurring patterns and market behaviors that influence future price movements. By analyzing past data, traders can recognize support and resistance levels, trend cycles, and trading volume changes. These insights improve forecasting accuracy and help predict T's potential price direction based on established market dynamics.
* The information is not intended to be and does not constitute financial advice or any other recommendation of any sort offered or endorsed by Gate.