"2025 TA Price Prediction: Expert Analysis and Market Forecast" offers a detailed investigation into Trusta.AI's (TA) price movement, market positioning, and investment value within the AI and crypto sectors. It examines TA's historical price trends and current market conditions, including sentiment indices and holding distributions, to guide investors in understanding potential price dynamics influenced by market sentiment and supply-demand factors. The article provides comprehensive price forecasts for 2025-2030 and outlines strategic investment approaches and risk management methods. It targets investors interested in AI and Web3 ecosystems, delivering critical insights and actionable strategies on Gate.
Introduction: TA's Market Position and Investment Value
Trusta.AI (TA) is a trusted identity network project designed for the artificial intelligence and cryptocurrency era, establishing a universal credit system for all forms of intelligence—both human and artificial. Since its launch in December 2024, the project has quickly gained market recognition. As of December 2025, TA has achieved a market capitalization of $3.46 million with a circulating supply of 180 million tokens, currently trading at approximately $0.01922. This innovative asset is playing an increasingly vital role in bridging the gap between AI authentication and blockchain infrastructure.
This article will conduct a comprehensive analysis of TA's price trajectory throughout 2025 and beyond, integrating historical price patterns, market supply and demand dynamics, ecosystem development, and macroeconomic factors to provide investors with professional price forecasts and practical investment strategies.
Trusta.AI (TA) Market Analysis Report
I. TA Price History Review and Current Market Status
TA Historical Price Trajectory
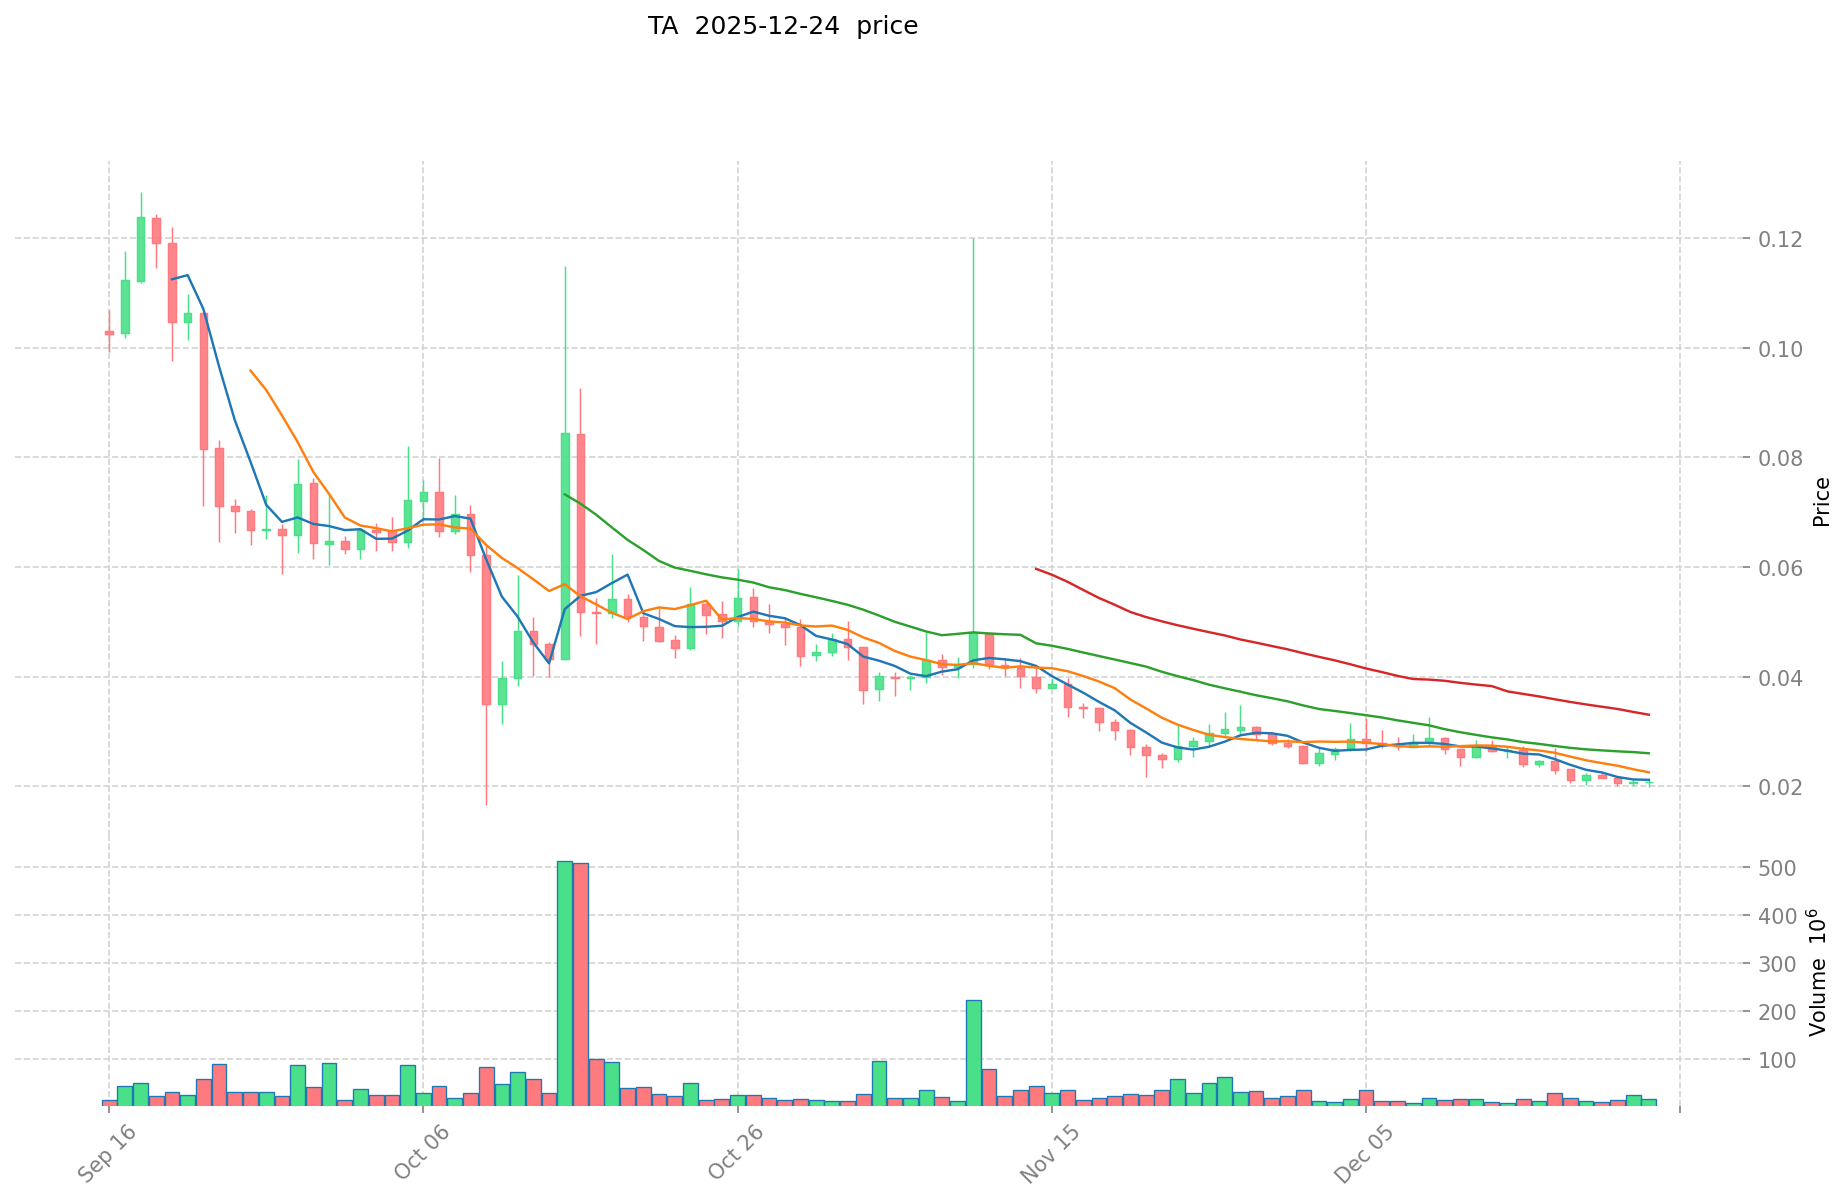
Based on available data, Trusta.AI (TA) has demonstrated the following price dynamics:
- September 2, 2025: All-time high (ATH) reached at $0.3854, representing peak market enthusiasm for the project
- October 10, 2025: All-time low (ATL) recorded at $0.01652, marking the lowest valuation point in the token's history
- December 24, 2025: Current trading at $0.01922, reflecting continued downward pressure from the ATH
TA Current Market Status
As of December 24, 2025, Trusta.AI is trading at $0.01922, with a 24-hour trading volume of $376,269.13. The token has experienced significant bearish momentum across multiple timeframes:
- 1-hour change: -0.21%
- 24-hour change: -6.48%
- 7-day change: -23.61%
- 30-day change: -27.33%
The current market capitalization stands at approximately $3,459,600, with a fully diluted valuation of $19,220,000. The circulating supply comprises 180,000,000 TA tokens out of a total supply of 1,000,000,000, representing an 18% circulation ratio.
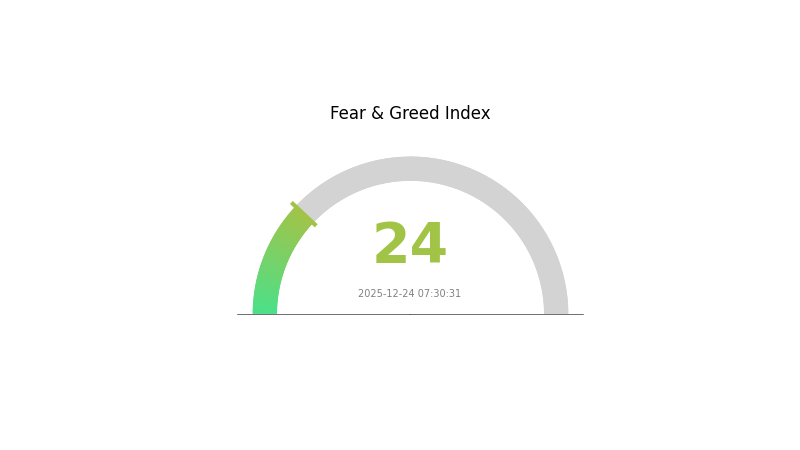
With 2,972 token holders and a market dominance of 0.00061%, TA maintains a relatively modest position in the broader cryptocurrency ecosystem. The project ranks #1,766 globally by market capitalization. Market sentiment indicators show "Extreme Fear" (VIX: 24), reflecting broader market anxiety that may be influencing TA's price performance.
The token has depreciated approximately 92% from its all-time high of $0.3854, indicating substantial correction from peak valuations. This decline occurred within a three-month window, reflecting considerable volatility characteristic of emerging AI and blockchain projects.
Click to view current TA market price
TA Market Sentiment Index
2025-12-24 Fear and Greed Index: 24 (Extreme Fear)
Click to view current Fear & Greed Index
The crypto market is experiencing extreme fear with an index reading of 24. Such low readings typically indicate significant market pessimism and heightened risk aversion among investors. During periods of extreme fear, market volatility tends to increase substantially, creating both increased risks and potential opportunities for contrarian investors. Market participants should exercise caution and implement proper risk management strategies. This sentiment suggests markets may be oversold, but investors should wait for stabilization signals before making major positioning decisions. Monitor key support levels and market developments closely during this volatile period.
TA Holdings Distribution
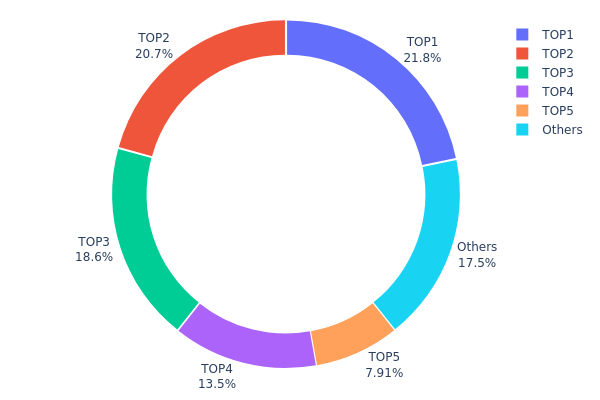
The address holdings distribution map illustrates the concentration of token ownership across the top wallet addresses, providing critical insight into the decentralization status and potential market manipulation risks within the ecosystem. This metric tracks how tokens are distributed among major holders, revealing whether ownership is widely dispersed or concentrated among a small number of entities.
The current data reveals a moderately concentrated holding structure, with the top five addresses collectively controlling approximately 82.48% of total supply. The largest holder (0x9581...88e952) commands 21.78% of tokens, followed closely by the second address at 20.74%, while the third address holds 18.58%. This distribution pattern indicates significant concentration risk, as these top-tier holders possess sufficient capital to substantially influence market dynamics. The remaining 17.52% distributed among other addresses suggests a fragmented retail base, which contrasts sharply with the consolidated position of major stakeholders.
This concentration level raises considerations regarding market structure stability and price volatility potential. While the top four addresses each hold above 13% of supply individually, their combined influence creates a bifurcated market where whale activity could catalyze substantial price movements. The moderate dispersion among remaining holders, however, provides some degree of counterbalance to prevent absolute centralization. The current holdings distribution reflects a market structure typical of developing tokens transitioning from early concentrated phases toward broader distribution, though continued monitoring of these major positions remains essential for assessing decentralization trajectory and long-term ecosystem health.
Click to view current TA Holdings Distribution
| Top |
Address |
Holding Qty |
Holding (%) |
| 1 |
0x9581...88e952 |
210000.00K |
21.78% |
| 2 |
0xc413...740d97 |
200000.00K |
20.74% |
| 3 |
0x1b9d...261821 |
179166.67K |
18.58% |
| 4 |
0x6148...882ec0 |
130000.00K |
13.48% |
| 5 |
0xf89d...5eaa40 |
76229.61K |
7.90% |
| - |
Others |
168708.37K |
17.52% |
II. Core Factors Affecting TA's Future Price
Market Sentiment and Speculation
-
Investor Psychology: Market sentiment plays a crucial role in driving price movements, with fear and greed being the two primary emotions driving trading behavior. Price movements are often influenced by speculation rather than fundamental utility, particularly in volatile crypto markets.
-
FOMO and Panic Selling: Fear of missing out (FOMO) can cause speculators to enter the market en masse during uptrends, pushing prices higher. Conversely, panic selling triggered by negative news or market downturns can cause sharp price declines. Both behaviors significantly amplify price volatility.
-
Media and News Impact: Media coverage and news announcements regarding regulations, technological advances, or prominent investments can substantially influence public opinion and speculative behavior, triggering widespread buying or selling activity.
Supply-Demand Dynamics
-
Market Supply and Demand: Cryptocurrency prices are fundamentally determined by market supply and demand relationships. The core principle of technical analysis assumes that all known information is already reflected in asset prices, and price trends tend to repeat over time as supply and demand forces interact.
-
Inelastic Supply Effects: When supply is fixed or highly inelastic, any change in demand is reflected entirely through price adjustments. This characteristic is particularly important for cryptocurrencies with fixed maximum supplies.
Macroeconomic Environment
-
Economic Instability Impact: Broader economic conditions such as inflation rates, currency fluctuations, and economic policies influence crypto markets. Economic instability often increases interest in cryptocurrencies as alternative investments compared to traditional assets.
-
Leverage and Margin Trading: Many speculators engage in leveraged trading by borrowing funds to amplify their positions. While this can increase profits during favorable market movements, it also amplifies price volatility during adverse price movements, creating larger market swings.
Three、2025-2030 Price Forecast
2025 Outlook
- Conservative Forecast: $0.01479 - $0.01921
- Neutral Forecast: $0.01921 - $0.02805
- Bullish Forecast: $0.02805 (requires sustained market momentum and positive ecosystem developments)
2026-2028 Medium-term Outlook
- Market Stage Expectation: Gradual recovery and consolidation phase with incremental growth trajectory
- Price Range Predictions:
- 2026: $0.01323 - $0.02859 (22% upside potential)
- 2027: $0.01697 - $0.02768 (35% upside potential)
- 2028: $0.02044 - $0.03765 (39% upside potential)
- Key Catalysts: Increased institutional adoption, technological upgrades, expanding use case applications, and overall cryptocurrency market maturation
2029-2030 Long-term Outlook
- Base Case Scenario: $0.02646 - $0.04163 (67% upside by 2029, assuming stable market conditions and moderate adoption growth)
- Bullish Scenario: $0.02550 - $0.04212 (92% upside by 2030, contingent upon accelerated ecosystem expansion and mainstream integration)
- Transformative Scenario: $0.04212+ (assumes breakthrough regulatory clarity, major partnership announcements, and significant market inflection)
- 2030-12-31: Asset demonstrates sustained upward trajectory with strengthened market positioning and fundamentals
| 年份 |
预测最高价 |
预测平均价格 |
预测最低价 |
涨跌幅 |
| 2025 |
0.02805 |
0.01921 |
0.01479 |
0 |
| 2026 |
0.02859 |
0.02363 |
0.01323 |
22 |
| 2027 |
0.02768 |
0.02611 |
0.01697 |
35 |
| 2028 |
0.03765 |
0.02689 |
0.02044 |
39 |
| 2029 |
0.04163 |
0.03227 |
0.02646 |
67 |
| 2030 |
0.04212 |
0.03695 |
0.0255 |
92 |
Trusta.AI (TA) Professional Investment Strategy and Risk Management Report
IV. TA Professional Investment Strategy and Risk Management
TA Investment Methodology
(1) Long-term Holding Strategy
-
Target Audience: Investors who believe in the long-term potential of AI-based identity and credit systems; those seeking exposure to emerging Web3 infrastructure projects.
-
Operation Recommendations:
- Dollar-cost averaging (DCA): Allocate fixed amounts at regular intervals to reduce the impact of price volatility, given TA's current -27.33% 30-day performance.
- Portfolio rebalancing: Periodically review your allocation to ensure TA remains within your target risk parameters, especially considering the token's 180M circulating supply against 1B total supply.
- Accumulation during downturns: Consider accumulating during periods of market weakness, as the token is currently trading near its all-time low of $0.01652 (set on October 10, 2025).
-
Storage Solution: Utilize Gate.com Web3 Wallet for secure, non-custodial storage of TA tokens across supported chains (BSC and Linea), enabling direct participation in ecosystem developments.
(2) Active Trading Strategy
TA Risk Management Framework
(1) Asset Allocation Principles
- Conservative Investors: 1-3% portfolio allocation
- Active Investors: 3-7% portfolio allocation
- Professional/Institutional Investors: Up to 10% allocation with hedging mechanisms
(2) Risk Hedging Solutions
- Portfolio Diversification: Balance TA holdings with established cryptocurrencies to mitigate concentration risk, particularly given TA's early-stage status and 0.00061% market dominance.
- Position Sizing: Limit individual trade size to maintain flexibility and reduce forced liquidation risk during high volatility periods.
(3) Secure Storage Solutions
- Hardware Alternative Notice: For large holdings, consider professional custody solutions with institutional-grade security infrastructure.
- Hot Wallet Safety: Use Gate.com Web3 Wallet with enabled two-factor authentication and IP whitelisting to protect against unauthorized access.
- Critical Security Measures: Never share private keys or recovery phrases; use multi-signature wallets for holdings exceeding $50,000; keep seed phrases offline in secure, redundant locations; verify contract addresses ($0x539ae81a166e5e80aed211731563e549c411b140) on official channels before interacting.
V. TA Potential Risks and Challenges
TA Market Risk
- Liquidity Risk: With only 1 exchange listing and 376,269 TA daily volume, the token faces significant liquidity constraints that could result in high slippage during large transactions.
- Price Volatility: The -27.33% 30-day decline and current positioning near all-time lows indicate extreme price volatility unsuitable for risk-averse investors.
- Early-Stage Project Risk: As a project ranked 1766 by market cap ($19.22M) with only 2,972 token holders, TA faces typical early-stage dilution and concentration risks.
TA Regulatory Risk
- Jurisdiction Uncertainty: AI-powered identity and credit systems may face evolving regulatory scrutiny as governments establish frameworks for AI governance and data privacy.
- Compliance Framework Gaps: The nascent regulatory environment for Web3-based identity infrastructure creates potential compliance challenges.
- Cross-Border Restrictions: Certain jurisdictions may restrict or prohibit participation in AI-integrated financial systems.
TA Technology Risk
- Smart Contract Vulnerabilities: Audited status and code security details are not publicly specified; potential bugs could result in fund loss or system failure.
- Network Risk: Operating across BSC and Linea creates multi-chain operational complexity and potential compatibility issues.
- Scalability Concerns: Limited documentation on throughput capacity and performance optimization for enterprise-scale identity verification.
VI. Conclusions and Action Recommendations
TA Investment Value Assessment
Trusta.AI presents a high-risk, speculative opportunity aligned with the growing intersection of AI and Web3 infrastructure. The project's vision of creating a universal credit system for human and artificial intelligence addresses a significant market gap. However, substantial challenges remain: extreme illiquidity, concentrated holder base, significant recent price deterioration (-27.33% in 30 days), and operational execution risks. The 18% market cap-to-fully diluted valuation ratio suggests moderate near-term dilution risk. The current price near all-time lows presents potential accumulation opportunities for conviction investors, but only as a small portfolio allocation.
TA Investment Recommendations
✅ Beginners: Limit exposure to 1-2% of portfolio through dollar-cost averaging purchases on Gate.com over 6-12 months; prioritize understanding the project whitepaper and ecosystem before investing.
✅ Experienced Investors: Consider 3-5% allocations with established swing trading strategies; use technical analysis to identify optimal entry points near support levels; maintain strict stop-loss discipline.
✅ Institutional Investors: Evaluate 5-10% allocations only after comprehensive due diligence on team credentials, technical audits, and partnership maturity; negotiate OTC pricing for large positions to minimize market impact.
TA Trading Participation Methods
- Spot Trading on Gate.com: Direct purchase and sale of TA tokens with competitive spreads; suitable for position building and long-term accumulation strategies.
- Limit Orders: Set predetermined buy orders at support levels to execute trades automatically during price dips, reducing emotional decision-making.
- Portfolio Tracking: Monitor TA performance through Gate.com portfolio tools; rebalance quarterly based on allocation targets and market developments.
Cryptocurrency investment carries extreme risk. This report does not constitute investment advice. Investors must make decisions based on personal risk tolerance and financial circumstances. Consult qualified financial advisors before investing. Never invest funds you cannot afford to lose completely.
FAQ
Will Tao reach 10,000?
Yes, Tao could potentially reach $10,000 if it gains stronger institutional adoption and expands into emerging markets like Asia. With sustained network growth and subnets development, this target appears achievable within the next 5 years.
What factors influence Tao price prediction?
Tao price is influenced by Bittensor network utility and adoption, demand from AI developers, overall market sentiment for AI crypto projects, technological advancements in the ecosystem, and tokenomics dynamics.
What is the current market cap and circulating supply of Tao?
As of December 24, 2025, Tao's market cap is $4.04 billion. The circulating supply information is not currently available in our data sources.
What are the risks and opportunities for Tao token investment?
Tao token offers opportunities in AI infrastructure growth and decentralized compute networks. Risks include market volatility, regulatory uncertainty, and competition. Consider diversification and long-term potential in emerging AI sector development.
Tao stands out with stronger fundamentals through decentralized AI infrastructure. Its price potential appears higher than competitors due to unique subnet architecture, growing adoption, and superior transaction volume metrics compared to other AI tokens.
Bittensor (TAO) has experienced fluctuating price movements historically. Analysts predict TAO could reach $1,338.94 by 2030. As a decentralized AI network protocol, TAO's long-term potential is driven by growing interest in democratized machine learning development.
* The information is not intended to be and does not constitute financial advice or any other recommendation of any sort offered or endorsed by Gate.