This comprehensive guide analyzes Tellor (TRB) token's market position and investment potential through 2031. Currently trading at $22.59 with a $62.15 million market cap, TRB serves as a decentralized oracle network on Ethereum, bridging blockchain and real-world data for DeFi applications. The article examines TRB's price history, recent market status, and key factors driving valuation including technology development, market demand, regulatory environment, and macroeconomic trends. Professional price forecasts range from $16.47-$32.71 in 2026 to $26.62-$39.62 by 2031, depending on ecosystem adoption and market conditions. Investment strategies cover long-term holding and active trading approaches with risk management frameworks. The analysis addresses market volatility, competition risks, and regulatory uncertainties while providing actionable recommendations for beginners, experienced investors, and institutions on Gate trading platform.
Introduction: TRB's Market Position and Investment Value
Tellor (TRB), as a decentralized oracle network platform designed to integrate high-value off-chain data into Ethereum, has been developing its ecosystem since its launch in 2019. As of 2026, Tellor maintains a market capitalization of approximately $62.15 million, with a circulating supply of about 2.75 million tokens, and the price stabilizes around $22.59. This asset, serving as a bridge between blockchain and real-world data, is playing an increasingly important role in the DeFi and smart contract ecosystems.
This article will comprehensively analyze TRB's price trends from 2026 to 2031, combining historical patterns, market supply and demand dynamics, ecosystem development, and macroeconomic environment factors to provide investors with professional price forecasts and practical investment strategies.
I. TRB Price History Review and Market Status
TRB Historical Price Evolution Trajectory
- 2019: Tellor launched on Ethereum mainnet in November with initial trading beginning. The token recorded its all-time low of $0.01001379 during this period
- 2024: Significant price surge occurred, reaching an all-time high of $593.09 on January 1st, marking a substantial milestone in the token's valuation history
- 2025-2026: Following the peak, the market entered a correction phase. Over the past year, TRB experienced a notable decline of 64.02%, with the price adjusting from higher levels to the current trading range
TRB Current Market Status
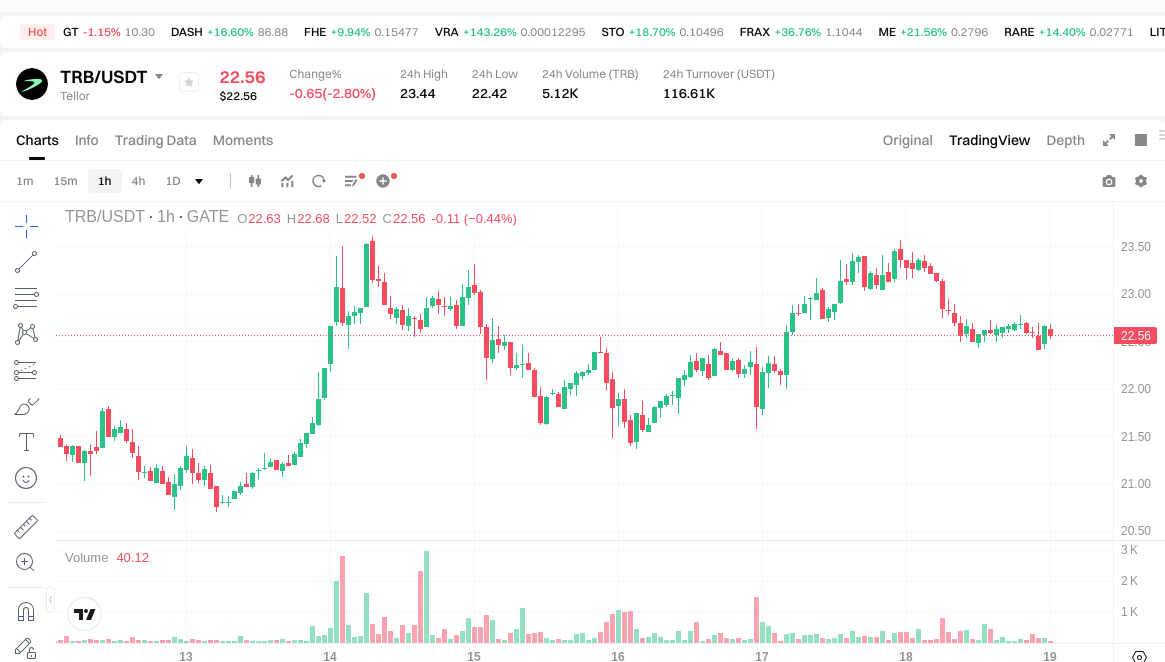
As of January 19, 2026, TRB is trading at $22.59, reflecting a 24-hour decrease of 2.92%. The token maintains a market capitalization of approximately $62.15 million, with a circulating supply of 2,751,236 TRB tokens, representing 97.46% of the total supply of 2,822,929 tokens. The 24-hour trading volume stands at $119,109.97.
Recent price movements show mixed short-term trends. Over the past hour, TRB gained 0.18%, while the 7-day performance indicates a 5.60% increase. The 30-day timeframe reveals stronger positive momentum with a 15.90% gain. The token's 24-hour trading range fluctuated between $22.42 and $23.44.
Tellor currently ranks #471 by market capitalization, holding a 0.0018% share of the total cryptocurrency market. The fully diluted market cap reaches $63.77 million, with the market cap to FDV ratio at 97.46%, indicating most tokens are already in circulation. The project maintains presence across 34 exchanges and has 11,337 token holders.
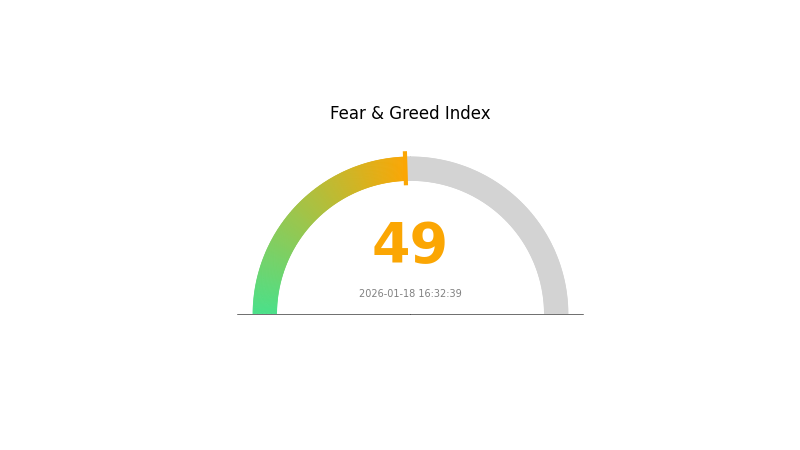
The Gate Market Fear and Greed Index registers at 49, reflecting a neutral market sentiment for the current trading environment.
Click to view current TRB market price
TRB Market Sentiment Indicator
2026-01-18 Fear and Greed Index: 49 (Neutral)
Click to view current Fear & Greed Index
The cryptocurrency market is currently in a neutral sentiment phase, with the Fear and Greed Index standing at 49. This reading indicates balanced market conditions, where neither excessive fear nor unbridled greed is driving price movements. Investors are maintaining a cautious yet optimistic stance, suggesting a stabilization period in the market. Such neutral conditions often present opportunities for measured investment decisions, as volatility tends to be moderate and market participants are neither panic-selling nor aggressively chasing gains. Monitor market developments closely for potential shifts in sentiment that could signal emerging trends.
TRB Holdings Distribution
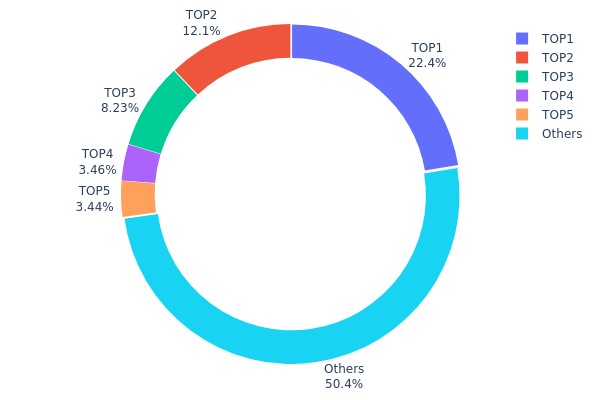
The holdings distribution chart visualizes the concentration of TRB tokens across different wallet addresses, serving as a critical metric for assessing the decentralization level and potential market manipulation risks. This indicator reveals how token supply is allocated among major holders versus smaller participants, providing insights into the on-chain governance structure and market stability.
Based on the current data, TRB exhibits a moderately concentrated holdings pattern. The top holder controls 631.62K tokens, representing 22.37% of the total supply, while the second and third largest addresses hold 12.05% and 8.22% respectively. Combined, the top five addresses account for 49.53% of total supply, with the remaining 50.47% distributed among other participants. This concentration level suggests a relatively centralized token structure, where a small group of addresses maintains significant influence over market dynamics.
Such distribution characteristics carry important implications for TRB's market behavior. The substantial holdings of top addresses could potentially amplify price volatility during large-scale transactions, as movements by major holders may trigger cascading market reactions. Additionally, this concentration level indicates moderate centralization risks, where coordinated actions among top holders could theoretically impact market pricing. However, the fact that over half of the supply remains distributed among smaller addresses provides some degree of market resilience and reduces the likelihood of complete price manipulation by a single entity.
Click to view current TRB Holdings Distribution
| Top |
Address |
Holding Qty |
Holding (%) |
| 1 |
0xf977...41acec |
631.62K |
22.37% |
| 2 |
0x5a52...70efcb |
340.33K |
12.05% |
| 3 |
0x073f...113ad7 |
232.25K |
8.22% |
| 4 |
0xa399...49fc35 |
97.59K |
3.45% |
| 5 |
0x00c0...ab42fc |
97.21K |
3.44% |
| - |
Others |
1423.72K |
50.47% |
II. Core Factors Influencing TRB's Future Price
Technology Development and Ecosystem Growth
- Project Technical Strength: The future trajectory depends on the development team's technical capabilities and the market's acceptance level. Continuous technological innovation and ecosystem expansion may provide support for price movements.
- Digital Asset Integration: The ongoing convergence between traditional finance and digital assets, significantly influenced by crucial regulatory developments, will determine the industry's trajectory in the foreseeable future.
- Market Adoption: The extent to which the technology is adopted and implemented within the cryptocurrency ecosystem could influence long-term value proposition.
Market Demand and Overall Cryptocurrency Trends
- Cryptocurrency Market Sentiment: As a crypto asset, TRB's price is influenced by overall cryptocurrency market sentiment and trends. The broader market conditions play a significant role in determining price movements.
- Trading Dynamics: Market liquidity and trading patterns across different platforms may create opportunities and risks for price discovery.
- Investor Confidence: Market confidence levels and trading activity patterns can affect short-term and medium-term price fluctuations.
Regulatory Environment
- Regulatory Developments: The regulatory landscape for digital assets continues to evolve. Regulatory clarity and policy frameworks in major jurisdictions may impact market dynamics.
- Compliance Requirements: Changes in compliance standards and reporting requirements could influence market participation and institutional involvement.
- Policy Uncertainty: The coming months are expected to be significant as the industry navigates regulatory developments that will shape its future direction.
Macroeconomic Factors
- Market Conditions: Broader economic trends and financial market conditions may influence cryptocurrency valuations and investor risk appetite.
- Capital Flows: Institutional and retail capital allocation decisions in the digital asset space could affect market dynamics.
- Economic Outlook: Global economic developments and monetary policy considerations may indirectly impact cryptocurrency market performance.
III. 2026-2031 TRB Price Forecast
2026 Outlook
- Conservative estimate: $16.47-$22.56
- Neutral estimate: $22.56
- Optimistic estimate: $32.71 (subject to favorable market conditions and sustained adoption)
2027-2029 Medium-term Outlook
- Market phase expectation: The token may enter a consolidation and gradual appreciation phase, with potential fluctuations driven by broader crypto market sentiment and protocol developments
- Price range forecast:
- 2027: $18.52-$29.02, with an average around $27.64
- 2028: $26.63-$29.18, maintaining relatively stable growth momentum
- 2029: $20.70-$30.76, reflecting continued market maturation
- Key catalysts: Enhanced protocol adoption, ecosystem expansion, and increased integration with decentralized data infrastructure could serve as primary drivers for price appreciation
2030-2031 Long-term Outlook
- Baseline scenario: $19.34-$33.63 by 2030 (assuming steady market conditions and protocol development)
- Optimistic scenario: $26.62-$39.62 by 2031 (contingent on significant ecosystem growth and broader DeFi integration)
- Transformative scenario: Potential to reach upper bounds if oracle services achieve widespread enterprise adoption and the protocol captures substantial market share in decentralized data infrastructure
- 2026-01-19: TRB trading within predicted ranges as market participants assess long-term fundamentals and ecosystem developments
| Year |
Predicted High Price |
Predicted Average Price |
Predicted Low Price |
Price Change |
| 2026 |
32.712 |
22.56 |
16.4688 |
0 |
| 2027 |
29.0178 |
27.636 |
18.51612 |
22 |
| 2028 |
29.17671 |
28.3269 |
26.62729 |
25 |
| 2029 |
30.76443 |
28.7518 |
20.7013 |
27 |
| 2030 |
33.62667 |
29.75812 |
19.34278 |
31 |
| 2031 |
39.61549 |
31.69239 |
26.62161 |
40 |
IV. TRB Professional Investment Strategy and Risk Management
TRB Investment Methodology
(I) Long-term Holding Strategy
- Suitable for: Investors who believe in decentralized oracle infrastructure and have a moderate to high risk tolerance
- Operational Recommendations:
- Conduct thorough research on Tellor's oracle mechanism and competitive positioning in the decentralized data feed market
- Consider dollar-cost averaging to mitigate entry price volatility, given TRB's historical price fluctuations
- Storage Solution: Use Gate Web3 Wallet for secure self-custody with multi-signature capabilities
(II) Active Trading Strategy
- Technical Analysis Tools:
- Moving Averages: Monitor 50-day and 200-day moving averages to identify trend reversals and potential entry/exit points
- RSI (Relative Strength Index): Track overbought (>70) and oversold (<30) conditions to time short-term trades
- Band Trading Key Points:
- Set clear profit targets and stop-loss levels before entering positions, considering TRB's volatility range
- Monitor on-chain metrics such as oracle query volume and network activity for trading signals
TRB Risk Management Framework
(I) Asset Allocation Principles
- Conservative Investors: 1-3% of crypto portfolio allocation
- Aggressive Investors: 5-8% of crypto portfolio allocation
- Professional Investors: Up to 10% with active hedging strategies
(II) Risk Hedging Solutions
- Portfolio Diversification: Combine TRB with other oracle tokens and blue-chip cryptocurrencies to reduce sector-specific risks
- Position Sizing: Never allocate more than recommended percentages to maintain portfolio balance
(III) Secure Storage Solutions
- Hot Wallet Recommendation: Gate Web3 Wallet for convenient trading and staking access
- Cold Storage Solution: Hardware wallets for long-term holdings exceeding $10,000 equivalent
- Security Precautions: Enable two-factor authentication, verify contract addresses on Etherscan (0x88df592f8eb5d7bd38bfef7deb0fbc02cf3778a0), and never share private keys or seed phrases
V. TRB Potential Risks and Challenges
TRB Market Risks
- High Volatility: TRB has experienced significant price swings, declining approximately 64.02% over the past year
- Limited Market Capitalization: With a market cap ranking of 471 and market share of 0.0018%, TRB faces liquidity risks during market stress
- Competition Pressure: The oracle sector includes multiple competitors, which may impact TRB's market share and adoption rate
TRB Regulatory Risks
- Oracle Regulation Uncertainty: Evolving regulatory frameworks for data feeds and oracle services may affect Tellor's operational model
- Securities Classification Risk: Regulatory bodies may classify certain oracle tokens differently across jurisdictions, affecting trading and custody
- Compliance Requirements: Increasing KYC/AML requirements on exchanges may impact TRB's accessibility in certain markets
TRB Technical Risks
- Smart Contract Vulnerabilities: As an Ethereum-based project, TRB is exposed to potential smart contract exploits or bugs
- Centralization Concerns: The disputed miner network model may face challenges in maintaining true decentralization
- Network Security: PoW mining competition mechanism requires continuous security monitoring to prevent manipulation attacks
VI. Conclusion and Action Recommendations
TRB Investment Value Assessment
Tellor (TRB) represents a specialized investment in decentralized oracle infrastructure with a market cap of approximately $62.15 million and circulating supply ratio of 97.46%. The project's focus on high-value off-chain data integration addresses a critical need in the Ethereum ecosystem. However, the token has faced significant price pressure over the past year, declining 64.02%, while showing recent recovery signs with a 15.90% gain over 30 days. The long-term value proposition depends on Tellor's ability to maintain competitive advantages in the oracle space, while short-term risks include continued market volatility and competition from established oracle providers.
TRB Investment Recommendations
✅ Beginners: Start with minimal allocation (1-2% of crypto portfolio) and focus on understanding oracle mechanics before increasing exposure. Consider using Gate.com's spot trading features with strict stop-loss orders.
✅ Experienced Investors: Maintain a balanced position (3-5% allocation) with active monitoring of on-chain metrics and ecosystem developments. Utilize technical analysis tools for optimal entry and exit timing.
✅ Institutional Investors: Conduct comprehensive due diligence on Tellor's oracle mechanism, competitive moat, and regulatory compliance. Consider strategic positions with hedging instruments and regular portfolio rebalancing.
TRB Trading Participation Methods
- Spot Trading: Trade TRB against major pairs on Gate.com with 24-hour trading volume of approximately $119,109
- Portfolio Integration: Include TRB as part of a diversified oracle and DeFi infrastructure investment strategy
- Staking Participation: Engage with Tellor's mining mechanism if technically proficient to earn network rewards
Cryptocurrency investment carries extremely high risks, and this article does not constitute investment advice. Investors should make prudent decisions based on their own risk tolerance and are advised to consult professional financial advisors. Never invest more than you can afford to lose.
FAQ
TRB reached an all-time high of $602.98 but has since declined significantly. Currently, TRB is trading substantially below its peak, down approximately 96.60% from the all-time high as of January 2026.
What are the main factors affecting TRB price?
TRB price is primarily influenced by market demand, investor sentiment, and whale activities. Additionally, trading volume, market trends, and news developments significantly impact price fluctuations.
What are the main viewpoints on TRB price prediction for 2024?
2024 TRB price predictions show mixed viewpoints. Analysts considered Oracle utility growth, market sentiment, and adoption expansion. Key factors included network development, trading volume increase, and overall crypto market conditions. Predictions ranged from moderate growth to significant appreciation potential.
What advantages does TRB have compared to other oracle tokens like LINK?
TRB offers decentralized data provision with lower barriers to entry for reporters. Its dispute mechanism ensures data accuracy, while maintaining cost efficiency. Tellor's flexible architecture supports diverse data types, providing competitive advantages in customization and scalability compared to traditional oracle solutions.
What are the main risks of investing in TRB?
TRB investment risks include market volatility, liquidation risk with leverage, oracle manipulation concerns, and protocol governance changes. Price fluctuations can result in significant losses. Smart contract vulnerabilities and adoption uncertainty also pose risks to long-term value.
How does Tellor protocol's roadmap impact TRB price?
Tellor's roadmap typically drives TRB price appreciation by expanding functionality and partnerships, increasing market demand. The protocol's development milestones enhance ecosystem utility and attract more participants, supporting long-term price growth.
* The information is not intended to be and does not constitute financial advice or any other recommendation of any sort offered or endorsed by Gate.