This comprehensive analysis examines TRON (TRX) current market position and provides detailed price evaluation through 2031. As of January 2026, TRX trades at $0.29952 with a $28.37 billion market cap, supported by strong ecosystem fundamentals including USDD stablecoin adoption and 218.7 million network holders. The article analyzes key price drivers including DPoS supply mechanics, institutional dynamics, TRON's dominant role in stablecoin settlement, and DeFi infrastructure through JustLend and SunSwap platforms. Based on technical and fundamental analysis, TRX demonstrates potential growth trajectory reaching $0.44653-$0.54199 by 2030-2031. Investment recommendations span conservative, active, and institutional strategies with risk management frameworks. The analysis highlights both opportunities in ecosystem expansion and risks including regulatory challenges and competitive pressures from alternative blockchain platforms, accessible for trading and storage on Gate.com.
Introduction: TRX's Market Position and Investment Value
TRON (TRX), positioned as a leading decentralized blockchain infrastructure platform, has achieved remarkable milestones since its inception in 2017. As of January 13, 2026, TRX has attained a market capitalization of approximately $28.37 billion, with a circulating supply of around 94.70 billion tokens, maintaining a price level near $0.30. This asset, recognized as a prominent blockchain infrastructure solution, is playing an increasingly critical role in supporting decentralized applications, stablecoin ecosystems, and sovereign blockchain partnerships.
This article will comprehensively analyze TRX's price trajectory from 2026 to 2031, combining historical patterns, market supply-demand dynamics, ecosystem development, and macroeconomic conditions to provide investors with professional price forecasts and practical investment strategies.
I. TRX Price History Review and Market Status
TRX Historical Price Evolution Trajectory
- 2017: TRX launched in July with an initial offering price of $0.0015, marking the beginning of its trading journey in the cryptocurrency market
- 2017: Reached its historical low point of $0.00180434 in November, representing early market uncertainty and volatility
- 2022: TRON announced the launch of USDD, a decentralized over-collateralized stablecoin, supporting ecosystem development and price stability
- 2022: In October, Dominica designated TRON as its official national blockchain infrastructure, establishing strategic partnerships with sovereign nations
- 2024: Price experienced notable growth, reaching near $0.431288 in December, reflecting increased market adoption and ecosystem expansion
TRX Current Market Situation
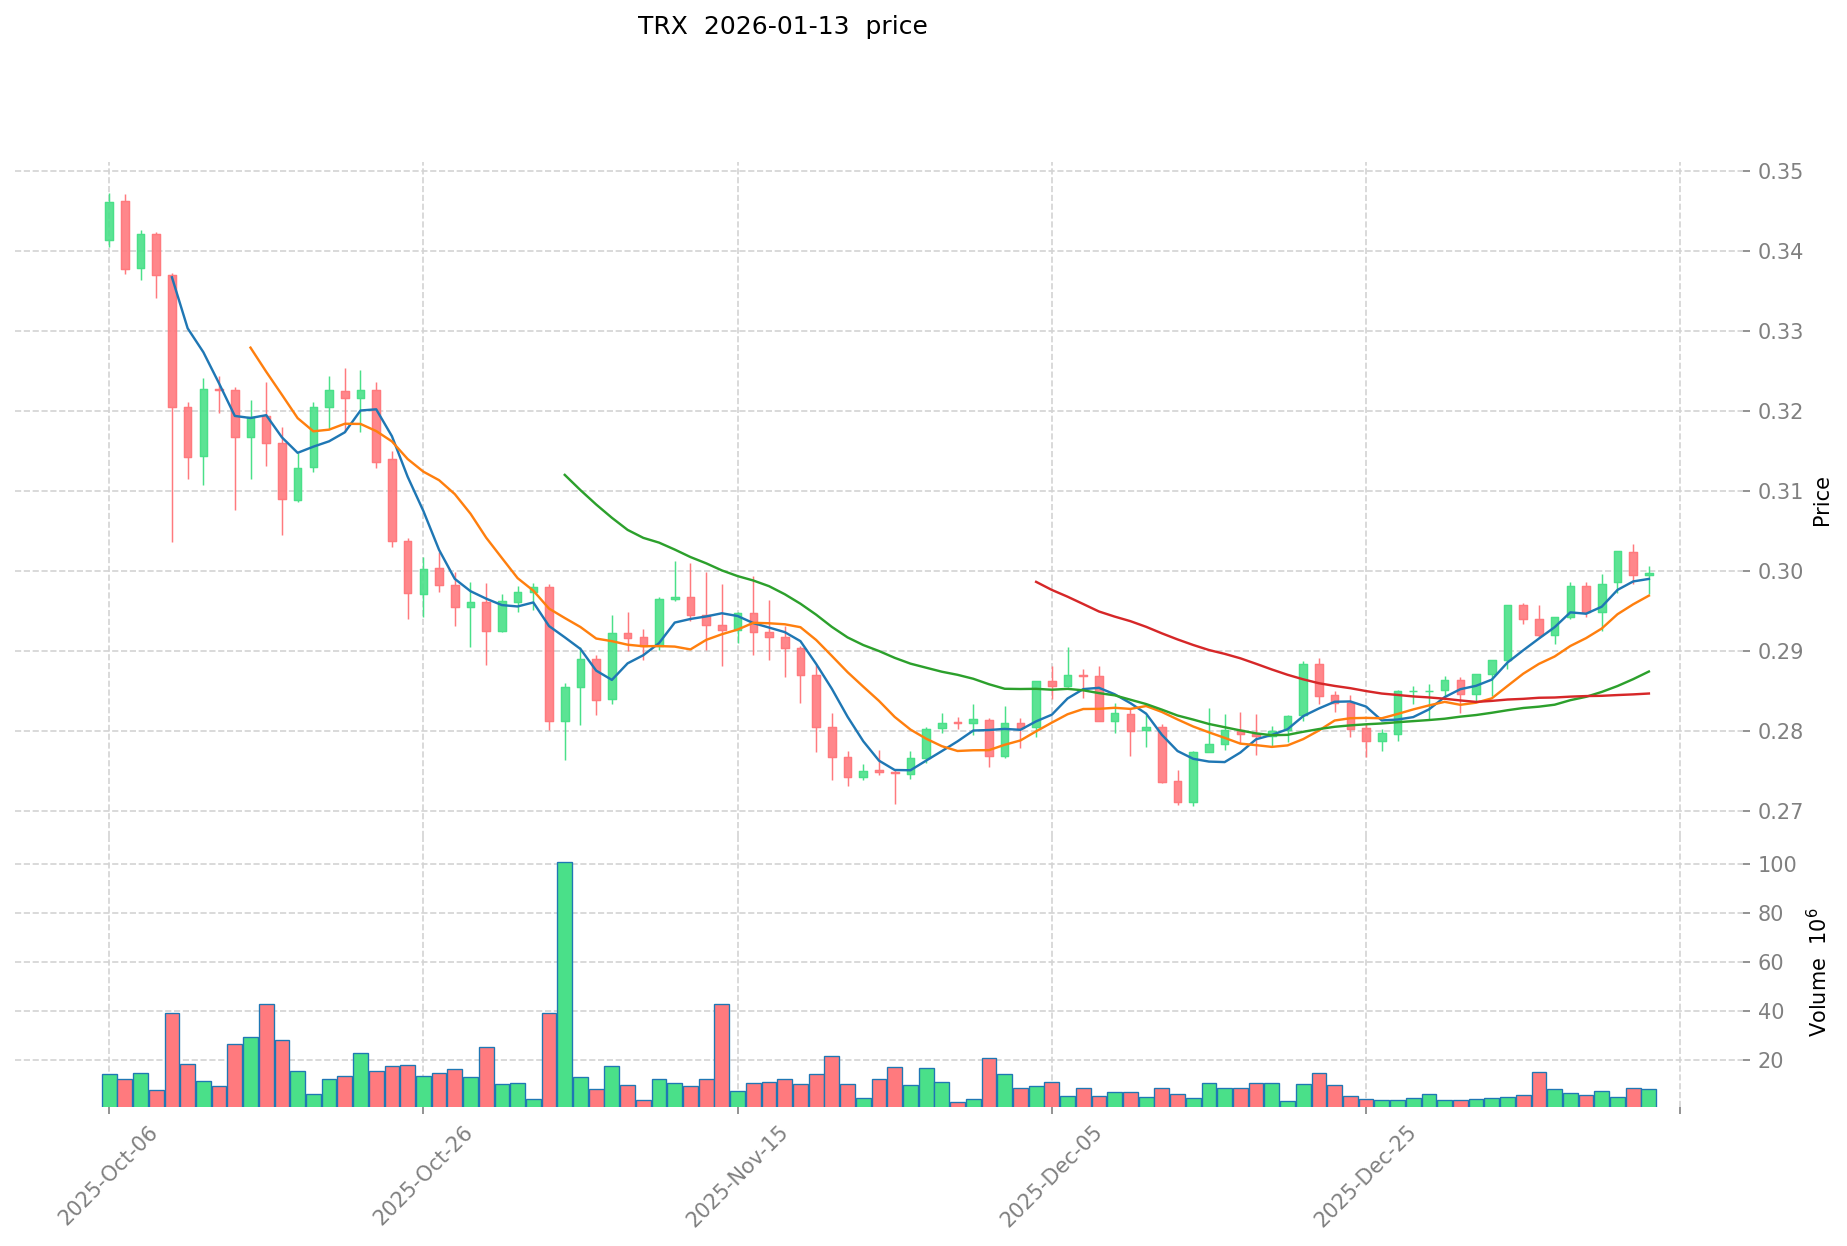
As of January 13, 2026, TRX is trading at $0.29952, showing a modest increase of 0.13% over the past 24 hours. The token has demonstrated positive momentum with gains of 2.17% over the past week and 9.29% over the past month. The annual performance indicates a substantial increase of 28.22%, suggesting growing market confidence in the TRON ecosystem.
The 24-hour trading range spans from $0.29707 to $0.30067, indicating relatively stable price action with limited volatility. The current market capitalization stands at approximately $28.37 billion, positioning TRX as the 8th largest cryptocurrency by market capitalization, with a market dominance of 0.87%. The circulating supply represents 99.99% of the total supply, with 94.70 billion TRX tokens in circulation.
The network has achieved significant adoption with 218.7 million holders, demonstrating widespread user engagement and ecosystem participation. The market sentiment index indicates a "Fear" reading of 26, reflecting cautious investor attitudes in the broader cryptocurrency market. TRX maintains listings on 74 exchanges, providing extensive liquidity and accessibility for traders and investors.
Click to view current TRX market price
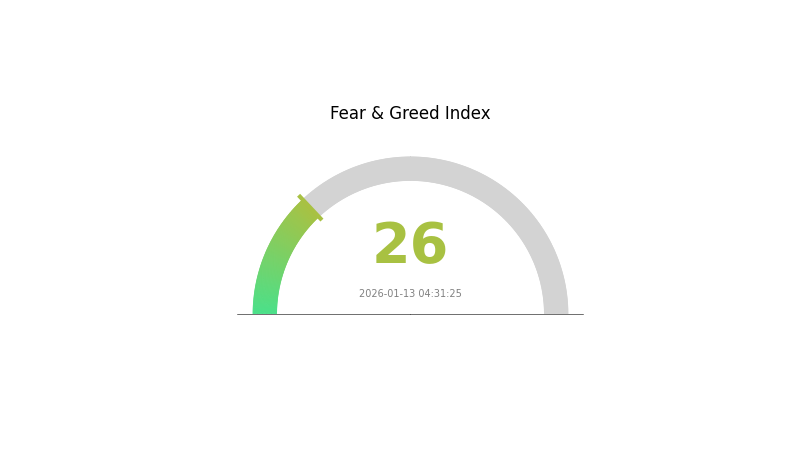
TRX Market Sentiment Indicator
2026-01-13 Fear and Greed Index: 26 (Fear)
Click to view the current Fear & Greed Index
The TRX market is currently experiencing a fear sentiment with an index reading of 26. This indicates that market participants are predominantly risk-averse, with negative sentiment dominating trading decisions. During periods of fear, investors tend to adopt cautious strategies and reduce exposure. This environment often presents opportunities for value-oriented traders to accumulate positions at potentially favorable prices. Monitor market developments closely on Gate.com to identify potential reversals when sentiment begins to shift toward equilibrium.
TRX Holdings Distribution
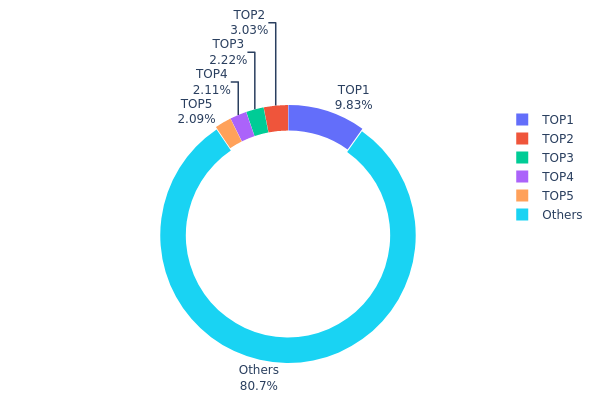
The holdings distribution chart illustrates how TRX tokens are allocated across different wallet addresses, serving as a critical indicator of token concentration and decentralization within the network. This metric helps investors assess the risk of price manipulation and understand the overall health of token distribution among market participants.
Based on the current data, TRX demonstrates a relatively moderate concentration level. The top address holds approximately 9.83% of the total supply (9.31 billion TRX), while the top five addresses collectively control 19.26% of tokens. The remaining 80.74% is distributed among other addresses, suggesting a reasonably dispersed ownership structure. This distribution pattern indicates that no single entity possesses overwhelming control over the token supply, which reduces the immediate risk of coordinated market manipulation.
From a market structure perspective, this distribution level reflects a healthy balance between decentralization and liquidity concentration. While the top holders maintain significant positions that could influence short-term price movements, the substantial portion held by smaller addresses provides a stabilizing effect. The current distribution suggests that TRX has achieved a mature on-chain structure with sufficient decentralization to support independent market dynamics, while maintaining enough liquidity concentration to facilitate efficient trading activity.
Click to view current TRX Holdings Distribution
| Top |
Address |
Holding Qty |
Holding (%) |
| 1 |
TU3kjF...yuSLQ5 |
9313546.60K |
9.83% |
| 2 |
TT2T17...EWkU9N |
2870666.28K |
3.03% |
| 3 |
TE2Rzo...oxvRwP |
2100354.06K |
2.21% |
| 4 |
TNPdqt...jLeHAF |
2000070.03K |
2.11% |
| 5 |
TPyjyZ...kgNan5 |
1974808.71K |
2.08% |
| - |
Others |
76444917.55K |
80.74% |
II. Core Factors Influencing TRX's Future Price
Supply Mechanism
- DPoS Consensus Mechanism: TRON adopts a Delegated Proof of Stake (DPoS) consensus mechanism that influences network efficiency and token circulation. The mechanism supports Java development and uses a leasing model to reduce transaction fees, which may impact token velocity and demand patterns.
- Historical Patterns: TRX has experienced significant price volatility correlated with broader cryptocurrency market cycles. Recent trends show TRX fluctuating from $0.44 to $0.29 during 2024-2025, reflecting both market-wide sentiment shifts and ecosystem-specific challenges.
- Current Impact: Market analysts observe key support levels around $0.273, with attention focused on the $0.29-$0.35 range. Supply dynamics continue to be influenced by staking mechanisms offering 6-10% annual yields, which may affect circulating supply and price stability.
Institutional and Major Holder Dynamics
- Institutional Holdings: TRON's institutional landscape includes strategic partnerships within the DeFi sector. The platform serves as a significant infrastructure for USDT circulation, with over 50% of USDT transactions occurring on the TRON network, creating sustained demand for TRX as a transaction fee medium.
- Corporate Adoption: TRON's ecosystem supports various decentralized applications, including SunSwap (decentralized exchange), JustLend (lending protocol), and APENFT Marketplace (NFT platform), contributing to network utility and token demand.
- Regulatory Developments: Regulatory scrutiny remains a consideration, with ongoing discussions regarding cryptocurrency oversight potentially affecting market confidence. Compliance developments and regulatory clarity may influence institutional participation and price trajectory.
Macroeconomic Environment
- Monetary Policy Impact: TRX's price sensitivity extends to broader cryptocurrency market trends, which are influenced by macroeconomic conditions, monetary policy shifts, and institutional capital flows. Market sentiment and funding patterns significantly affect price movements across the sector.
- Market Volatility: As with most digital assets, TRX demonstrates correlation with overall cryptocurrency market cycles. Economic uncertainty and shifting investor risk appetite may contribute to price fluctuations.
- Competitive Landscape: Emerging blockchain platforms offering lower transaction fees, such as newer Layer-1 solutions, present competitive pressure. The introduction of USDT-specific chains also creates potential challenges to TRON's dominant position in stablecoin settlement.
Technological Development and Ecosystem Building
- DeFi Infrastructure: JustLend functions as TRON's largest decentralized lending platform, allowing users to deposit TRX, USDT, and USDC to earn interest or borrow against collateral. This infrastructure serves as a core financial component of the TRON ecosystem, supporting liquidity and network activity.
- Decentralized Exchange Integration: SunSwap operates similarly to Ethereum's Uniswap model, enabling TRC-20 token exchanges and liquidity provision. Users can participate in trading activities and earn returns through liquidity mining, contributing to ecosystem engagement.
- NFT and GameFi Applications: TRON supports NFT ecosystems through platforms like APENFT Marketplace, providing creators and collectors with trading venues. Additionally, GameFi projects enable players to participate in game economies using TRX and TRC-20 tokens.
- Network Activity Indicators: Protocol revenue growth reflects TRON's financial vitality and market acceptance. Higher protocol revenue indicates increased liquidity within the DeFi ecosystem and may signal stronger ecosystem fundamentals. However, recent data shows Total Value Locked (TVL) declining from $7.3 billion earlier in the year to approximately $6 billion, suggesting shifts in user activity and capital allocation.
III. 2026-2031 TRX Price Forecast
2026 Outlook
- Conservative estimate: $0.27256 - $0.29952
- Neutral estimate: Around $0.29952
- Optimistic estimate: Up to $0.44029 (contingent on favorable market conditions and ecosystem expansion)
2027-2029 Mid-term Outlook
- Market phase expectation: Potential growth phase with increasing adoption of TRON's decentralized applications and enhanced network utility
- Price range forecast:
- 2027: $0.29593 - $0.3995 (approximately 23% potential upside)
- 2028: $0.29622 - $0.43087 (approximately 28% potential upside)
- 2029: $0.21205 - $0.48526 (approximately 36% potential upside)
- Key catalysts: Network upgrades, DeFi ecosystem development, strategic partnerships, and broader cryptocurrency market sentiment
2030-2031 Long-term Outlook
- Baseline scenario: $0.42866 - $0.46439 (assuming steady network growth and sustained market interest)
- Optimistic scenario: $0.44653 - $0.54199 (contingent on significant technological breakthroughs and mass adoption)
- Transformative scenario: Exceeding $0.54199 (requires exceptional market conditions, major institutional adoption, and breakthrough use cases)
- 2030-01-13: TRX projected average around $0.44653 (representing approximately 49% potential growth trajectory)
- 2031-01-13: TRX projected average around $0.45546 (representing approximately 52% cumulative potential growth trajectory)
| Year |
Predicted High Price |
Predicted Average Price |
Predicted Low Price |
Price Change |
| 2026 |
0.44029 |
0.29952 |
0.27256 |
0 |
| 2027 |
0.3995 |
0.36991 |
0.29593 |
23 |
| 2028 |
0.43087 |
0.3847 |
0.29622 |
28 |
| 2029 |
0.48526 |
0.40779 |
0.21205 |
36 |
| 2030 |
0.46439 |
0.44653 |
0.42866 |
49 |
| 2031 |
0.54199 |
0.45546 |
0.39625 |
52 |
IV. TRX Professional Investment Strategy and Risk Management
TRX Investment Methodology
(1) Long-term Holding Strategy
- Suitable for: Investors with a long-term perspective who believe in the continued growth of the TRON ecosystem and decentralized stablecoin adoption
- Operational Recommendations:
- Consider accumulating positions during market corrections while monitoring key support levels around $0.29-$0.30
- Establish a diversified portfolio allocation that includes TRX alongside other established cryptocurrencies
- Storage Solution: Utilize Gate Web3 Wallet for secure asset custody, enabling access to TRON ecosystem features while maintaining control of private keys
(2) Active Trading Strategy
- Technical Analysis Tools:
- Moving Averages: Monitor 50-day and 200-day moving averages to identify trend directions and potential entry/exit points
- Volume Analysis: Track 24-hour trading volume (currently around $2.09B) to confirm price movements and detect potential reversals
- Swing Trading Key Points:
- Monitor daily high/low ranges ($0.29707-$0.30067) to identify intraday volatility patterns
- Set profit targets and stop-loss levels based on recent price action and support/resistance zones
TRX Risk Management Framework
(1) Asset Allocation Principles
- Conservative Investors: 2-5% of cryptocurrency portfolio
- Aggressive Investors: 8-15% of cryptocurrency portfolio
- Professional Investors: 15-25% of cryptocurrency portfolio, with active hedging strategies
(2) Risk Hedging Solutions
- Portfolio Diversification: Combine TRX holdings with stablecoins and other major cryptocurrencies to reduce concentration risk
- Position Sizing: Scale into positions gradually rather than committing full capital at once, particularly during periods of high volatility
(3) Security Storage Solutions
- Non-custodial Wallet Recommendation: Gate Web3 Wallet provides comprehensive support for TRX and TRON-based assets with user-controlled private keys
- Multi-signature Solution: Consider implementing multi-signature wallets for larger holdings to enhance security protocols
- Security Precautions: Never share private keys or seed phrases, enable two-factor authentication, and regularly verify wallet addresses before transactions
V. TRX Potential Risks and Challenges
TRX Market Risks
- Price Volatility: TRX has demonstrated significant price movements with a 1-year gain of 28.22%, but remains subject to broader cryptocurrency market fluctuations
- Liquidity Considerations: While trading volume is substantial at over $2B daily, market conditions can change rapidly during periods of stress
- Market Sentiment Dependency: Price performance may be influenced by overall cryptocurrency market trends and investor sentiment shifts
TRX Regulatory Risks
- Global Regulatory Evolution: Changing regulatory frameworks across different jurisdictions may impact TRON ecosystem operations and token utility
- Stablecoin Oversight: Increased regulatory scrutiny on decentralized stablecoins like USDD could affect TRON's strategic initiatives
- Compliance Requirements: Evolving compliance standards may require network adaptations and could influence adoption rates
TRX Technical Risks
- Network Security: As with any blockchain platform, potential vulnerabilities in smart contracts or protocol implementations require ongoing monitoring
- Scalability Challenges: Continued network growth may test infrastructure capacity and transaction processing efficiency
- Competition: Intense competition from other Layer 1 blockchains could impact TRON's market position and ecosystem development
VI. Conclusion and Action Recommendations
TRX Investment Value Assessment
TRON (TRX) presents a complex investment proposition with both opportunities and risks. The network's focus on decentralized stablecoins through USDD and its partnership with sovereign nations demonstrate strategic positioning within the blockchain infrastructure space. With a current market cap of approximately $28.37B and ranking 8th globally, TRX has established significant market presence. The token's 28.22% one-year performance and 9.29% thirty-day gain suggest positive momentum, though investors should recognize that cryptocurrency markets remain highly volatile. Long-term value proposition centers on TRON's ecosystem expansion and adoption of decentralized financial services, while short-term risks include market volatility, regulatory uncertainties, and competitive pressures from alternative blockchain platforms.
TRX Investment Recommendations
✅ Beginners: Start with a small allocation (2-3% of cryptocurrency portfolio), focus on understanding TRON ecosystem fundamentals, and use Gate.com platform for secure trading and storage through Gate Web3 Wallet
✅ Experienced Investors: Consider strategic position building during market corrections, implement technical analysis for timing optimization, and maintain diversified exposure across multiple blockchain ecosystems
✅ Institutional Investors: Evaluate TRON's role within broader digital asset portfolios, assess correlation benefits with traditional holdings, and implement comprehensive risk management protocols including hedging strategies
TRX Trading Participation Methods
- Spot Trading: Purchase TRX directly on Gate.com with competitive trading fees and deep liquidity across multiple trading pairs
- Dollar-Cost Averaging: Establish systematic recurring purchases to reduce timing risk and build positions gradually over time
- Staking and Ecosystem Participation: Explore TRON network staking opportunities and decentralized applications to generate additional yield on holdings
Cryptocurrency investment carries extremely high risks, and this article does not constitute investment advice. Investors should make prudent decisions based on their own risk tolerance and are advised to consult professional financial advisors. Never invest more than you can afford to lose.
FAQ
How high will the TRX price go in the future?
Based on analyst predictions, TRX is expected to trade between 0.30 to 0.60 USD in 2026, with potential to reach over 2.20 USD by 2030. Growth projections are supported by Tron's expanding ecosystem and increasing utility.
What are the main factors affecting TRX price?
TRX price is influenced by market sentiment, trading volume, technological innovations, overall market trends, and investor confidence. Network development and macroeconomic conditions also play significant roles.
How to predict TRX price trends through technical analysis?
Use moving averages, RSI, and MACD indicators to analyze TRX price movements. Monitor support and resistance levels, trading volume, and market sentiment. Historical data shows TRX demonstrates strong bullish potential on longer timeframes, with technical signals suggesting upward price momentum in the medium term.
How are TRX's investment prospects compared to other public chain tokens?
TRX maintains stable market position in top ten globally. Strong user activity and TVL lock-in support long-term value. Competitive advantages in transaction volume and ecosystem development position TRX favorably against other public chain alternatives.
What are expert opinions on TRX price predictions for 2024?
According to expert analysis, TRX price in 2024 is predicted to reach up to $0.14. Long-term forecasts suggest TRX could reach $1.19 by 2030, based on market trends and fundamental development momentum.
* The information is not intended to be and does not constitute financial advice or any other recommendation of any sort offered or endorsed by Gate.