This comprehensive guide analyzes UMA (Universal Market Access) token's market position and provides expert price forecasts from 2026 to 2031. The article examines UMA's historical performance, current market status with detailed trading metrics, and key factors influencing DeFi token valuations. Featured predictions range from conservative estimates at $0.4976 to optimistic scenarios exceeding $1.75559 by 2031. The guide equips investors with professional strategies including long-term holding and active trading approaches, alongside essential risk management frameworks. It covers market risks, regulatory challenges, and technical vulnerabilities while offering actionable investment recommendations for beginners, experienced traders, and institutional investors on Gate exchange platform.
Introduction: UMA's Market Position and Investment Value
UMA (UMA) serves as a decentralized financial contract platform, enabling the creation of unique standardized products through its innovative contract design patterns. Since its launch in 2020, UMA has established itself as a protocol facilitating various financial innovations in the DeFi ecosystem. As of 2026, UMA maintains a market capitalization of approximately 69.63 million USD, with a circulating supply of around 89.46 million tokens, and the price hovers around 0.7783 USD. This asset, recognized as an "open-source financial contract protocol," continues to play a meaningful role in enabling parties to design and create customized financial contracts.
This article provides a comprehensive analysis of UMA's price trajectory from 2026 to 2031, incorporating historical patterns, market supply-demand dynamics, ecosystem developments, and macroeconomic conditions to offer investors professional price forecasts and practical investment strategies.
I. UMA Price History Review and Market Status
UMA Historical Price Evolution Trajectory
- 2020: UMA launched in April 2020, recording its all-time low of $0.303625 on April 30, 2020, with an initial publish price of $1.1627
- 2021: UMA reached its all-time high of $41.56 on February 4, 2021, representing substantial growth from its launch period
- 2023-2025: The token experienced a significant correction phase, with price declining by 72.85% over the past year
UMA Current Market Status
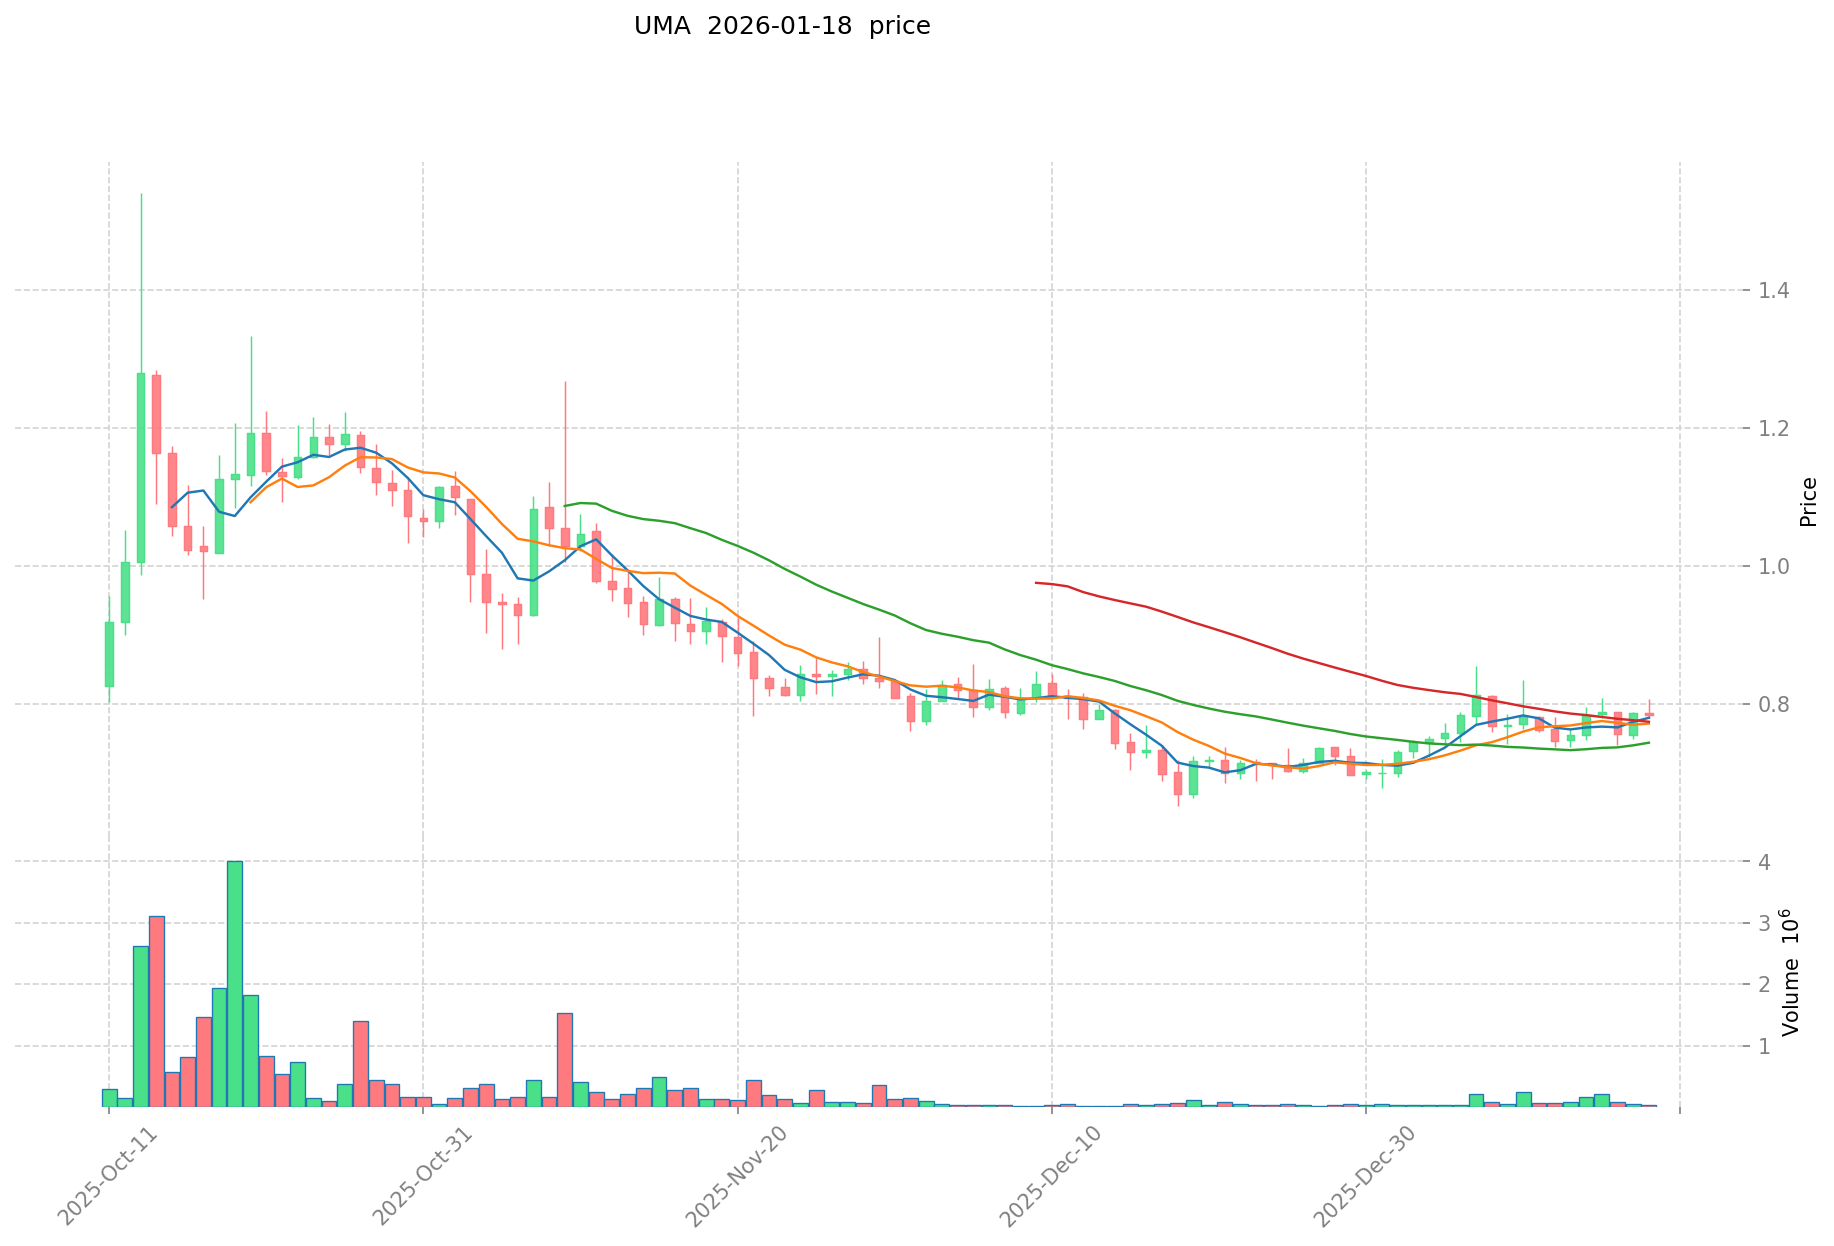
As of January 18, 2026, UMA is trading at $0.7783, showing a 24-hour decline of 2.41%. The token is currently trading within a daily range between $0.7743 and $0.8069. Over the past week, UMA has demonstrated modest positive momentum with a 1.9% increase, while the 30-day performance shows a stronger recovery of 12.59%.
The token maintains a market capitalization of approximately $69.63 million with a circulating supply of 89.46 million tokens, representing 78.07% of its total supply of 127.34 million UMA. The fully diluted market cap stands at approximately $99.11 million. With 24-hour trading volume reaching $25,617.54, UMA currently ranks #440 among cryptocurrencies and holds a 0.0029% market dominance.
UMA is listed on 34 exchanges and has attracted 24,529 token holders. The current market sentiment indicator shows a neutral reading of 49 on the VIX scale.
Click to view current UMA market price
UMA Market Sentiment Index
2026-01-18 Fear and Greed Index: 49 (Neutral)
Click to view the current Fear & Greed Index
The cryptocurrency market is currently displaying a neutral sentiment with a Fear and Greed Index of 49. This balanced reading suggests the market is neither overly optimistic nor pessimistic, indicating a stabilizing period. Investors are maintaining a cautious approach, with neither extreme buying pressure nor panic selling dominating the market. Such neutral conditions often present opportunities for strategic positioning, as the market seeks direction. Traders should monitor key support and resistance levels while awaiting clearer market signals to determine the next significant move.

UMA Holding Distribution
The holding distribution chart illustrates how UMA tokens are allocated across different blockchain addresses, providing critical insights into the token's ownership structure and decentralization level. By examining the concentration of holdings among top addresses, analysts can assess potential risks related to market manipulation and evaluate the overall health of the token's ecosystem.
Based on current data, UMA exhibits a notably concentrated holding pattern. The top two addresses collectively control approximately 52.89% of the total supply, with the largest holder possessing 27.02% and the second-largest holding 25.87%. When expanding the analysis to the top five addresses, their combined holdings reach 65.08%, leaving only 34.92% distributed among other market participants. This concentration level significantly exceeds the threshold typically associated with well-distributed cryptocurrencies, indicating that a relatively small number of entities maintain substantial control over the token's circulating supply.
Such concentrated holding distribution presents several implications for market dynamics. The dominant positions held by the top two addresses create potential vulnerabilities regarding price volatility, as large-scale transfers or sell-offs could trigger significant market movements. This concentration also raises concerns about governance centralization, particularly relevant for UMA's decentralized oracle protocol, where token voting plays a crucial role in dispute resolution. However, it's worth noting that some of these top addresses may represent exchange cold wallets, liquidity pools, or protocol treasury reserves rather than individual investors, which could partially mitigate centralization concerns. The current distribution structure suggests investors should carefully monitor large holder activities and maintain awareness of potential liquidity risks when entering or exiting positions.
Click to view current UMA Holding Distribution

| Top |
Address |
Holding Qty |
Holding (%) |
| 1 |
0x7b29...463fa8 |
34413.11K |
27.02% |
| 2 |
0x0043...bd34ac |
32947.34K |
25.87% |
| 3 |
0x61d6...5c9fcd |
5424.86K |
4.26% |
| 4 |
0xf977...41acec |
5332.83K |
4.18% |
| 5 |
0x8bd1...6e370c |
4775.29K |
3.75% |
| - |
Others |
44439.84K |
34.92% |
II. Core Factors Influencing UMA's Future Price
Technical Development and Ecosystem Building
- Protocol Enhancement: As blockchain technology continues to evolve, the UMA protocol's functionality and performance may see further improvements, potentially enhancing user experience and expanding its application scenarios.
- Ecosystem Expansion: The development and adoption of applications built on the UMA protocol could contribute to increasing utility and demand for the token.
Macroeconomic Environment
- Market Sentiment: Digital currency markets exhibit significant volatility, with prices influenced by broader market sentiment and investor confidence levels.
- Monetary Policy Impact: Regulatory frameworks and policy developments in the cryptocurrency space may affect market dynamics and investor participation.
- Global Economic Factors: Macroeconomic uncertainties and regulatory changes can create both opportunities and challenges for digital asset valuations.
III. 2026-2031 UMA Price Prediction
2026 Outlook
- Conservative Forecast: $0.4976 - $0.7775
- Neutral Forecast: Around $0.7775
- Optimistic Forecast: Up to $0.87858 (subject to favorable market conditions and increased adoption)
2027-2029 Mid-term Outlook
- Market Stage Expectation: Gradual growth phase with potential for moderate volatility as the DeFi sector continues to evolve
- Price Range Predictions:
- 2027: $0.57963 - $1.16753, with an average around $0.82804
- 2028: $0.58869 - $1.06763, averaging approximately $0.99779
- 2029: $0.96042 - $1.29088, with a projected average of $1.03271
- Key Catalysts: Expansion of decentralized derivatives platforms, increased institutional interest in synthetic assets, and broader DeFi ecosystem development
2030-2031 Long-term Outlook
- Baseline Scenario: $1.09209 - $1.38254 in 2030 (assuming steady market growth and protocol maturity)
- Optimistic Scenario: $1.18312 - $1.75559 by 2031 (contingent on significant protocol upgrades and mainstream adoption)
- Transformative Scenario: Potential to exceed $1.75559 (under conditions of widespread DeFi integration and favorable regulatory environment)
- 2026-01-18: UMA trading within the $0.4976 - $0.87858 range (early consolidation phase)
| Year |
Predicted High Price |
Predicted Average Price |
Predicted Low Price |
Price Change |
| 2026 |
0.87858 |
0.7775 |
0.4976 |
0 |
| 2027 |
1.16753 |
0.82804 |
0.57963 |
6 |
| 2028 |
1.06763 |
0.99779 |
0.58869 |
28 |
| 2029 |
1.29088 |
1.03271 |
0.96042 |
32 |
| 2030 |
1.38254 |
1.1618 |
1.09209 |
49 |
| 2031 |
1.75559 |
1.27217 |
1.18312 |
63 |
IV. UMA Professional Investment Strategies and Risk Management
UMA Investment Methodology
(I) Long-term Holding Strategy
- Suitable for: Investors with medium to high risk tolerance who believe in decentralized financial infrastructure and smart contract innovations
- Operational Recommendations:
- Consider establishing positions gradually during market corrections rather than all at once
- Focus on UMA's protocol development milestones and adoption metrics as indicators of long-term value
- Storage Solution: Utilize Gate Web3 Wallet for secure self-custody with multi-signature options for larger holdings
(II) Active Trading Strategy
- Technical Analysis Tools:
- Moving Averages: Monitor 50-day and 200-day moving averages to identify trend reversals and potential entry/exit points
- Relative Strength Index (RSI): Track RSI levels to identify overbought (above 70) or oversold (below 30) conditions
- Swing Trading Essentials:
- Pay attention to UMA's correlation with broader DeFi sector movements and Ethereum network activity
- Set clear profit targets and stop-loss levels based on technical support and resistance zones
UMA Risk Management Framework
(I) Asset Allocation Principles
- Conservative Investors: 2-5% of crypto portfolio allocation
- Aggressive Investors: 8-15% of crypto portfolio allocation
- Professional Investors: Up to 20% with active hedging strategies
(II) Risk Hedging Solutions
- Portfolio Diversification: Balance UMA exposure with established cryptocurrencies and stablecoins to reduce volatility impact
- Position Sizing: Use dollar-cost averaging to mitigate timing risk and reduce exposure to short-term price fluctuations
(III) Secure Storage Solutions
- Hot Wallet Recommendation: Gate Web3 Wallet for convenient trading and moderate holdings with enhanced security features
- Cold Storage Solution: Hardware wallet integration for long-term holdings exceeding significant portfolio value
- Security Considerations: Enable two-factor authentication, verify contract addresses before transactions, and never share private keys or seed phrases
V. UMA Potential Risks and Challenges
UMA Market Risks
- Volatility Risk: UMA has experienced significant price fluctuations, with a current price 98.13% below its all-time high of $41.56 reached in February 2021
- Liquidity Risk: With a 24-hour trading volume of approximately $25,617, sudden market movements could impact execution prices during large transactions
- Competition Risk: The DeFi derivatives and synthetic assets sector faces competition from established protocols and emerging solutions
UMA Regulatory Risks
- DeFi Oversight: Increasing regulatory scrutiny on decentralized financial protocols could impact UMA's operations and adoption
- Compliance Requirements: Potential future regulations regarding synthetic assets and financial derivatives may affect protocol functionality
- Jurisdictional Uncertainty: Varying global regulatory approaches to decentralized financial contracts create operational complexity
UMA Technical Risks
- Smart Contract Vulnerabilities: Despite audits, complex smart contract systems may contain undiscovered bugs or exploits
- Oracle Dependence: UMA's optimistic oracle mechanism requires careful design to prevent manipulation or disputes
- Network Dependencies: As an Ethereum-based protocol, UMA is subject to Ethereum network congestion, gas fee fluctuations, and potential network issues
VI. Conclusion and Action Recommendations
UMA Investment Value Assessment
UMA represents a specialized decentralized financial infrastructure project focused on synthetic assets and financial contracts. While the protocol demonstrates technical innovation in its optimistic oracle design and flexible contract framework, investors should carefully consider the significant price decline from historical peaks and the competitive DeFi landscape. The project's long-term value proposition depends on continued protocol adoption, successful partnerships, and the broader growth of decentralized financial derivatives markets. Short-term risks include market volatility, regulatory uncertainty, and technical complexities inherent in DeFi protocols.
UMA Investment Recommendations
✅ Beginners: Start with small allocation (1-3% of crypto portfolio) and focus on understanding UMA's protocol mechanics before increasing exposure
✅ Experienced Investors: Consider UMA as a tactical DeFi sector allocation with active monitoring of protocol metrics and competitive positioning
✅ Institutional Investors: Evaluate UMA within a comprehensive DeFi derivatives strategy with appropriate risk management and due diligence on protocol security
UMA Trading Participation Methods
- Spot Trading: Direct purchase and holding of UMA tokens through Gate.com with access to multiple trading pairs
- Portfolio Integration: Include UMA as part of a diversified DeFi sector allocation alongside other protocol tokens
- Research-Based Approach: Monitor UMA protocol development, partnership announcements, and adoption metrics before making investment decisions
Cryptocurrency investment carries extremely high risks, and this article does not constitute investment advice. Investors should make cautious decisions based on their own risk tolerance and are advised to consult professional financial advisors. Never invest more than you can afford to lose.
FAQ
What is UMA? What are its main uses and technical features?
UMA is a decentralized oracle protocol enabling optimistic verification of real-world data on-chain. It allows creation of synthetic assets and price prediction markets with flexible dispute mechanisms. Its key technical feature is the optimistic oracle model, enabling cost-effective cross-chain data verification without relying on centralized price feeds.
What are the main factors affecting UMA token price?
UMA token price is primarily influenced by protocol adoption rates, total value locked (TVL) growth, oracle service demand, governance participation levels, and market sentiment in the Web3 ecosystem.
UMA的当前市场流动性和交易量如何?
UMA currently has a market cap of $73.14 million with 24-hour trading volume of $360.75K. Circulating supply stands at 89.21M tokens, indicating stable liquidity and consistent market activity.
What are UMA's advantages and disadvantages compared to other DeFi projects like Synthetix and Aave?
UMA excels in flexible cross-chain synthetic asset creation and oracle solutions. Advantages include innovative price feed mechanisms and developer-friendly infrastructure. Disadvantages include smaller ecosystem scale and lower liquidity depth compared to Synthetix and Aave's established market presence.
What is UMA's tokenomics and supply situation?
UMA has a capped maximum supply with strong circulation, providing long-term appreciation potential. Transparent token allocation enhances trust and reduces centralization risks. However, high FDV relative to current market cap may indicate overvaluation risks.
What are the risks to pay attention to when investing in UMA?
UMA contract investments face price volatility and liquidation risks that may cause significant losses. Investors should carefully manage positions and understand market trends before trading.
What is UMA's development roadmap and future plans?
UMA focuses on expanding platform functionality and enhancing user experience. Short-term priorities include improving infrastructure and product features. Future plans involve technological innovation, market expansion, and strengthening decentralized prediction capabilities.
How to predict UMA price trends through technical analysis?
Technical analysis predicts UMA price trends using moving averages, RSI, and support/resistance levels. Identify trend lines and breakout points to gauge price momentum. Volume and momentum indicators help confirm price direction changes and potential reversals.
How does UMA's governance token mechanism affect its price?
UMA's governance mechanism empowers token holders to vote on protocol improvements and data pricing, directly influencing token utility and demand. This decentralized control increases liquidity and market volatility, while voting participation can drive price appreciation through enhanced ecosystem value.
* The information is not intended to be and does not constitute financial advice or any other recommendation of any sort offered or endorsed by Gate.