This comprehensive analysis examines VANA's price trajectory from 2026 through 2031, offering professional forecasts for this innovative data monetization Layer 1 blockchain. Currently trading at $2.415 with a market cap of $74.38 million, VANA enables users to monetize personal data through Data DAOs. The article evaluates historical price patterns, market supply-demand dynamics, and ecosystem development to predict potential price ranges: $1.79-$2.92 in 2026, reaching $2.81-$5.69 by 2030-2031. It presents three investment methodologies—long-term holding, active trading, and strategic allocation—alongside robust risk management frameworks. The analysis examines supply mechanisms, technological development, regulatory considerations, and macroeconomic factors while addressing potential risks including market volatility and adoption challenges. Ideal for crypto investors seeking data-driven insights on VANA's investment potential on Gate and comprehensive guidance for portfolio positioning.
Introduction: VANA's Market Position and Investment Value
Vana (VANA) serves as an EVM-compatible Layer 1 blockchain that transforms personal data into tradable financial assets, enabling users to securely monetize their private information through Data DAOs and innovative proof mechanisms. Since its launch in 2024, VANA has established itself within the intersection of data ownership and AI economy. As of January 18, 2026, VANA maintains a market capitalization of approximately $74.38 million, with a circulating supply of around 30.8 million tokens, trading at approximately $2.415. This asset, operating as a bridge between Web2 and Web3 data ecosystems, is playing an increasingly relevant role in decentralized data monetization and AI model training infrastructure.
This article provides a comprehensive analysis of VANA's price trajectory from 2026 through 2031, incorporating historical patterns, market supply-demand dynamics, ecosystem development, and macroeconomic factors to deliver professional price forecasts and practical investment strategies for market participants.
I. VANA Price History Review and Market Status
VANA Historical Price Evolution Trajectory
- 2024: VANA launched on Gate.com with an initial price of $2.08, reaching a peak of $35.703 on December 17, 2024
- 2025: The token experienced significant downward pressure, declining to a low of $1.174 on October 10, 2025
- 2026: As of January 18, 2026, VANA is trading at $2.415, representing approximately a 93.24% decline from its all-time high
VANA Current Market Status
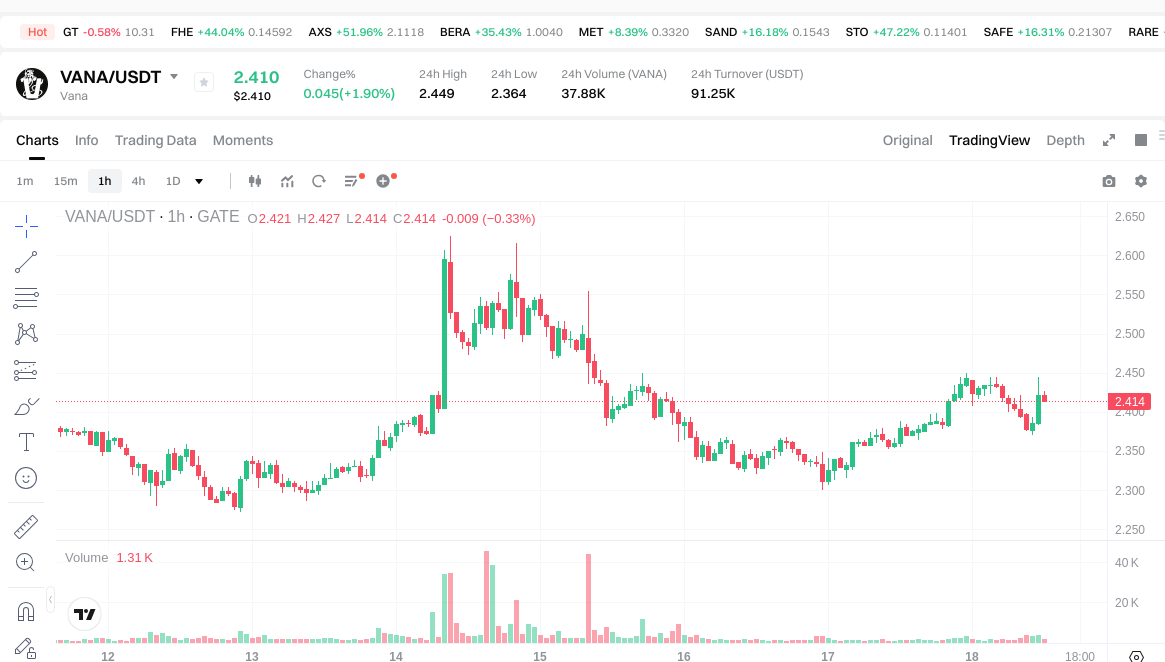
VANA is currently priced at $2.415 on January 18, 2026, with a 24-hour trading volume of $90,892.92. The token has shown a modest increase of 2.49% over the past 24 hours, with intraday prices ranging between $2.361 and $2.449.
From a short-term perspective, VANA has demonstrated positive momentum with a 1-hour change of -0.21% and a 7-day gain of 2.23%. However, the 30-day performance shows a decline of 8.23%, while the 1-year performance indicates a substantial decrease of 80.67%.
The current market capitalization stands at $74.38 million, with a fully diluted market cap of $289.8 million. With 30.8 million tokens in circulation out of a maximum supply of 120 million tokens, the circulating supply ratio is approximately 25.67%. VANA currently ranks #430 in the cryptocurrency market, holding a market dominance of 0.0085%.
The token is listed on 17 exchanges, with Gate.com being a primary trading venue. The market sentiment index registers at 49, indicating a neutral market outlook.
Click to view current VANA market price
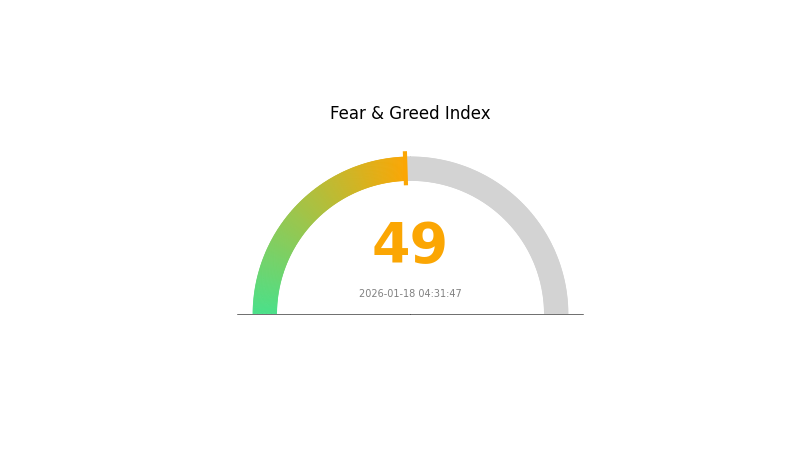
VANA Market Sentiment Indicator
2026-01-18 Fear and Greed Index: 49 (Neutral)
Click to view current Fear & Greed Index
The VANA market is currently in a neutral sentiment state with a fear and greed index reading of 49. This balanced position indicates that market participants are neither overly optimistic nor excessively pessimistic. Investors should maintain a measured approach, avoiding both excessive risk-taking and unnecessary caution. At neutral levels, market fundamentals and technical analysis become crucial for decision-making. Consider diversifying your portfolio and staying informed about project developments on Gate.com to make well-informed trading decisions during this stable market phase.
VANA Token Holder Distribution
The token holder distribution chart serves as a critical indicator for assessing the degree of decentralization within a cryptocurrency's ecosystem. By analyzing the concentration of tokens across different wallet addresses, this metric reveals whether the asset's ownership is broadly distributed among numerous participants or heavily concentrated in the hands of a few large holders. Such distribution patterns have profound implications for market stability, price discovery mechanisms, and the overall health of the token economy.
Based on the current holder distribution data for VANA, the concentration analysis reveals a relatively balanced distribution structure across the top addresses. The absence of extreme concentration—where a single entity or a small group of addresses controls an overwhelming majority of the circulating supply—suggests a moderate level of decentralization. This distribution pattern typically indicates that VANA has achieved a reasonable degree of token dispersal following its initial distribution phases, which can contribute to more organic price formation and reduced susceptibility to single-actor manipulation.
From a market structure perspective, the current holder distribution presents both opportunities and considerations. A well-distributed token base generally enhances liquidity across various price levels and reduces the risk of sudden supply shocks that could arise from large holders executing significant sell orders. However, investors should remain cognizant that holder distribution is a dynamic metric that evolves continuously as tokens circulate through secondary markets, staking mechanisms, and ecosystem activities. The current distribution snapshot reflects a market structure that supports sustainable growth while maintaining sufficient checks against excessive centralization that could undermine the project's long-term value proposition.
Click to view the current VANA Holder Distribution

| Top |
Address |
Holding Qty |
Holding (%) |
II. Core Factors Influencing VANA's Future Price
Supply Mechanism
- Token Economic Model: VANA has a total supply of 1 billion tokens, implementing a phased release mechanism. This structured approach to token distribution aims to balance market liquidity while managing potential supply-side pressure.
- Historical Patterns: Historical data suggests that token release events typically trigger short-term price fluctuations in cryptocurrency markets. These movements often reflect market participants' reactions to increased circulating supply.
- Current Impact: The ongoing release schedule may continue to influence VANA's price dynamics in the near term, with market participants closely monitoring unlock events and their potential effects on supply-demand equilibrium.
Market Adoption and Partnerships
- Data Liquidity Pools: VANA's ability to attract data contributors and validators to its data liquidity pools represents a significant determinant of the project's success. The platform's effectiveness in facilitating data exchange will likely correlate with adoption rates.
- Partnership Development: Strategic collaborations and ecosystem partnerships will play a vital role in expanding VANA's utility and market presence. The strength and scope of these relationships may directly impact token demand.
Technological Development
- Blockchain Infrastructure: Ongoing improvements to VANA's underlying blockchain infrastructure could enhance network performance, security, and scalability. These technical advancements may positively influence market perception and valuation.
- Platform Evolution: The development trajectory of VANA's data exchange platform, including new features and functionality improvements, will likely affect user adoption and, consequently, token utility and demand.
Macroeconomic and Market Conditions
- Market Volatility: The broader cryptocurrency market experiences inherent volatility that affects individual token prices. VANA's price movements may reflect these wider market trends alongside project-specific developments.
- Regulatory Environment: Policy changes and regulatory developments in key jurisdictions could impact VANA's operations and market accessibility. Evolving regulatory frameworks represent both opportunities and potential constraints for the project.
- Market Sentiment: Overall investor sentiment toward cryptocurrency markets and data-focused blockchain projects will likely influence VANA's price trajectory. Shifts in market psychology can amplify or dampen the effects of fundamental developments.
III. 2026-2031 VANA Price Prediction
2026 Outlook
- Conservative forecast: $1.79 - $2.42
- Neutral forecast: $2.42 (average price scenario)
- Optimistic forecast: $2.92 (requires favorable market conditions and sustained adoption momentum)
2027-2029 Outlook
- Market stage expectation: Transition from early growth phase to consolidation period, with potential expansion driven by ecosystem development and broader market recovery cycles
- Price range forecast:
- 2027: $1.44 - $2.96, representing approximately 10% growth
- 2028: $2.00 - $3.66, with 16% upward movement
- 2029: $1.85 - $4.34, showing 34% potential appreciation
- Key catalysts: Network adoption rates, technological implementations, regulatory clarity, and overall cryptocurrency market sentiment
2030-2031 Long-term Outlook
- Baseline scenario: $2.81 - $5.31 (assuming steady ecosystem growth and maintained market interest)
- Optimistic scenario: $4.55 - $5.69 (driven by significant protocol upgrades and expanded utility)
- Transformative scenario: Potential to reach upper ranges approaching $5.69 (contingent upon mass adoption, favorable regulatory frameworks, and sustained institutional participation)
- 2026-01-18: VANA trading within early-stage valuation range as market participants assess long-term viability
| Year |
Predicted High Price |
Predicted Average Price |
Predicted Low Price |
Price Change |
| 2026 |
2.92457 |
2.417 |
1.78858 |
0 |
| 2027 |
2.96457 |
2.67079 |
1.44222 |
10 |
| 2028 |
3.66298 |
2.81768 |
2.00055 |
16 |
| 2029 |
4.34204 |
3.24033 |
1.84699 |
34 |
| 2030 |
5.30766 |
3.79119 |
2.80548 |
56 |
| 2031 |
5.68678 |
4.54942 |
2.72965 |
88 |
IV. VANA Professional Investment Strategies and Risk Management
VANA Investment Methodology
(1) Long-term Holding Strategy
- Suitable for: Investors with a 3-5 year investment horizon who believe in the potential of data tokenization and AI economy transformation
- Operational Recommendations:
- Consider accumulating VANA during market corrections when the token trades significantly below its historical average
- Monitor key ecosystem developments such as new Data DAO launches and DLP integrations that may enhance long-term value
- Utilize secure storage solutions like Gate Web3 Wallet for long-term custody, ensuring private key security and enabling potential staking opportunities
(2) Active Trading Strategy
- Technical Analysis Tools:
- Moving Averages: Track 50-day and 200-day moving averages to identify potential trend reversals and support/resistance levels
- Volume Analysis: Monitor 24-hour trading volume changes to confirm price movements and identify potential breakout opportunities
- Swing Trading Key Points:
- Set clear entry and exit points based on support levels around recent low prices and resistance near historical highs
- Implement stop-loss orders to limit downside risk, particularly given VANA's price volatility
VANA Risk Management Framework
(1) Asset Allocation Principles
- Conservative Investors: 1-3% of crypto portfolio allocation
- Aggressive Investors: 5-8% of crypto portfolio allocation
- Professional Investors: 8-15% with active risk management protocols
(2) Risk Hedging Solutions
- Portfolio Diversification: Combine VANA holdings with established Layer 1 tokens and stablecoins to reduce concentration risk
- Position Sizing: Scale positions based on market volatility and personal risk tolerance, avoiding over-leverage
(3) Secure Storage Solutions
- Hot Wallet Recommendation: Gate Web3 Wallet for active trading and ecosystem participation
- Cold Storage Solution: Hardware wallets for long-term holdings exceeding investment comfort levels
- Security Precautions: Enable two-factor authentication, regularly update security settings, never share private keys or seed phrases, and verify all transaction addresses before confirming transfers
V. VANA Potential Risks and Challenges
VANA Market Risks
- High Volatility: VANA has experienced an 80.67% decline over the past year, demonstrating significant price volatility that may result in substantial losses
- Limited Trading History: With a launch date in December 2024, VANA has a relatively short trading history, making long-term price pattern analysis challenging
- Market Capitalization Concerns: With a market cap to fully diluted valuation ratio of 25.67%, significant token unlocks could create selling pressure
VANA Regulatory Risks
- Data Privacy Regulations: The project's focus on personal data monetization may face scrutiny under evolving data protection laws such as GDPR and similar regulations
- Securities Classification Uncertainty: Regulatory bodies may classify data tokens as securities, potentially impacting VANA's operational model
- Cross-border Compliance: Operating across multiple jurisdictions may expose the project to varying regulatory requirements and potential legal challenges
VANA Technical Risks
- Smart Contract Vulnerabilities: As an EVM-compatible blockchain, potential bugs or exploits in smart contracts could compromise user funds or data
- Network Security: Being a Layer 1 blockchain, VANA must maintain robust validator networks and consensus mechanisms to prevent attacks
- Adoption Challenges: The success of Data DAOs and DLPs depends on user adoption, and failure to attract sufficient participants could limit ecosystem growth
VI. Conclusion and Action Recommendations
VANA Investment Value Assessment
VANA represents an innovative approach to data monetization and AI economy infrastructure, positioning itself at the intersection of Web2 and Web3. The project's unique value proposition of transforming personal data into tradable assets addresses growing concerns about data ownership and value distribution. However, investors should consider the token's recent price performance, with an 80.67% decline over the past year and a current market dominance of only 0.0085%. The circulating supply represents approximately 25.67% of total supply, suggesting potential dilution risks. While the long-term vision of democratizing data ownership holds promise, short-term volatility and adoption uncertainties present considerable risks.
VANA Investment Recommendations
✅ Beginners: Start with minimal position sizes (1-2% of crypto portfolio) and focus on understanding the project fundamentals before increasing exposure. Use Gate.com's educational resources to learn about data tokenization concepts.
✅ Experienced Investors: Consider VANA as a speculative allocation within a diversified crypto portfolio, monitoring ecosystem developments such as new Data DAO launches and partnership announcements. Implement disciplined risk management with predetermined exit strategies.
✅ Institutional Investors: Conduct thorough due diligence on the project's technical architecture, tokenomics, and regulatory compliance. Consider pilot programs to evaluate data monetization use cases before significant capital deployment.
VANA Trading Participation Methods
- Spot Trading: Purchase VANA directly on Gate.com for long-term holding or medium-term position building
- Dollar-Cost Averaging: Implement systematic purchase plans to reduce timing risk and average entry costs over time
- Staking Participation: Explore staking opportunities within the Vana ecosystem to generate potential yields while supporting network security
Cryptocurrency investment carries extremely high risks, and this article does not constitute investment advice. Investors should make prudent decisions based on their own risk tolerance and are advised to consult professional financial advisors. Never invest more than you can afford to lose.
FAQ
What is the historical price movement of VANA tokens?
VANA has experienced significant volatility, trading between its all-time high of $35.53 and all-time low of $1.20. In recent 24 hours, it fluctuated between $2.398 and $2.628, reflecting active market dynamics and growing investor interest in the token.
What are the main factors affecting VANA price?
VANA price is primarily driven by supply and demand dynamics, market sentiment influenced by news and investor behavior, ecosystem development, adoption rates, and overall cryptocurrency market conditions.
What are professional analysts' price predictions for VANA?
Professional analysts forecast VANA could reach approximately $126.59 by early 2030, indicating strong growth potential over the coming years based on current market trends and technological developments.
VANA enables data pools to issue their own tokens, providing governance rights and revenue distribution. This approach enhances data asset liquidity and value creation in the AI era, differentiated from traditional AI tokens.
What are the main risks of investing in VANA?
VANA investment risks include market volatility, regulatory uncertainty, and technical security concerns. As an emerging cryptocurrency, VANA faces price fluctuations and potential policy changes that could impact its value and adoption.
What are VANA's technical foundation and application scenarios?
VANA's technical foundation is data-driven AI development, primarily applied in AI data supply chains. It provides high-quality data to support AI model training and enhance AI performance through decentralized data tokenization.
* The information is not intended to be and does not constitute financial advice or any other recommendation of any sort offered or endorsed by Gate.