This comprehensive analysis examines Chia (XCH) cryptocurrency's market position and provides expert price forecasts from 2026 to 2031. The article reviews XCH's price history, current market status at $4.95, and key factors influencing future performance, including supply mechanisms, macroeconomic conditions, and ecosystem development. Readers will discover detailed price predictions ranging from $2.82 to $9.77, based on conservative, neutral, and optimistic scenarios. The guide offers practical investment strategies for different investor types, including long-term holding and active trading approaches on Gate, plus comprehensive risk management frameworks. Essential sections address market volatility, regulatory uncertainty, technical challenges, and provide actionable recommendations for beginners, experienced investors, and institutions evaluating XCH exposure.
Introduction: XCH's Market Position and Investment Value
Chia (XCH), positioned as an innovative blockchain project utilizing proof of space and time consensus mechanism, has been developing its ecosystem since its launch in 2021. As of 2026, Chia maintains a market capitalization of approximately $72.39 million, with a circulating supply of around 14.62 million tokens, and the price hovering around $4.95. This asset, founded by legendary programmer Bram Cohen, is playing an increasingly important role in sustainable blockchain infrastructure through its unique approach of leveraging unused hard disk storage space for verification.
This article will comprehensively analyze XCH's price trends from 2026 to 2031, combining historical patterns, market supply and demand dynamics, ecosystem development, and macroeconomic environment to provide investors with professional price forecasts and practical investment strategies.
I. XCH Price History Review and Market Status
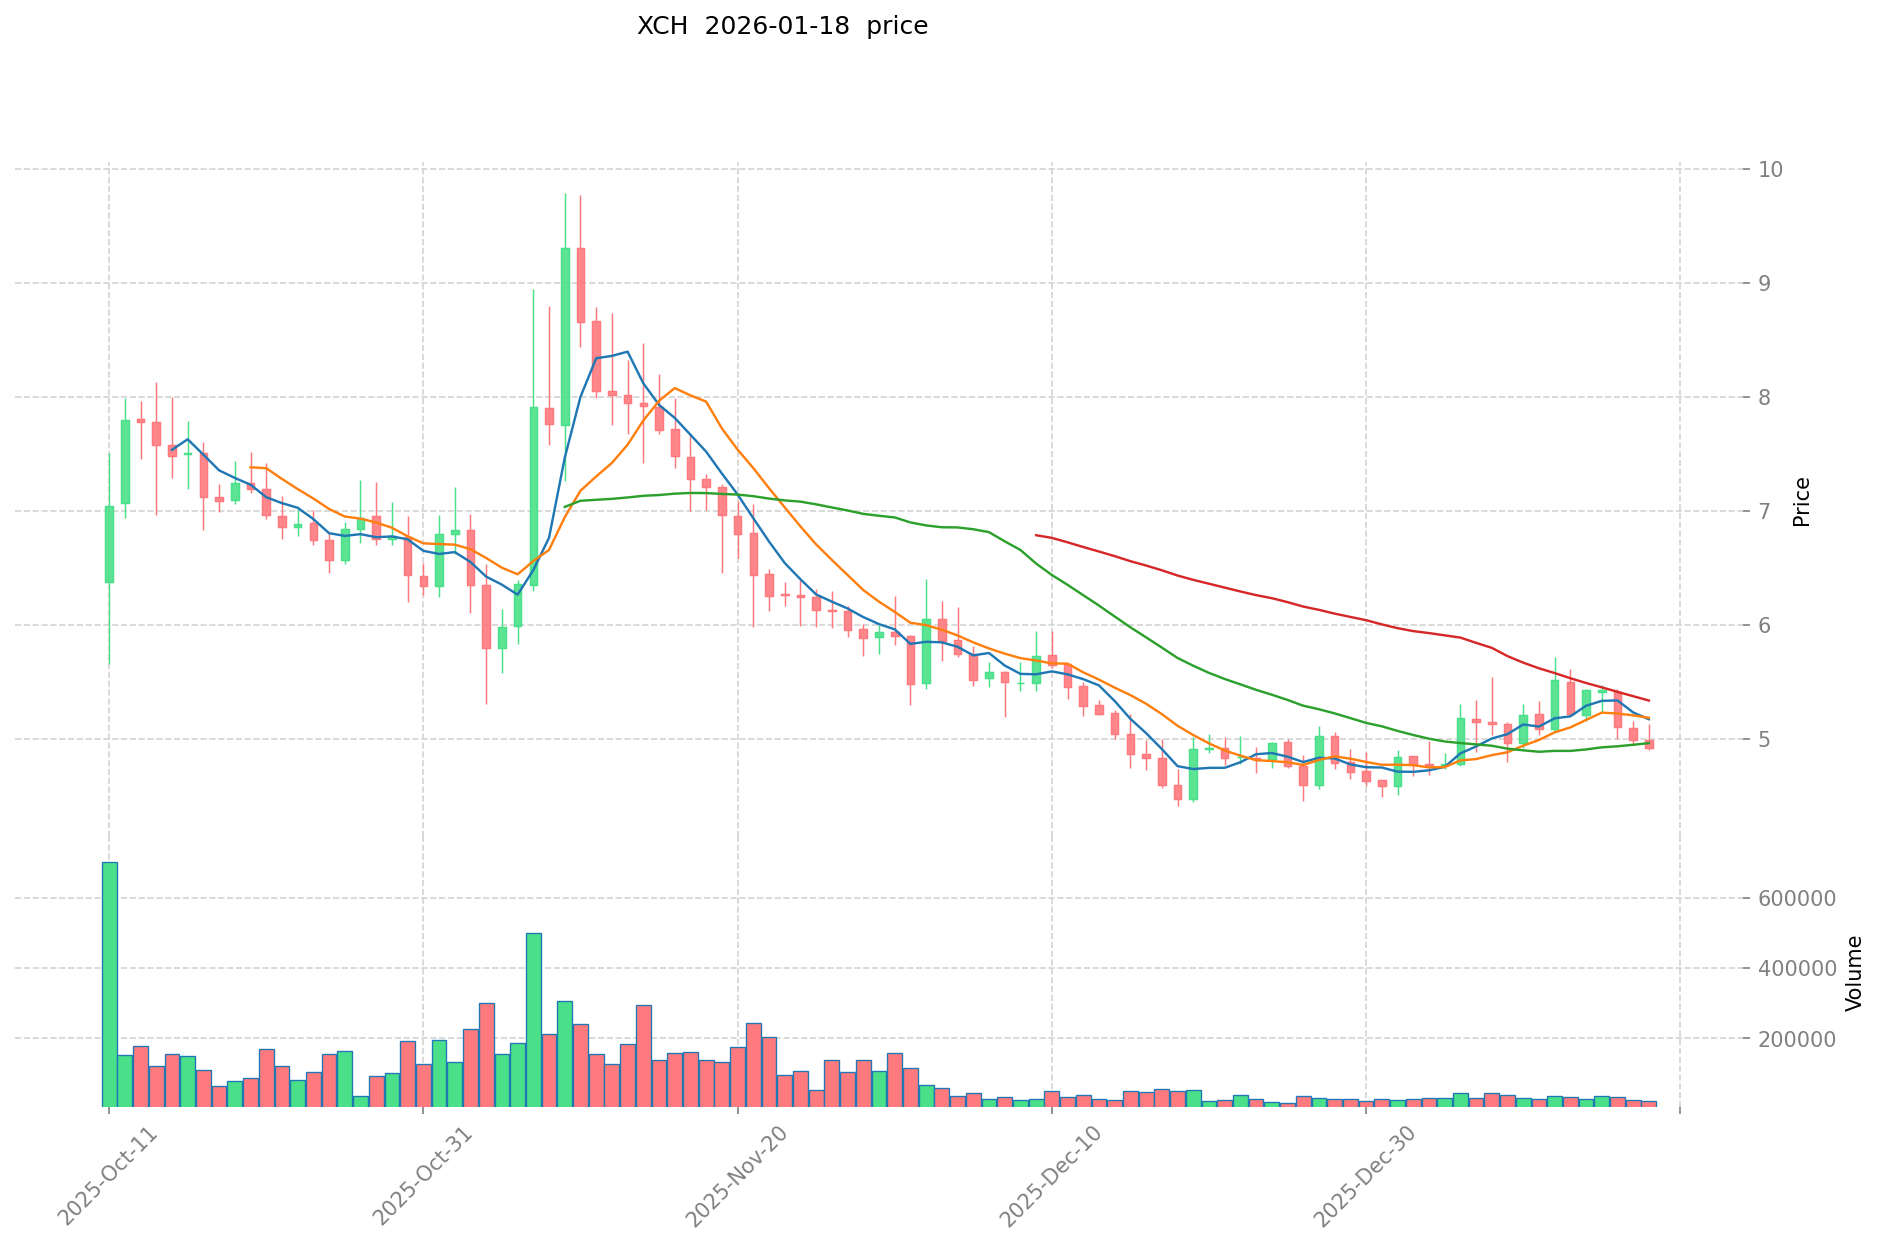
XCH Historical Price Evolution Trajectory
- 2021: Chia Network launched in May, experiencing significant price volatility from an all-time high of $1,645.12 on May 15, 2021, followed by a substantial correction throughout the remainder of the year.
- 2022-2024: During this period, XCH entered a prolonged bear market phase, with prices gradually declining as market conditions remained challenging.
- 2025: The token experienced continued downward pressure, reaching a historical low of $4.42 on December 19, 2025, marking a significant decline from its launch period.
XCH Current Market Status
As of January 18, 2026, XCH is trading at $4.95, showing modest recovery from its recent low. The token has demonstrated a 0.48% increase over the past 24 hours, with trading activity generating a daily volume of $137,098. Over the past 30 days, XCH has shown positive momentum with a 10.57% gain, though the 7-day trend reflects a decline of 6.99%.
The current market capitalization stands at approximately $72.39 million, with XCH ranking 432nd among cryptocurrencies. The circulating supply represents 44.32% of the total supply, with 14.62 million XCH tokens in circulation out of a total supply of 33 million tokens. The fully diluted market cap is calculated at $163.35 million. Trading within the past 24 hours has seen XCH fluctuate between a high of $5.129 and a low of $4.85.
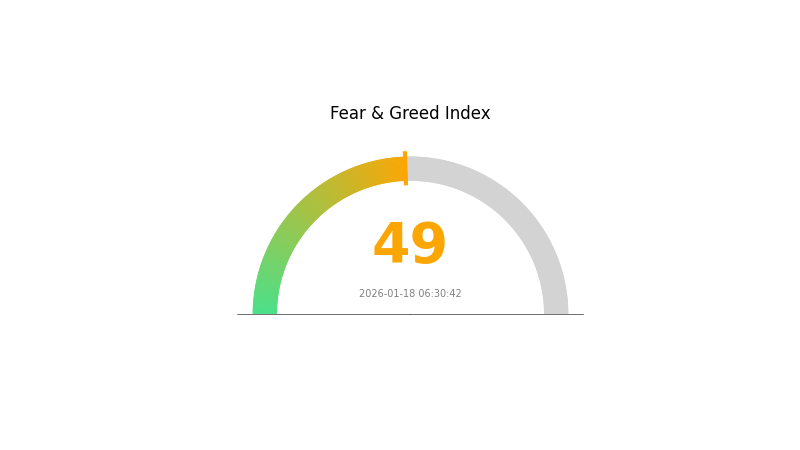
The market sentiment indicator currently registers at a neutral level of 49, suggesting balanced market conditions. XCH maintains a presence on 7 exchanges and is actively traded on Gate.com. The token's market dominance remains minimal at 0.0048% of the total cryptocurrency market.
Click to view current XCH market price
XCH Market Sentiment Indicator
2026-01-18 Fear and Greed Index: 49 (Neutral)
Click to view the current Fear & Greed Index
The cryptocurrency market is currently displaying neutral sentiment with a Fear and Greed Index reading of 49. This balanced positioning suggests investors maintain a cautious yet open approach to market opportunities. Neither excessive fear nor unbridled greed is dominating market behavior, indicating a healthy equilibrium. Traders should monitor this neutral zone closely, as it may precede significant directional shifts. Such conditions often reward disciplined strategies focused on fundamental analysis rather than emotional trading decisions.
XCH Holdings Distribution
The holdings distribution chart represents the allocation of total XCH supply across different wallet addresses, providing crucial insights into the decentralization level and market structure of the asset. This metric is essential for understanding potential market manipulation risks and the overall health of the token's distribution ecosystem.
According to current on-chain data, XCH exhibits a relatively high concentration pattern. The top address holds approximately 10,437.50K XCH, representing 30.49% of the total circulating supply, while the second-largest address controls 4,437.60K XCH (12.96%). The top three addresses collectively account for over 50% of the total supply, with the top five addresses holding nearly 57% combined. This concentration level suggests significant centralization in the XCH ecosystem, which may pose concerns for investors seeking genuinely decentralized assets.
Such concentrated holdings distribution could amplify market volatility and increase susceptibility to price manipulation. Large holders (commonly known as "whales") possess substantial market-moving power, capable of triggering significant price fluctuations through relatively modest trading activities. The "Others" category, representing 43.28% of holdings distributed among numerous smaller addresses, indicates some degree of retail participation, yet the dominance of top addresses remains a defining characteristic of XCH's current market structure. This distribution pattern reflects a blockchain ecosystem still in its maturation phase, where further decentralization would enhance market stability and resilience.
Click to view current XCH Holdings Distribution
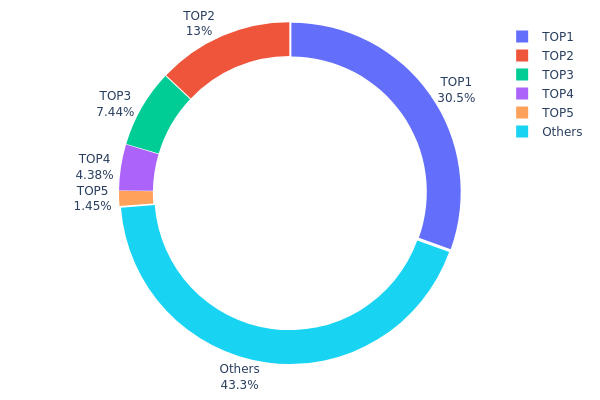
| Top |
Address |
Holding Qty |
Holding (%) |
| 1 |
xch1y6...nyzvgy |
10437.50K |
30.49% |
| 2 |
xch1yx...lh08yl |
4437.60K |
12.96% |
| 3 |
xch1au...srtdav |
2545.54K |
7.44% |
| 4 |
xch197...c5nhnx |
1500.00K |
4.38% |
| 5 |
xch12p...zhnldc |
495.01K |
1.45% |
| - |
Others |
14818.14K |
43.28% |
II. Core Factors Influencing XCH's Future Price
Supply Mechanism
- Halving Events: XCH undergoes periodic halving, with block rewards gradually decreasing over time.
- Historical Pattern: Past halving events have frequently driven price increases due to supply contraction.
- Current Impact: The ongoing reduction in block rewards may create supply constraints that could influence price dynamics.
Macroeconomic Environment
- Market Supply and Demand: Market supply-demand dynamics serve as direct factors affecting XCH price. When market demand for XCH increases, such as when more investors are optimistic about its development prospects and purchase XCH for investment or payment scenarios, price movements may reflect these changing conditions.
- Market Trends and Investor Sentiment: Investor confidence and broader market trends play significant roles in shaping price trajectories.
Technical Development and Ecosystem Building
- Network Hashrate Growth: The overall network computing power growth curve represents an important factor in the ecosystem's technical development.
- Mining Technology Evolution: The advancement of mining technology and equipment arrangements continue to influence the network's technical foundation.
- Economic Model Considerations: The token's economic model includes production mechanisms that contribute to the overall ecosystem structure.
III. 2026-2031 XCH Price Prediction
2026 Outlook
- Conservative Prediction: $2.82 - $4.95
- Neutral Prediction: $4.95 - $5.84
- Optimistic Prediction: $5.84 (requires favorable market conditions and increased adoption)
2027-2029 Outlook
- Market Stage Expectation: The period from 2027 to 2029 may witness gradual market maturation, with XCH potentially benefiting from broader blockchain storage solutions adoption and network effects. The predicted price change of 8% in 2027 suggests modest growth, while the anticipated 37% change by 2029 indicates potential acceleration in market interest.
- Price Range Predictions:
- 2027: $5.07 - $6.41
- 2028: $3.25 - $7.73
- 2029: $6.34 - $8.45
- Key Catalysts: Network development progress, storage efficiency improvements, strategic partnerships, and overall cryptocurrency market sentiment could serve as primary drivers for price movement during this phase.
2030-2031 Long-term Outlook
- Baseline Scenario: $4.58 - $8.78 (assuming steady network growth and stable market conditions)
- Optimistic Scenario: $7.63 - $9.77 (assuming enhanced ecosystem development and increased institutional interest)
- Transformative Scenario: Above $9.77 (under extremely favorable conditions including widespread adoption of proof-of-space consensus and significant technological breakthroughs)
- 2026-01-18: XCH trading within the predicted range of $2.82 - $5.84 (early-stage baseline establishment)
| Year |
Predicted High Price |
Predicted Average Price |
Predicted Low Price |
Price Change |
| 2026 |
5.8351 |
4.945 |
2.81865 |
0 |
| 2027 |
6.41416 |
5.39005 |
5.06665 |
8 |
| 2028 |
7.73176 |
5.9021 |
3.24616 |
19 |
| 2029 |
8.45299 |
6.81693 |
6.33975 |
37 |
| 2030 |
8.78021 |
7.63496 |
4.58098 |
54 |
| 2031 |
9.76703 |
8.20758 |
5.33493 |
65 |
IV. XCH Professional Investment Strategy and Risk Management
XCH Investment Methodology
(1) Long-term Holding Strategy
- Suitable for: Investors seeking exposure to alternative consensus mechanisms with a multi-year investment horizon
- Operation Suggestions:
- Consider accumulating positions during market corrections when XCH trades closer to its historical low of $4.42
- Monitor the project's development progress and community growth metrics before committing significant capital
- Utilize Gate Web3 Wallet for secure long-term storage with proper backup procedures
(2) Active Trading Strategy
- Technical Analysis Tools:
- Volume Analysis: With 24-hour trading volume at $137,098, traders should monitor volume spikes that may indicate trend reversals
- Support and Resistance Levels: Current 24-hour range between $4.85 and $5.129 provides reference points for entry and exit decisions
- Swing Trading Considerations:
- The 7-day decline of 6.99% suggests potential short-term volatility that active traders may exploit
- Given the relatively low market cap of approximately $72.39 million, traders should be cautious of liquidity constraints
XCH Risk Management Framework
(1) Asset Allocation Principles
- Conservative Investors: 1-2% of crypto portfolio allocation
- Moderate Investors: 3-5% of crypto portfolio allocation
- Professional Investors: Up to 10% of crypto portfolio allocation, with active monitoring
(2) Risk Hedging Approaches
- Portfolio Diversification: Combine XCH holdings with established cryptocurrencies to balance risk exposure
- Position Sizing: Limit single-position exposure given XCH's ranking at #432 by market capitalization
(3) Secure Storage Solutions
- Hot Wallet Recommendation: Gate Web3 Wallet for convenient trading and moderate holdings
- Cold Storage Strategy: For larger holdings, consider hardware wallet solutions with proper backup protocols
- Security Precautions: Enable two-factor authentication, maintain multiple backup copies of recovery phrases, and never share private keys
V. XCH Potential Risks and Challenges
XCH Market Risks
- High Volatility: The 1-year price decline of 79.09% demonstrates significant downside volatility potential
- Limited Liquidity: Trading volume of $137,098 suggests relatively thin markets, which may lead to slippage during larger transactions
- Market Cap Vulnerability: With a market capitalization below $73 million and only 44.32% of fully diluted valuation circulating, price discovery remains uncertain
XCH Regulatory Risks
- Proof-of-Space Mechanism Uncertainty: Regulatory frameworks for alternative consensus mechanisms remain evolving across different jurisdictions
- Energy Efficiency Claims: While positioned as an eco-friendly alternative, regulatory scrutiny of all cryptocurrencies continues to intensify globally
- Exchange Availability: Currently listed on 7 exchanges, limited accessibility may impact liquidity and regulatory compliance options
XCH Technical Risks
- Network Adoption: The success of Chia's unique proof-of-space-and-time consensus mechanism depends on sustained network growth and hard drive space commitment
- Competition: Numerous alternative consensus mechanisms compete for market attention and developer resources
- Development Progress: Long-term viability requires continued technical innovation and ecosystem expansion
VI. Conclusion and Action Recommendations
XCH Investment Value Assessment
Chia (XCH) represents an experimental approach to blockchain consensus through its proof-of-space-and-time mechanism, founded by BitTorrent creator Bram Cohen. While the project offers theoretical advantages in energy efficiency compared to traditional proof-of-work systems, investors must weigh this innovation against significant challenges. The token has experienced substantial decline from its all-time high of $1,645.12 in May 2021 to current levels around $4.95, reflecting both market-wide correction and project-specific headwinds. With only 44.32% of total supply in circulation and limited exchange availability, price volatility may continue. The project's long-term value proposition depends on successful ecosystem development and broader adoption of its storage-based consensus model.
XCH Investment Recommendations
✅ Beginners: Avoid or limit exposure to minimal allocation (under 1% of crypto portfolio) until gaining more market experience and understanding of alternative consensus mechanisms
✅ Experienced Investors: Consider small speculative positions (2-5% of crypto portfolio) with clear stop-loss levels, viewing XCH as a high-risk venture investment in alternative blockchain technology
✅ Institutional Investors: Conduct thorough due diligence on technical viability, team execution capacity, and competitive landscape before considering strategic allocation as part of diversified blockchain technology exposure
XCH Trading Participation Methods
- Spot Trading: Purchase XCH directly on Gate.com with competitive trading fees and reliable execution
- Dollar-Cost Averaging: Reduce timing risk by establishing regular purchase intervals over extended periods
- Risk-Adjusted Sizing: Calculate position sizes based on personal risk tolerance, considering XCH's volatility profile and limited liquidity
Cryptocurrency investment carries extreme risk. This article does not constitute investment advice. Investors should make prudent decisions based on their own risk tolerance and are advised to consult professional financial advisors. Never invest more than you can afford to lose.
FAQ
What price could XCH reach in the future?
Based on price prediction models, XCH is projected to reach $8.11 by 2028, $17.89 by 2030, and potentially $113.93 by 2036, depending on market conditions and adoption growth.
What are the main factors affecting Chia coin (XCH) price?
XCH price is primarily influenced by network adoption rate, mining participation levels, and storage hardware costs. Higher mining activity increases supply, while declining hardware costs improve mining efficiency and profitability.
How to predict XCH price? What analysis methods are available?
Use technical analysis with moving averages and RSI indicators, combined with fundamental analysis of Chia Network development. Analyze historical price data, trading volume trends, and on-chain metrics. Monitor market sentiment and adoption rates for accurate XCH price forecasting.
XCH reached an all-time high of $1,934.50. The token has experienced significant volatility since its launch. While specific all-time low data varies by source, XCH has demonstrated the typical market cycles of emerging blockchain projects, with substantial price fluctuations reflecting market sentiment and adoption phases.
Which is more important in XCH price prediction: technical analysis or fundamental analysis?
Both technical and fundamental analysis matter equally for XCH price prediction. Technical analysis captures short-term market trends through price patterns and indicators, while fundamental analysis evaluates long-term value. Combining both provides the most comprehensive prediction perspective.
How does Chia mining difficulty changes affect XCH price?
Increased difficulty reduces individual miners' block-winning probability, potentially lowering XCH price as fewer new coins are issued and investor confidence may decline. Conversely, decreased difficulty could support price by improving mining profitability.
* The information is not intended to be and does not constitute financial advice or any other recommendation of any sort offered or endorsed by Gate.