This comprehensive guide analyzes eCash (XEC) pricing dynamics and investment strategies for 2026-2031, providing data-driven insights for cryptocurrency investors. The article examines XEC's market position with current trading at $0.00001165, market cap of $232.71 million, and detailed price scenarios ranging from $0.00001 to $0.00003 across the forecast period. It evaluates core price drivers including supply-demand mechanics, market adoption rates, technological development, and macroeconomic conditions affecting altcoin performance. The guide presents tailored investment methodologies—long-term holding via dollar-cost averaging and active trading with technical indicators—alongside comprehensive risk management frameworks suitable for different investor profiles. Critical analysis addresses market volatility (-67.46% annual decline), regulatory uncertainties, and competitive challenges, while recommending position sizing and secure storage solutions via Gate exchange. Designed for beginners through insti
Introduction: XEC's Market Position and Investment Value
eCash (XEC), positioned as a cryptocurrency designed for electronic cash payments, has been evolving since its rebranding from Bitcoin Cash ABC (BCHA) in 2021 with a 1:1,000,000 conversion ratio. As of January 16, 2026, eCash has achieved a market capitalization of approximately $232.71 million, with a circulating supply of about 19.98 trillion tokens, and the price maintains around $0.00001165. This digital asset, which enables direct peer-to-peer payments without requiring traditional bank accounts and operates across borders globally, is playing an increasingly relevant role in the digital payment space.
This article will comprehensively analyze XEC's price trends from 2026 to 2031, combining historical patterns, market supply and demand dynamics, ecosystem development, and macroeconomic conditions to provide investors with professional price forecasts and practical investment strategies.
I. XEC Price History Review and Market Status
XEC Historical Price Evolution Trajectory
- 2021: eCash (XEC) officially launched through a brand upgrade from Bitcoin Cash ABC (BCHA) with a 1:1,000,000 token distribution ratio. On September 5, 2021, the price reached its historical peak at $0.00038001.
- 2022-2024: The cryptocurrency entered a prolonged adjustment period, with price experiencing significant fluctuations alongside broader market cycles.
- 2025: The token witnessed substantial volatility, with the price declining from higher levels. On December 19, 2025, XEC recorded its historical low at $0.00000995.
XEC Current Market Situation
As of January 16, 2026, XEC is trading at $0.00001165, representing a decline of 3.47% over the past 24 hours. The 24-hour trading volume stands at approximately $21,828.56, with the price fluctuating between $0.00001151 and $0.0000121 during this period.
The cryptocurrency maintains a market capitalization of $232.71 million, ranking 218th in the overall market. With a circulating supply of 19.98 trillion XEC tokens out of a maximum supply of 21 trillion tokens, the circulation ratio has reached 95.12%. The market share currently stands at 0.0068%, while the market cap to fully diluted valuation ratio is at 95.12%.
Over different time horizons, XEC has shown varied performance: a 1.19% decrease in the past hour, a 1.099% decline over the past week, a 6.59% increase over the past 30 days, and a 67.46% decline over the past year. The current market sentiment index indicates a reading of 61, suggesting a state of greed among market participants.
The token is currently listed on 24 exchanges and maintains availability for trading on Gate.com.
Click to view current XEC market price

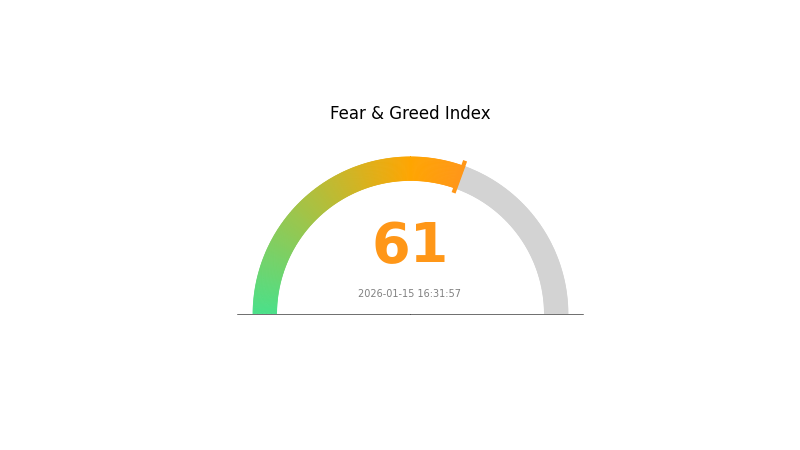
XEC Market Sentiment Indicator
2026-01-15 Fear and Greed Index: 61 (Greed)
Click to view current Fear & Greed Index
The XEC market is currently operating under conditions of greed, with the Fear and Greed Index standing at 61. This reading indicates that market participants are displaying elevated optimism and risk appetite. When the index reaches the greed zone, investors typically show greater willingness to take on positions and pursue gains. However, such sentiment peaks often warrant caution, as they may precede market corrections. Traders should balance bullish momentum with prudent risk management strategies and remain vigilant for potential market reversals during periods of extreme greed.
XEC Holding Distribution
The holding distribution chart reflects the concentration of token ownership across different wallet addresses on the blockchain network. By analyzing the proportion held by top addresses versus smaller holders, this metric provides insights into the decentralization level and potential market manipulation risks inherent in the token's ecosystem.
According to current data, XEC exhibits a relatively high concentration pattern. The top address alone controls approximately 4.89 trillion XEC tokens, accounting for 24.47% of the total circulating supply. The top five addresses collectively hold 6.74 trillion tokens, representing 33.76% of the total supply. This concentration level suggests that nearly one-third of XEC tokens are controlled by a small group of major holders, while the remaining 66.24% is distributed among other addresses.
This distribution structure presents both opportunities and risks for XEC's market dynamics. The significant concentration among top addresses could amplify price volatility, as large-scale movements by these whale addresses may trigger substantial market reactions. However, the fact that over two-thirds of tokens remain distributed among smaller holders indicates a reasonable degree of decentralization, which helps maintain on-chain structural stability. From a market manipulation perspective, while major holders possess considerable influence, the diversified distribution among other addresses provides a buffer against complete market control by any single entity.
Click to view current XEC Holding Distribution

| Top |
Address |
Holding Qty |
Holding (%) |
| 1 |
qrdraf...da4hcz |
4888407976.74K |
24.47% |
| 2 |
qranla...gkcprp |
600000000.00K |
3.00% |
| 3 |
qqshdv...m6kej2 |
570473107.16K |
2.86% |
| 4 |
qre24q...28z85p |
465282178.97K |
2.33% |
| 5 |
qp9ay2...czkrym |
218786408.65K |
1.10% |
| - |
Others |
13230777475.27K |
66.24% |
II. Core Factors Influencing XEC's Future Price
Supply and Demand Dynamics
XEC's future price trajectory is fundamentally shaped by the balance between market supply and demand. As adoption expands and more users engage with the ecosystem, increased demand pressure may emerge. Conversely, token distribution patterns and circulation velocity also play critical roles in determining price stability. Market participants should monitor how these supply-demand dynamics evolve in response to broader market conditions.
Market Adoption and Sentiment
Investor sentiment remains a key driver of XEC's price movements. Market psychology, influenced by news events, social media discussions, and overall cryptocurrency market trends, can create significant volatility. The degree to which XEC gains acceptance among retail and institutional participants will directly impact its valuation. Positive sentiment driven by technological milestones or ecosystem growth tends to support upward price momentum.
Technology Development
Technological advancement forms another crucial pillar affecting XEC's value proposition. Continuous improvements in scalability, security, and functionality enhance the token's utility and competitive positioning within the broader blockchain landscape. Development activity, protocol upgrades, and the successful implementation of technical roadmaps contribute to long-term confidence among stakeholders.
Overall Market Trends
XEC does not exist in isolation; its price performance correlates with broader cryptocurrency market cycles. Bitcoin and Ethereum trends often set the tone for altcoin movements, including XEC. Macroeconomic factors such as regulatory developments, institutional investment flows, and global economic conditions create the backdrop against which XEC trades. Understanding these interconnected market forces provides essential context for price analysis.
III. 2026-2031 XEC Price Prediction
2026 Outlook
- Conservative Prediction: $0.00001
- Neutral Prediction: $0.00001
- Optimistic Prediction: $0.00002 (requires favorable market conditions and increased adoption)
2027-2029 Outlook
- Market Stage Expectation: The token may enter a gradual growth phase as the broader cryptocurrency market matures and technical developments potentially enhance utility.
- Price Range Predictions:
- 2027: $0.00001 - $0.00002
- 2028: $0.00001 - $0.00002
- 2029: $0.00002 - $0.00003
- Key Catalysts: Network upgrades, expanding use cases, broader market recovery cycles, and sustained community engagement could serve as primary drivers for price appreciation.
2030-2031 Long-term Outlook
- Baseline Scenario: $0.00002 - $0.00003 (assuming steady ecosystem development and stable market conditions)
- Optimistic Scenario: $0.00003 (contingent upon significant technological breakthroughs and mainstream adoption acceleration)
- Transformative Scenario: Above $0.00003 (would require exceptional market conditions, major institutional adoption, and substantial network effect expansion)
- 2026-01-16: XEC $0.00001 (current baseline price level as market establishes initial positioning)
| Year |
Predicted High Price |
Predicted Average Price |
Predicted Low Price |
Price Change |
| 2026 |
0.00002 |
0.00001 |
0.00001 |
0 |
| 2027 |
0.00002 |
0.00001 |
0.00001 |
17 |
| 2028 |
0.00002 |
0.00002 |
0.00001 |
46 |
| 2029 |
0.00003 |
0.00002 |
0.00002 |
78 |
| 2030 |
0.00003 |
0.00003 |
0.00002 |
116 |
| 2031 |
0.00003 |
0.00003 |
0.00003 |
133 |
IV. XEC Professional Investment Strategy and Risk Management
XEC Investment Methodology
(I) Long-term Holding Strategy
- Suitable for: Investors seeking exposure to electronic cash technology with a multi-year investment horizon
- Operational Recommendations:
- Consider dollar-cost averaging (DCA) to build positions gradually, mitigating entry timing risk
- Monitor network development milestones and adoption metrics to assess fundamental progress
- Storage Solution: Use Gate Web3 Wallet for secure custody with multi-signature capabilities for larger holdings
(II) Active Trading Strategy
- Technical Analysis Tools:
- Moving Averages: Track 50-day and 200-day moving averages to identify potential trend reversals and momentum shifts
- Relative Strength Index (RSI): Monitor overbought (>70) and oversold (<30) conditions to time entry and exit points
- Swing Trading Considerations:
- Given XEC's volatility (24-hour change: -3.47%), establish clear stop-loss levels at 5-8% below entry points
- Target profit-taking zones at key resistance levels, considering the token's historical price range
XEC Risk Management Framework
(I) Asset Allocation Principles
- Conservative Investors: 1-2% of cryptocurrency portfolio allocation
- Aggressive Investors: 3-5% of cryptocurrency portfolio allocation
- Professional Investors: Up to 8% depending on conviction level and risk management protocols
(II) Risk Hedging Solutions
- Portfolio Diversification: Balance XEC exposure with established cryptocurrencies and stablecoins to reduce concentration risk
- Position Sizing: Limit individual position size to prevent excessive exposure to single-asset volatility
(III) Secure Storage Solutions
- Hot Wallet Recommendation: Gate Web3 Wallet for active trading and convenient access to liquidity
- Cold Storage Solution: Hardware wallet solutions for long-term holdings exceeding trading requirements
- Security Precautions: Enable two-factor authentication, regularly update security protocols, and never share private keys or seed phrases
V. XEC Potential Risks and Challenges
XEC Market Risks
- Price Volatility: XEC exhibits significant price fluctuations with a 1-year decline of -67.46%, indicating high market volatility
- Liquidity Concerns: With a market capitalization of approximately $232.7 million and ranking #218, liquidity may be limited during market stress
- Market Sentiment: Current market dominance of 0.0068% suggests limited mainstream adoption and susceptibility to broader market movements
XEC Regulatory Risks
- Electronic Cash Classification: Evolving regulatory frameworks for digital payment systems may impact XEC's operational environment
- Cross-border Transaction Scrutiny: As XEC facilitates international payments, increased regulatory oversight of cross-border cryptocurrency transfers could affect utility
- Compliance Requirements: Future regulatory mandates for cryptocurrency payment networks may necessitate protocol modifications
XEC Technical Risks
- Network Security: As a fork of Bitcoin Cash, maintaining robust security while scaling the network presents ongoing technical challenges
- Development Continuity: Long-term protocol development depends on sustained team commitment and community support
- Competitive Landscape: Numerous competing electronic payment cryptocurrencies may limit XEC's market differentiation and adoption potential
VI. Conclusion and Action Recommendations
XEC Investment Value Assessment
XEC presents a specialized opportunity within the electronic cash segment of the cryptocurrency market. While the project aims to provide a scalable payment solution with global accessibility, investors should carefully weigh the significant price volatility (-67.46% over one year) and modest market capitalization against the long-term vision of widespread adoption. The token's circulating supply represents 95.12% of maximum supply, indicating limited future dilution concerns. However, the competitive landscape and regulatory uncertainties introduce considerable risk factors that require ongoing monitoring.
XEC Investment Recommendations
✅ Beginners: Start with minimal exposure (under 1% of cryptocurrency portfolio) to understand market dynamics; use dollar-cost averaging to mitigate timing risk
✅ Experienced Investors: Consider XEC as a speculative allocation (2-4% of cryptocurrency portfolio) with strict stop-loss protocols and active monitoring of development milestones
✅ Institutional Investors: Conduct thorough due diligence on protocol development roadmap and regulatory positioning before allocating capital; implement comprehensive risk management frameworks
XEC Trading Participation Methods
- Spot Trading: Purchase XEC directly on Gate.com through spot markets for immediate ownership and full custody control
- Gradual Accumulation: Implement systematic investment plans through Gate.com to average entry costs over time
- Active Monitoring: Utilize Gate.com's trading tools and analytics to track price movements, volume trends, and market sentiment indicators
Cryptocurrency investment carries extremely high risk, and this article does not constitute investment advice. Investors should make prudent decisions based on their own risk tolerance and are advised to consult professional financial advisors. Never invest more than you can afford to lose.
FAQ
What is XEC (eCash)? What are its basic features and use cases?
XEC (eCash) is a cryptocurrency designed for fast, low-cost digital payments. It enables everyday transactions, smart contracts, and network staking rewards while providing efficient blockchain functionality.
What is the XEC price prediction for 2024? What are the main influencing factors?
XEC price prediction for 2024 remains uncertain, primarily influenced by supply-demand dynamics, market adoption, and blockchain network activity. Token scarcity, market sentiment, and investor interest are key factors shaping price movements.
What factors affect XEC price movement?
XEC price is influenced by market demand, supply volume, market sentiment, overall cryptocurrency trends, adoption rate, regulatory developments, and technological updates to the network.
What is the relationship and difference between XEC and Bitcoin Cash (BCH)?
XEC is a fork of Bitcoin Cash (BCH), which itself forked from Bitcoin. While BCH increased block size for faster transactions, XEC is optimized for smart contracts and token functionality, offering better support for decentralized applications.
How to conduct technical and fundamental analysis on XEC?
XEC technical analysis focuses on trading volume, price trends, and chart patterns. Fundamental analysis examines circulating supply, market adoption, and development progress. Monitor on-chain metrics and community activity to assess XEC's growth potential and market value.
What are the main risks of investing in XEC? What issues should be noted?
XEC investment risks include market volatility, regulatory changes, and technical developments. Monitor price fluctuations, project updates, and liquidity conditions. Diversify investments and only invest capital you can afford to lose.
What are XEC's future development prospects and application scenarios?
XEC has promising growth prospects with an annual growth rate of approximately 15.76%, potentially reaching 0.000037 USD by 2028. Its application scenarios will expand with ecosystem development, offering significant long-term growth potential worth attention.
* The information is not intended to be and does not constitute financial advice or any other recommendation of any sort offered or endorsed by Gate.