This comprehensive guide analyzes ZetaChain (ZETA), a foundational omnichain blockchain platform enabling cross-chain smart contracts and messaging. Currently trading at $0.08263 with a $100.64 million market cap, ZETA shows recent momentum despite an 84.21% yearly decline from its $2.87 peak. The article examines historical price evolution, core market drivers including tokenomics and ecosystem development, and provides price forecasts through 2031, ranging from conservative ($0.0784) to optimistic scenarios ($0.16477+). Professional investment strategies include dollar-cost averaging for long-term holders and active trading approaches, with risk management frameworks for different investor profiles. Key considerations address market volatility, regulatory uncertainties, technical risks, and competitive pressures in the cross-chain infrastructure sector. Detailed guidance covers secure storage via Gate Web3 Wallet, position sizing, and portfolio allocation recommendations tailored to investor experience leve
Introduction: ZETA's Market Position and Investment Value
ZetaChain (ZETA), positioned as a foundational public blockchain enabling omnichain smart contracts and cross-chain messaging, has been facilitating seamless interaction between different blockchain networks since its launch in 2024. As of 2026, ZETA has achieved a market capitalization of approximately $100.64 million, with a circulating supply of around 1.218 billion tokens, and the price remains at approximately $0.08263. This asset, recognized as a pioneering solution in blockchain interoperability, is playing an increasingly vital role in connecting diverse blockchain ecosystems and enabling cross-chain DeFi, payments, and decentralized applications.
This article will comprehensively analyze ZETA's price trends from 2026 to 2031, combining historical patterns, market supply and demand dynamics, ecosystem development, and macroeconomic conditions to provide investors with professional price forecasts and practical investment strategies.
I. ZETA Price History Review and Current Market Status
ZETA Historical Price Evolution Trajectory
- 2024: The token launched on Gate.com in February 2024, reaching its historical peak price of $2.87 on February 15, 2024, marking a significant milestone in its early trading period.
- 2025: The market experienced notable volatility, with the price declining substantially throughout the year, eventually touching its historical low of $0.05735 on October 10, 2025.
- 2026: As of January 17, 2026, the token has shown recovery momentum, with the current price standing at $0.08263, representing an increase from the historical low point.
ZETA Current Market Status
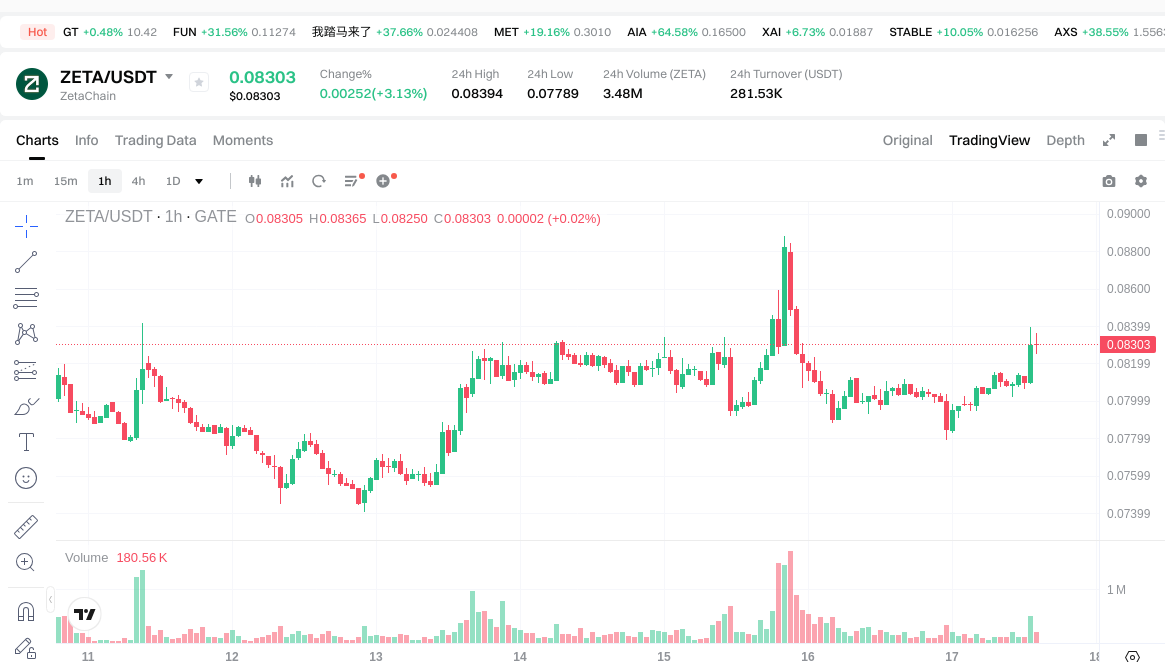
ZETA is currently trading at $0.08263 as of January 17, 2026, demonstrating positive short-term momentum with gains of 2.88% over the past hour and 3.4% over the past 24 hours. The 7-day performance shows an 11.39% increase, while the 30-day gain reaches 20%, indicating strengthening market sentiment in recent weeks.
The token's 24-hour trading range spans from $0.07789 to $0.08394, with a total trading volume of $279,331.34. ZetaChain currently ranks #354 in the cryptocurrency market with a circulating market capitalization of approximately $100.64 million. The circulating supply stands at 1.218 billion ZETA tokens, representing 58% of the total supply of 2.1 billion tokens, with a maximum supply cap also set at 2.1 billion.
The fully diluted market capitalization is approximately $173.52 million, and the market cap to FDV ratio sits at 58%. The project has gained traction across the cryptocurrency ecosystem, being listed on 33 exchanges and supported by a community of 78,875 token holders. Market dominance currently stands at 0.0051%.
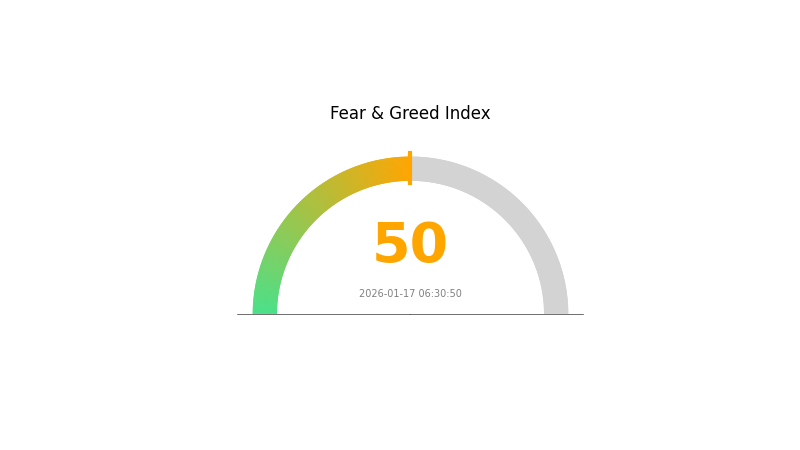
Despite the recent positive momentum, the 1-year performance shows a decline of 84.21%, reflecting the broader market correction and the distance from the February 2024 peak. The current market emotion indicator registers at neutral (50 on the volatility index), suggesting a balanced market sentiment without extreme fear or greed.
Click to view current ZETA market price
ZETA Market Sentiment Index
2026-01-17 Fear and Greed Index: 50 (Neutral)
Click to view the current Fear & Greed Index
The cryptocurrency market is currently in a neutral sentiment state with the Fear and Greed Index at 50. This balanced reading suggests that market participants are neither excessively fearful nor overly greedy at the moment. Investors should remain cautious and maintain a rational approach to trading decisions. A neutral index typically indicates consolidation phases in the market, offering opportunities for both long-term and short-term strategies. Consider monitoring market developments closely on Gate.com for potential shifts in sentiment.
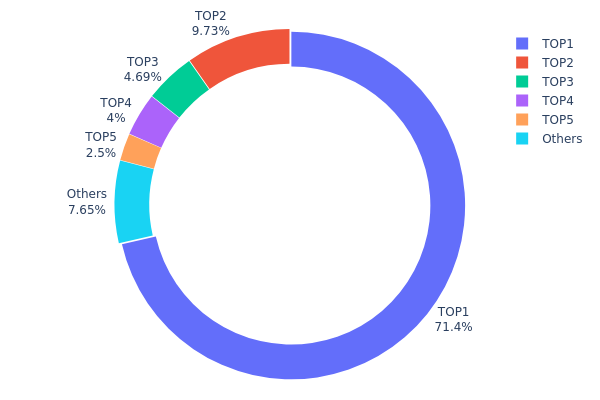
ZETA Holding Distribution
The holding distribution chart illustrates the concentration of token ownership across different wallet addresses, serving as a critical indicator of decentralization and market structure stability. By analyzing the distribution pattern, investors can assess potential risks related to large holder dominance and evaluate the health of the token's ecosystem distribution.
Current ZETA holdings demonstrate a highly concentrated ownership structure, with the top address (0xdead...942069) controlling 71.42% of total supply, holding 1.5 million tokens. The top five addresses collectively account for 92.33% of circulation, while all remaining addresses share merely 7.67%. This distribution pattern reveals an extremely centralized control mechanism, significantly deviating from ideal decentralization principles. The second-largest holder (0x0000...8b7c6a) possesses 9.72%, and the third (0x306c...045346) holds 4.69%, further reinforcing the concentration trend.
Such extreme centralization poses substantial implications for market dynamics. The dominant position of the top holder creates potential price manipulation risks, as liquidation or large-scale transfers could trigger severe market volatility. The limited free-float supply may result in amplified price movements during trading activities, reducing market liquidity and increasing slippage for ordinary investors. This distribution structure suggests weak on-chain governance decentralization, with decision-making power potentially concentrated among few entities. However, if top addresses represent legitimate protocol treasury, team vesting, or ecosystem development funds under transparent lock-up mechanisms, this concentration might reflect intentional tokenomics design rather than problematic centralization.
Click to view current ZETA Holding Distribution
| Top |
Address |
Holding Qty |
Holding (%) |
| 1 |
0xdead...942069 |
1500000.00K |
71.42% |
| 2 |
0x0000...8b7c6a |
204305.48K |
9.72% |
| 3 |
0x306c...045346 |
98583.33K |
4.69% |
| 4 |
0xefee...012c31 |
84000.00K |
4.00% |
| 5 |
0xbd4b...7012b9 |
52500.00K |
2.50% |
| - |
Others |
160611.19K |
7.67% |
II. Core Factors Influencing ZETA's Future Price
Supply Mechanism
- Token Unlock Schedule: ZETA implements a structured release mechanism where core contributors (22.5% of total supply) and investors (16%) receive monthly releases at 5.5% for the first six months post-mainnet launch, subsequently reducing to 2.77% monthly. This gradual unlocking approach aims to balance supply pressure while maintaining long-term participant alignment.
- Historical Pattern: Following ZETA's mainnet launch on January 31, 2024, the token experienced significant volatility. Initially surging nearly 25% upon Coinbase listing announcement in August 2024, ZETA reached its peak of $2.85 on February 16, 2024. However, subsequent unlock events contributed to an 81% decline from this peak, with current trading around $0.5394, reflecting typical patterns observed in venture-backed tokens.
- Current Impact: Token unlock schedules remain a critical near-term price factor. The transition from higher initial release rates to lower monthly emissions may gradually reduce selling pressure, though market sentiment and broader adoption metrics will likely play equally important roles.
Institutional and Major Holder Dynamics
- Exchange Adoption: ZETA gained significant visibility through its listing on major platforms including Gate.com and Coinbase, with the latter initially supporting ERC-20 iterations before expanding to native ZETA token trading, demonstrating growing institutional recognition.
- Market Positioning: As a Layer 1 blockchain built using Cosmos SDK and powered by Tendermint PBFT consensus, ZetaChain positions itself within the interoperability infrastructure sector, competing with established cross-chain solutions while carving its niche in blockchain connectivity.
Macroeconomic Environment
- Regulatory Landscape: Data privacy regulations such as GDPR and CCPA create both challenges and opportunities. While these frameworks complicate data collection, they potentially strengthen ZetaChain's competitive moat by raising barriers for new entrants attempting to build comparable first-party data repositories.
- Market Volatility: Cryptocurrency markets remain highly susceptible to external factors including financial policy shifts, regulatory developments, and geopolitical events. These broader market dynamics significantly influence ZETA's price trajectory independent of project-specific fundamentals.
Technical Development and Ecosystem Building
- Blockchain Interoperability: ZetaChain's core value proposition centers on enabling seamless cross-chain interactions, addressing blockchain fragmentation challenges. The platform utilizes key-holding signers requiring supermajority consensus to validate external blockchain interactions, ensuring security and reliability.
- Bitcoin Smart Contract Layer: As part of its broader interoperability objectives, ZetaChain aims to provide smart contract functionality for Bitcoin, potentially expanding use cases for the largest cryptocurrency by market capitalization.
- Ecosystem Growth: Following mainnet launch, Total Value Locked (TVL) surged from $89,000 on February 2, 2024, to over $5 million by mid-March, indicating early adoption momentum. The platform reported 1.8 million unique addresses participating within the first month, demonstrating robust initial user activity.
- Proof-of-Stake Mechanism: The network employs a PoS consensus mechanism integrated with observer and signer components, creating a secure architecture that facilitates integration within the broader blockchain ecosystem.
- Native Token Utility: ZETA serves multiple functions including staking, gas fee payments, governance participation, and facilitating cross-chain value exchange, providing fundamental utility that supports long-term demand dynamics.
III. 2026-2031 ZETA Price Prediction
2026 Outlook
- Conservative forecast: $0.0784
- Neutral forecast: $0.0834
- Optimistic forecast: $0.0884 (requires favorable market conditions)
2027-2029 Outlook
- Market stage expectation: Gradual growth phase with moderate volatility
- Price range forecast:
- 2027: $0.08075 - $0.09277
- 2028: $0.05628 - $0.12954
- 2029: $0.08646 - $0.12367
- Key catalysts: Market adoption trends and ecosystem development progress
2030-2031 Long-term Outlook
- Baseline scenario: $0.10373 - $0.12937 (assuming steady ecosystem growth)
- Optimistic scenario: $0.12296 - $0.16477 (assuming accelerated adoption)
- Transformative scenario: Above $0.16477 (requires breakthrough technological advancements and widespread institutional adoption)
- 2026-01-17: ZETA baseline trading range expected around $0.0784 - $0.0884 (initial consolidation phase)
| Year |
Predicted High Price |
Predicted Average Price |
Predicted Low Price |
Price Change |
| 2026 |
0.0884 |
0.0834 |
0.0784 |
0 |
| 2027 |
0.09277 |
0.0859 |
0.08075 |
3 |
| 2028 |
0.12954 |
0.08934 |
0.05628 |
8 |
| 2029 |
0.12367 |
0.10944 |
0.08646 |
32 |
| 2030 |
0.12937 |
0.11655 |
0.10373 |
41 |
| 2031 |
0.16477 |
0.12296 |
0.08361 |
48 |
IV. ZETA Professional Investment Strategy and Risk Management
ZETA Investment Methodology
(1) Long-term Holding Strategy
- Target investors: Believers in omnichain technology and multi-chain ecosystem development
- Operational recommendations:
- Consider dollar-cost averaging (DCA) to build positions during periods of market volatility
- Monitor ZetaChain's technological progress in cross-chain messaging and smart contract deployment
- Storage solution: Use Gate Web3 Wallet for secure asset management with multi-signature protection
(2) Active Trading Strategy
- Technical analysis tools:
- Support and resistance levels: Monitor the $0.05735 (ATL) and $0.08394 (24h high) range for entry and exit points
- Volume analysis: Track the $279,331 daily trading volume to assess market participation
- Swing trading considerations:
- Capitalize on short-term volatility, noting the 11.39% weekly gain and 20% monthly increase
- Set stop-loss orders to manage downside risk, particularly given the 84.21% decline over the past year
ZETA Risk Management Framework
(1) Asset Allocation Principles
- Conservative investors: 1-3% of crypto portfolio
- Aggressive investors: 5-10% of crypto portfolio
- Professional investors: Up to 15% with active hedging strategies
(2) Risk Hedging Solutions
- Portfolio diversification: Balance ZETA exposure with established layer-1 blockchain assets
- Position sizing: Limit individual position size based on market capitalization ranking (#354) and circulating supply ratio (58%)
(3) Secure Storage Solutions
- Hot wallet recommendation: Gate Web3 Wallet for active trading and staking participation
- Cold storage approach: Hardware wallet solutions for long-term holdings exceeding trading needs
- Security precautions: Enable two-factor authentication, verify contract addresses (0xf091867ec603a6628ed83d274e835539d82e9cc8 on Ethereum), and avoid sharing private keys
V. ZETA Potential Risks and Challenges
ZETA Market Risks
- High volatility: The token has experienced an 84.21% decline over the past year, indicating significant price instability
- Liquidity concerns: With a market capitalization of approximately $100.6 million and ranking #354, trading depth may be limited during market stress
- Competition intensity: The cross-chain sector features numerous competing protocols, which may impact market share and adoption rates
ZETA Regulatory Risks
- Cross-chain compliance uncertainty: Multi-chain interoperability solutions may face evolving regulatory scrutiny across different jurisdictions
- Token classification ambiguity: Regulatory treatment of cross-chain infrastructure tokens remains uncertain in major markets
- Exchange listing dependency: Currently listed on 33 exchanges, changes in listing status could impact liquidity and accessibility
ZETA Technical Risks
- Smart contract vulnerabilities: Cross-chain messaging systems involve complex code that may contain undiscovered security flaws
- Network security challenges: Maintaining security across multiple blockchain ecosystems increases attack surface area
- Scalability limitations: The project's ability to handle growing transaction volumes while maintaining security remains to be proven at scale
VI. Conclusion and Action Recommendations
ZETA Investment Value Assessment
ZetaChain represents an ambitious approach to solving blockchain interoperability challenges through its omnichain smart contract platform. The project's long-term value proposition centers on enabling seamless cross-chain interactions and universal messaging capabilities. However, short-term risks include significant historical price decline (84.21% over one year), competitive market positioning (ranked #354), and the technical complexities inherent in cross-chain infrastructure. The recent positive momentum (11.39% weekly, 20% monthly gains) suggests renewed market interest, though investors should weigh this against the substantial distance from the all-time high of $2.87.
ZETA Investment Recommendations
✅ Beginners: Consider minimal exposure (1-2% of crypto portfolio) only after thoroughly understanding cross-chain technology and associated risks
✅ Experienced investors: May allocate 3-5% with active monitoring of technological milestones and ecosystem growth metrics
✅ Institutional investors: Conduct comprehensive due diligence on smart contract audits and team credentials before considering strategic positions with appropriate risk management protocols
ZETA Trading Participation Methods
- Spot trading: Purchase ZETA on Gate.com with support for multiple trading pairs and competitive liquidity
- Dollar-cost averaging: Establish systematic purchase schedules to mitigate timing risk in volatile market conditions
- Staking and ecosystem participation: Explore opportunities to earn yields while supporting network security, following official ZetaChain documentation
Cryptocurrency investments carry extreme risks, and this article does not constitute investment advice. Investors should make prudent decisions based on their own risk tolerance and are advised to consult professional financial advisors. Never invest more than you can afford to lose.
FAQ
What factors influence ZETA token price movements?
ZETA price movements are driven by market sentiment, trading volume, technological developments, and user adoption trends. Network upgrades and ecosystem growth also impact price dynamics significantly.
How to analyze ZETA price trends and make predictions?
Analyze ZETA price trends using technical analysis tools like RSI and historical price data. Short-term predictions rely on 4-hour price movements, while long-term predictions consider weekly trends. Combine technical indicators with trading volume analysis for more accurate forecasts.
ZETA has demonstrated volatile price movements characteristic of emerging cryptocurrencies. Historical data shows price fluctuations influenced by market sentiment, adoption developments, and broader crypto market trends. For specific price charts and detailed historical performance metrics, please refer to dedicated cryptocurrency tracking platforms.
What are the risks and volatility considerations for ZETA price prediction?
ZETA price predictions are highly speculative and subject to significant market volatility. External factors and market conditions can drastically alter predictions. However, forecasts suggest potential annual gains of +97.99% by 2040, though actual performance may vary considerably.
How does ZETA compare to other similar tokens in terms of price potential?
ZETA demonstrates competitive price potential driven by strong community support and innovative blockchain technology. Its growth trajectory depends on market adoption rates and broader crypto trends, positioning it favorably among similar tokens.
What technical indicators are most useful for ZETA price forecasting?
RSI, Moving Averages, and MACD are the most useful technical indicators for ZETA price forecasting. These tools help determine long-term trends and predict future price movements.
* The information is not intended to be and does not constitute financial advice or any other recommendation of any sort offered or endorsed by Gate.