This comprehensive guide examines ACT (AI Prophecy) token's price dynamics and investment potential through 2031. As of January 2026, ACT trades at $0.02316 with a $21.96 million market cap, having experienced significant volatility including an 86.28% one-year decline. The article analyzes historical price evolution, current market sentiment indicating extreme fear, and holding distribution patterns showing high concentration risk. Professional price forecasts range from conservative ($0.01459-$0.02316) to optimistic ($0.02941) scenarios for 2026, with projections extending through 2031 reaching $0.03771-$0.03998 under favorable conditions. The guide provides actionable investment strategies including dollar-cost averaging and technical analysis frameworks, comprehensive risk management protocols, and addresses key regulatory and technical challenges for this early-stage Solana-based AI blockchain project suitable for diversified crypto portfolios.
Introduction: ACT's Market Position and Investment Value
Act I: The AI Prophecy (ACT), positioned as one of the pioneering projects exploring AI interaction beyond traditional user-assistant paradigms, has established its presence in the crypto market since its inception. As of January 2026, ACT maintains a market capitalization of approximately $21.96 million, with a circulating supply of around 948.24 million tokens, and the price stabilizing around $0.02316. This asset, recognized for its innovative approach to AI network engagement, is playing an increasingly relevant role in the intersection of artificial intelligence and blockchain technology.
This article provides a comprehensive analysis of ACT's price trajectory from 2026 to 2031, examining historical patterns, market supply-demand dynamics, ecosystem development, and macroeconomic factors to offer professional price forecasting and practical investment strategies for investors.
I. ACT Price History Review and Market Status
ACT Historical Price Evolution Trajectory
- 2024: Project launched with initial offering price of $0.0156, experienced significant growth culminating in a peak of $0.95 on November 14, 2024, demonstrating strong early market momentum.
- 2025: Market entered correction phase, with price declining from previous peaks and reaching an all-time low of $0.00677 on October 10, 2025, reflecting broader market consolidation.
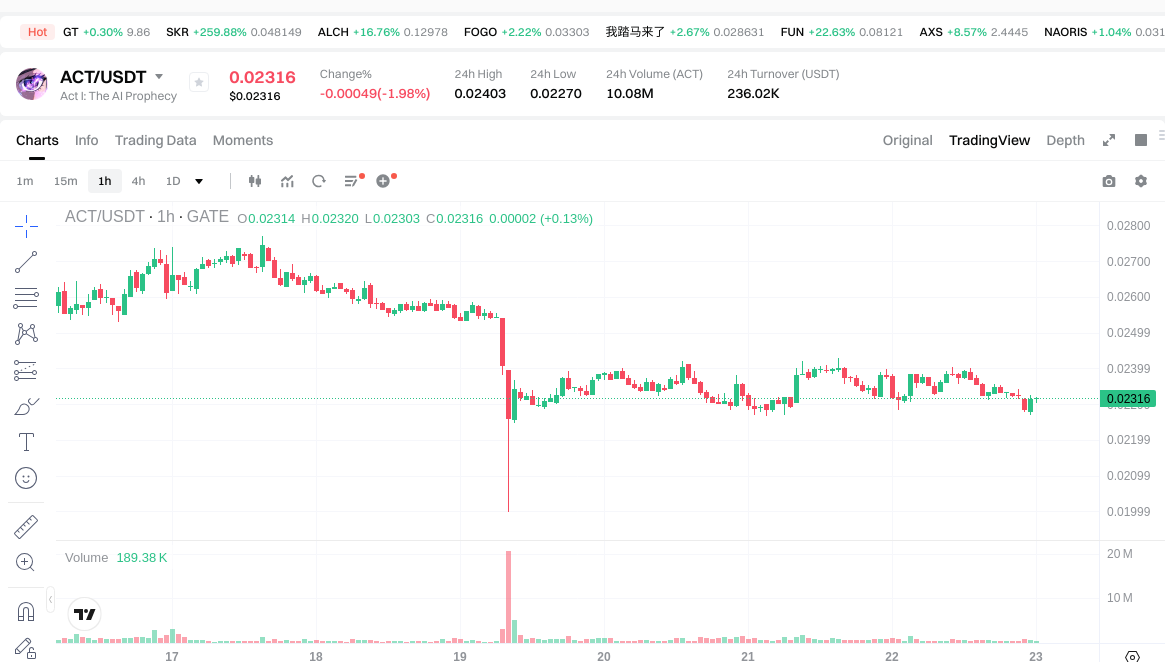
- 2026: As of January 23, 2026, price stabilized at $0.02316, showing modest recovery from the all-time low while remaining significantly below historical peak levels.
ACT Current Market Status
As of January 23, 2026, ACT I: The AI Prophecy (ACT) is trading at $0.02316. The token has exhibited mixed short-term performance, with a 1.31% increase over the past hour, while experiencing declines of 1.94% in the last 24 hours and 11.86% over the past week. The 30-day performance shows a more pronounced decline of 37.15%, and the one-year trajectory reflects an 86.28% decrease from previous levels.
The 24-hour trading volume stands at $238,081.57, with the token reaching an intraday high of $0.02403 and a low of $0.0227. The current market capitalization is approximately $21.96 million, with a circulating supply of 948.24 million tokens, representing 94.82% of the total supply of 948.25 million ACT. The fully diluted market capitalization matches closely at $21.96 million, indicating minimal dilution risk from unvested tokens.
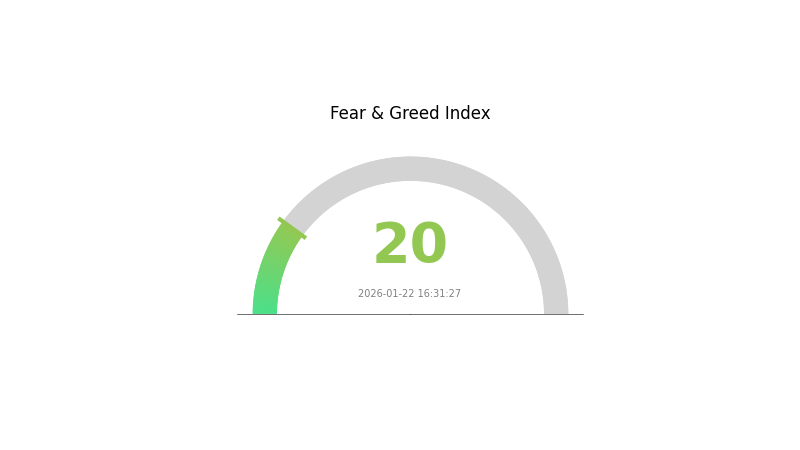
ACT currently ranks #837 in market capitalization rankings, with a market dominance of 0.00069%. The token is deployed on the Solana blockchain using the SPL standard and is listed on 30 exchanges. The holder count stands at 37,735 addresses, suggesting a moderate level of token distribution. The current market sentiment index indicates a reading of 20, categorized as "Extreme Fear," reflecting cautious investor positioning in the broader cryptocurrency market.
Click to view current ACT market price
ACT Market Sentiment Index
2026-01-22 Fear and Greed Index: 20 (Extreme Fear)
Click to view current Fear & Greed Index
The crypto market is experiencing extreme fear, with the Fear and Greed Index plummeting to 20. This indicates intense market pessimism and widespread investor anxiety. During such extreme fear periods, opportunities often emerge for contrarian investors. Market participants should exercise caution while monitoring potential entry points. Consider dollar-cost averaging strategies to mitigate volatility risks. On Gate.com, you can track real-time market sentiment and adjust your portfolio positioning accordingly to navigate this challenging market phase.
ACT Holding Distribution
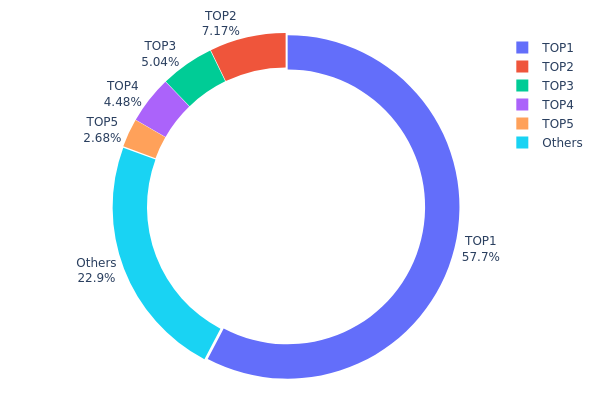
The holding distribution chart illustrates the concentration of token holdings across different wallet addresses, revealing the degree of decentralization within a cryptocurrency's ecosystem. By analyzing the percentage of total supply held by top addresses versus smaller holders, this metric provides crucial insights into market structure, liquidity dynamics, and potential price manipulation risks.
Based on the current data, ACT demonstrates a highly concentrated holding pattern. The top address alone controls 547,190.37K tokens, representing 57.70% of the total supply—a remarkably high concentration level. The top five addresses collectively hold approximately 76.05% of the circulating supply, with the second through fifth largest holders accounting for 7.16%, 5.04%, 4.47%, and 2.68% respectively. The remaining addresses, classified as "Others," collectively hold only 22.95% of the supply, indicating that the vast majority of tokens are controlled by a small group of major holders.
This extreme concentration presents significant implications for ACT's market dynamics. The dominant position of the largest holder creates substantial centralization risk, as any large-scale movement from this address could trigger dramatic price volatility. The limited distribution among smaller holders suggests reduced market liquidity and increased susceptibility to price manipulation. From a structural perspective, this concentration pattern indicates that ACT's on-chain ecosystem lacks the decentralized characteristics typically desired in cryptocurrency projects, potentially affecting long-term stability and investor confidence in the token's market behavior.
Click to view current ACT Holding Distribution
| Top |
Address |
Holding Qty |
Holding (%) |
| 1 |
9WzDXw...YtAWWM |
547190.37K |
57.70% |
| 2 |
CBEADk...sebkVG |
67969.89K |
7.16% |
| 3 |
5Q544f...pge4j1 |
47819.97K |
5.04% |
| 4 |
C68a6R...XFdqyo |
42463.80K |
4.47% |
| 5 |
u6PJ8D...ynXq2w |
25448.63K |
2.68% |
| - |
Others |
217349.76K |
22.95% |
II. Core Factors Affecting ACT's Future Price
Based on the currently available information, there is insufficient data to provide a comprehensive analysis of the core factors that may influence ACT's future price movements. Key aspects such as supply mechanisms, institutional dynamics, macroeconomic conditions, and technical developments require detailed information from official sources, on-chain data, and market reports to ensure accuracy and reliability.
For investors interested in ACT, it is recommended to:
- Monitor official project announcements and documentation for updates on tokenomics and supply schedules
- Track on-chain metrics through blockchain explorers to understand holder distribution and transaction patterns
- Follow reputable crypto news sources for developments in regulatory frameworks and institutional adoption
- Review technical roadmaps and ecosystem growth indicators published by the project team
As market conditions evolve and more verifiable information becomes available, a more detailed analysis of these price-influencing factors can be conducted.
III. 2026-2031 ACT Price Forecast
2026 Outlook
- Conservative Forecast: $0.01459 - $0.02316
- Neutral Forecast: $0.02316 (average scenario)
- Optimistic Forecast: $0.02941 (requires favorable market conditions and increased adoption)
2027-2029 Outlook
- Market Stage Expectation: ACT is anticipated to enter a gradual growth phase with steady market maturation and expanding ecosystem development.
- Price Range Forecast:
- 2027: $0.01577 - $0.0297 (approximately 13% change from 2026)
- 2028: $0.01568 - $0.03667 (approximately 20% change from 2026)
- 2029: $0.02393 - $0.03783 (approximately 39% change from 2026)
- Key Catalysts: Sustained ecosystem expansion, potential technological upgrades, and broader market acceptance could drive price appreciation during this period.
2030-2031 Long-term Outlook
- Baseline Scenario: $0.03228 - $0.04035 (assuming continued market stability and moderate adoption growth)
- Optimistic Scenario: $0.03771 - $0.03998 by 2031 (contingent on accelerated ecosystem development and favorable regulatory environment)
- Transformative Scenario: Potential to reach upper bounds if significant partnerships materialize and mass adoption occurs
- 2026-01-23: ACT trading within projected ranges (early stage of forecasted period)
| Year |
Predicted High Price |
Predicted Average Price |
Predicted Low Price |
Price Change |
| 2026 |
0.02941 |
0.02316 |
0.01459 |
0 |
| 2027 |
0.0297 |
0.02629 |
0.01577 |
13 |
| 2028 |
0.03667 |
0.028 |
0.01568 |
20 |
| 2029 |
0.03783 |
0.03233 |
0.02393 |
39 |
| 2030 |
0.04035 |
0.03508 |
0.03228 |
51 |
| 2031 |
0.03998 |
0.03771 |
0.02602 |
62 |
IV. ACT Professional Investment Strategy and Risk Management
ACT Investment Methodology
(1) Long-term Holding Strategy
- Suitable for: Investors who believe in the long-term potential of AI-driven blockchain projects and have moderate to high risk tolerance
- Operational Recommendations:
- Consider dollar-cost averaging (DCA) to build positions gradually, reducing the impact of price volatility
- Monitor project development progress and community engagement metrics regularly
- Utilize secure storage solutions such as Gate Web3 Wallet for cold storage of long-term holdings
(2) Active Trading Strategy
- Technical Analysis Tools:
- Moving Averages: Use 50-day and 200-day moving averages to identify trend directions and potential entry/exit points
- Relative Strength Index (RSI): Monitor RSI levels to identify overbought (above 70) or oversold (below 30) conditions
- Swing Trading Considerations:
- Pay attention to the 24-hour trading range ($0.0227-$0.02403) to identify potential breakout or breakdown levels
- Consider volume trends alongside price movements for confirmation of directional moves
ACT Risk Management Framework
(1) Asset Allocation Principles
- Conservative Investors: 1-3% of crypto portfolio allocation
- Aggressive Investors: 5-8% of crypto portfolio allocation
- Professional Investors: 8-12% of crypto portfolio allocation with active monitoring
(2) Risk Hedging Approaches
- Position sizing: Never allocate more than you can afford to lose given ACT's high volatility profile
- Stop-loss implementation: Consider setting stop-loss orders at key technical support levels to limit downside exposure
(3) Secure Storage Solutions
- Hot Wallet recommendation: Gate Web3 Wallet for active trading positions and quick access
- Cold storage approach: Hardware wallets or paper wallets for long-term holdings exceeding short-term trading needs
- Security considerations: Enable two-factor authentication, regularly update security protocols, and never share private keys or seed phrases
V. ACT Potential Risks and Challenges
ACT Market Risks
- High volatility: ACT has experienced significant price fluctuations with a 1-year decline of 86.28%, indicating substantial market risk
- Liquidity concerns: With a market cap ranking of 837 and relatively modest trading volume, liquidity may be limited during market stress
- Market sentiment dependency: As an AI-related project, ACT's price may be heavily influenced by broader sentiment toward AI and meme tokens
ACT Regulatory Risks
- Token classification uncertainty: Evolving regulatory frameworks may impact how AI-related tokens are classified and traded
- Cross-border compliance: Different jurisdictions may impose varying requirements on AI-related crypto projects
- Exchange listing risks: Regulatory changes could affect token availability on centralized exchanges
ACT Technical Risks
- Smart contract vulnerabilities: As a Solana-based token (SPL standard), ACT is subject to potential smart contract exploits or bugs
- Network dependency: The project's performance is tied to Solana network stability and scalability
- Development risks: Early-stage projects may face technical challenges in delivering on their roadmap objectives
VI. Conclusion and Action Recommendations
ACT Investment Value Assessment
ACT represents an early-stage exploration of AI interaction models within the blockchain space, positioning itself as one of the few projects attempting to create a network of AI equals rather than traditional user-assistant paradigms. However, the token has faced significant price pressure with an 86.28% decline over the past year and a current price of $0.02316, far below its historical high of $0.95. With a circulating supply of approximately 948 million tokens (94.82% of max supply) and a market capitalization around $22 million, ACT remains a highly speculative asset. The project's long-term value proposition depends heavily on successful execution of its AI interaction vision and broader market acceptance of AI-related blockchain applications.
ACT Investment Recommendations
✅ Beginners: Approach with extreme caution. If interested, allocate only a minimal portion of your portfolio (no more than 1-2%) and prioritize learning about the project fundamentals before investing.
✅ Experienced Investors: Consider ACT as a small speculative position within a diversified AI-related crypto portfolio. Monitor project development milestones and community growth metrics closely.
✅ Institutional Investors: Conduct thorough due diligence on the project's technical architecture, team credentials, and competitive positioning. Evaluate ACT within the broader context of AI-blockchain convergence trends.
ACT Trading Participation Methods
- Spot Trading: Purchase ACT directly on Gate.com and other supported exchanges with 30 trading venues currently listing the token
- Dollar-Cost Averaging: Implement systematic purchase plans to reduce timing risk and build positions gradually
- Portfolio Integration: Consider ACT as part of a broader AI-themed or Solana ecosystem investment strategy
Cryptocurrency investment carries extremely high risks, and this article does not constitute investment advice. Investors should make prudent decisions based on their own risk tolerance and are advised to consult professional financial advisors. Never invest more than you can afford to lose.
FAQ
What is ACT token and what is its current use case?
ACT token is a utility token designed for decentralized applications and blockchain ecosystems. Its current use cases include governance participation, transaction fees reduction, and incentive mechanisms within its network protocol, enabling users to engage in platform activities and earn rewards.
What factors influence ACT price predictions and market movements?
ACT price movements are influenced by market demand, trading volume, overall crypto market sentiment, project developments, regulatory news, macroeconomic conditions, and technological innovations. Increased adoption and positive ecosystem growth typically drive upward price trends.
Track ACT trading volume, market capitalization, and historical price movements on major charts. Analyze support and resistance levels, moving averages, and on-chain metrics. Monitor community sentiment and ecosystem developments to identify potential price direction shifts.
What are the risks and volatility factors associated with ACT price forecasting?
ACT price volatility stems from market sentiment shifts, regulatory changes, trading volume fluctuations, and macroeconomic factors. Forecasting accuracy depends on data quality and model reliability. External shocks and adoption trends significantly impact predictions.
ACT token demonstrates strong price momentum with competitive trading volume and market capitalization. Its performance metrics show resilience against market volatility, with consistent upward trajectory compared to peers in similar categories.
Common tools include moving averages, RSI, MACD, Bollinger Bands, and support/resistance levels. Traders also use volume analysis, trend lines, and candlestick patterns to forecast ACT price movements and identify trading opportunities.
* The information is not intended to be and does not constitute financial advice or any other recommendation of any sort offered or endorsed by Gate.