This comprehensive analysis examines ADX (AdEx), a web3 advertising platform, offering professional price forecasts from 2026 to 2031. Currently trading at $0.09177 with a market cap of $13.57 million, ADX faces extreme market fear but presents contrarian opportunities. The article details historical price evolution, current market dynamics, and predictive models across multiple scenarios, from conservative ($0.06057) to optimistic forecasts ($0.19995 by 2031). It provides actionable investment strategies including long-term holding and active trading approaches, alongside critical risk management frameworks and regulatory considerations. Designed for investors seeking structured analysis of blockchain advertising infrastructure, the guide combines technical analysis with ecosystem evaluation, offering clear asset allocation principles and secure trading methods via Gate.com to navigate ADX's volatility effectively.
Introduction: ADX's Market Position and Investment Value
AdEx (ADX), positioned as an innovative web3 marketing platform leveraging blockchain technology and programmatic advertising, has been serving the crypto advertising ecosystem since its launch in 2017. As of 2026, ADX maintains a market capitalization of approximately $13.57 million, with a circulating supply of around 147.9 million tokens, trading at $0.09177. This asset, recognized as a "transparent and fraud-protected advertising solution," is playing an increasingly vital role in connecting web3 advertisers with untapped crypto audiences.
This article will comprehensively analyze ADX's price trends from 2026 to 2031, combining historical patterns, market supply-demand dynamics, ecosystem development, and macroeconomic conditions to provide investors with professional price forecasts and practical investment strategies.
I. ADX Price History Review and Current Market Status
ADX Historical Price Evolution Trajectory
- 2017: Token launched at $0.113 in June, establishing initial market presence
- 2018: Reached all-time high of $3.49 on January 9, marking a significant milestone during the crypto market bull run
- 2020: Hit all-time low of $0.03511504 on March 13, reflecting broader market downturn
- 2024-2025: Price experienced notable volatility, declining from higher levels to current trading range
ADX Current Market Situation
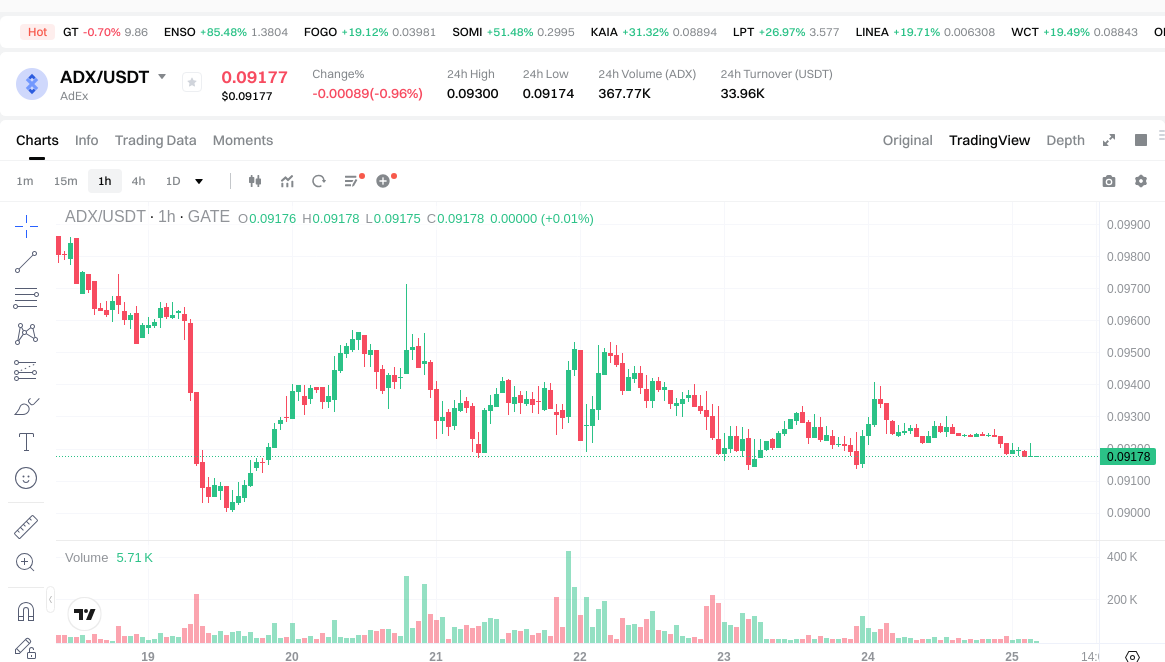
As of January 25, 2026, ADX is trading at $0.09177, representing a decline of 97.37% from its historical peak. The token demonstrates mixed short-term performance with a 0.22% decrease over the past hour and a 1.02% decline in the last 24 hours. Weekly and monthly trends show steeper corrections of 6.61% and 14.79% respectively, while the annual performance reflects a 48.13% decrease.
The 24-hour trading range spans from $0.09174 to $0.093, with trading volume reaching $34,086.06. ADX currently holds a market capitalization of approximately $13.57 million, ranking #1054 among cryptocurrencies with a market dominance of 0.00043%. The circulating supply stands at 147.9 million tokens out of a total supply of 150 million, representing a circulation ratio of 72.78%. The fully diluted market cap is calculated at $13.77 million.
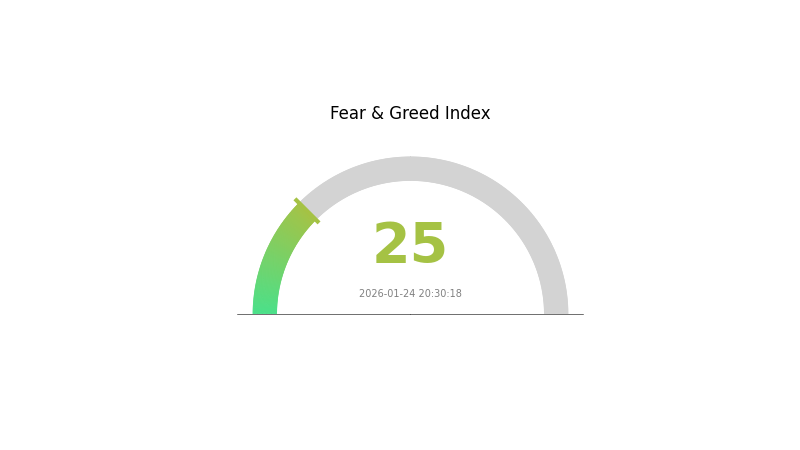
The token is supported by 4,626 holders and is listed on 16 exchanges. Market sentiment indicators show an extreme fear reading of 25 on the volatility index, suggesting heightened caution among market participants.
Click to view current ADX market price
ADX Market Sentiment Index
2026-01-24 Fear and Greed Index: 25 (Extreme Fear)
Click to view current Fear & Greed Index
The cryptocurrency market is currently experiencing extreme fear, with the Fear and Greed Index at 25. This indicates significant market pessimism and risk aversion among investors. Such extreme fear levels often present contrarian opportunities for long-term investors, as market capitulation frequently precedes recovery phases. However, prudent risk management remains essential during volatile periods. Monitor market developments closely and consider your investment strategy accordingly.
ADX持仓分布
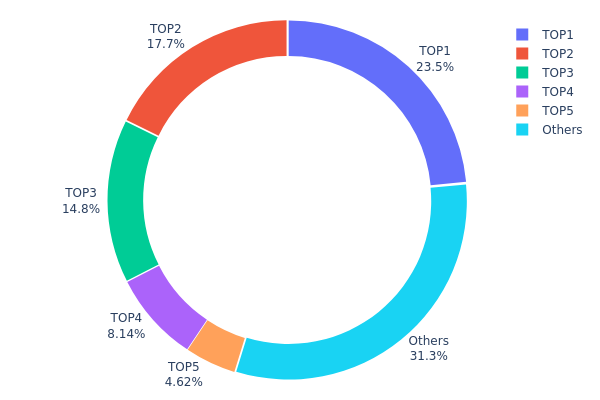
地址持仓分布图用于展示加密货币在不同钱包地址间的分配情况,通过量化头部地址的持仓占比,可以直观评估代币的去中心化程度和集中度风险。该指标对于理解项目的链上治理结构、识别潜在的市场操控风险以及评估流动性分布具有重要意义。
从当前ADX的持仓数据来看,前五大地址合计持有约140000.23K枚代币,占总流通量的68.72%,呈现出较高的集中度特征。其中,最大持有者(0xb645...13491a)单独控制了23.48%的流通供应,第二和第三大地址分别持有17.73%和14.75%。这种头部集中的分布模式表明,少数大型持有者对ADX的市场走势具有显著影响力。虽然"Others"类别占据31.28%的份额,显示出一定程度的分散性,但整体来看,前三大地址就已控制超过55%的流通量,这在市场结构上构成了明显的中心化特征。
这种集中度水平对市场波动性具有双重影响。一方面,大户的长期持有可能减少流通盘,在市场需求增加时推动价格上涨;另一方面,若头部地址选择集中抛售,则可能引发剧烈的价格波动和流动性危机。从链上治理角度看,高度集中的持仓分布意味着少数实体在项目决策中拥有更大话语权,这可能影响社区治理的公平性和去中心化程度。投资者在参与ADX交易时,需密切关注头部地址的链上活动,特别是大额转账和交易所充值行为,以及时评估市场情绪变化和潜在的流动性风险。
点击可查看当前 ADX 持仓分布
| Top |
Address |
Holding Qty |
Holding (%) |
| 1 |
0xb645...13491a |
47769.43K |
23.48% |
| 2 |
0x4846...b9c534 |
36071.45K |
17.73% |
| 3 |
0xf977...41acec |
30000.00K |
14.75% |
| 4 |
0x5a52...70efcb |
16557.88K |
8.14% |
| 5 |
0x23c2...52c5e9 |
9401.47K |
4.62% |
| - |
Others |
63588.83K |
31.28% |
II. Core Factors Influencing ADX's Future Price
Based on the current available information, specific data regarding ADX's supply mechanisms, institutional dynamics, macroeconomic environment impacts, and technical developments are not sufficiently detailed in the provided materials to generate a comprehensive analysis. Without concrete data on token economics, major holder activities, or recent technical upgrades, it would not be appropriate to speculate on these critical price-influencing factors.
For accurate price analysis and investment decisions regarding ADX, readers are encouraged to conduct further research through official project channels and verified cryptocurrency data sources.
III. 2026-2031 ADX Price Forecast
2026 Outlook
- Conservative Forecast: $0.06057 - $0.09177
- Neutral Forecast: Around $0.09177
- Optimistic Forecast: Up to $0.11012 (requires favorable market conditions and sustained adoption momentum)
2027-2029 Outlook
- Market Stage Expectation: ADX may enter a gradual growth phase with increasing institutional interest and broader DeFi adoption
- Price Range Forecast:
- 2027: $0.08379 - $0.1171 (approximately 10% annual growth)
- 2028: $0.06323 - $0.13955 (approximately 18% cumulative growth)
- 2029: $0.11807 - $0.14914 (approximately 35% cumulative growth)
- Key Catalysts: Expansion of decentralized advertising ecosystem, potential protocol upgrades, and growing Web3 marketing adoption
2030-2031 Long-term Outlook
- Baseline Scenario: $0.13261 - $0.13671 (assuming steady market development and moderate adoption rates)
- Optimistic Scenario: $0.14556 - $0.15996 (requires significant ecosystem expansion and sustained bull market momentum)
- Transformative Scenario: Up to $0.19995 (contingent on breakthrough adoption in digital advertising sector and exceptional market conditions)
- 2031-12-31: ADX potentially reaching $0.15996 - $0.19995 (representing approximately 74% cumulative growth from 2026 baseline under favorable conditions)
| Year |
Predicted High Price |
Predicted Average Price |
Predicted Low Price |
Price Change |
| 2026 |
0.11012 |
0.09177 |
0.06057 |
0 |
| 2027 |
0.1171 |
0.10095 |
0.08379 |
10 |
| 2028 |
0.13955 |
0.10902 |
0.06323 |
18 |
| 2029 |
0.14914 |
0.12429 |
0.11807 |
35 |
| 2030 |
0.1832 |
0.13671 |
0.13261 |
48 |
| 2031 |
0.19995 |
0.15996 |
0.14556 |
74 |
IV. ADX Professional Investment Strategy and Risk Management
ADX Investment Methodology
(I) Long-term Holding Strategy
- Suitable for: Investors who believe in the long-term potential of web3 advertising technology and blockchain-based marketing solutions
- Operational recommendations:
- Consider ADX as part of a diversified web3 infrastructure portfolio, given its focus on advertising solutions for crypto audiences
- Monitor the development of the AdEx platform's adoption among web3 advertisers and the growth of its user base
- Establish clear position size limits based on personal risk tolerance, considering ADX represents approximately 0.00043% of total crypto market capitalization
- Storage solution: Use secure wallet solutions such as Gate Web3 Wallet for ETH-based tokens, ensuring proper backup of private keys and seed phrases
(II) Active Trading Strategy
- Technical analysis tools:
- Volume analysis: Monitor the 24-hour trading volume (currently $34,086) relative to market cap to assess liquidity and trading activity
- Price trend indicators: Track multiple timeframe performance (1H: -0.22%, 24H: -1.02%, 7D: -6.61%, 30D: -14.79%, 1Y: -48.13%) to identify potential entry and exit points
- Swing trading considerations:
- Be aware of the token's relatively low liquidity compared to major cryptocurrencies, which may result in higher price volatility
- Consider the circulating supply ratio of 72.78% when evaluating potential supply pressure
ADX Risk Management Framework
(I) Asset Allocation Principles
- Conservative investors: 0.5-1% of crypto portfolio allocation
- Moderate investors: 1-3% of crypto portfolio allocation
- Aggressive investors: 3-5% of crypto portfolio allocation
(II) Risk Hedging Solutions
- Portfolio diversification: Balance ADX holdings with established cryptocurrencies and other web3 infrastructure tokens
- Position sizing: Never allocate more than a predetermined percentage of your total portfolio to any single asset
(III) Secure Storage Solutions
- Hot wallet recommendation: Gate Web3 Wallet for convenient trading and platform interaction
- Cold storage option: Consider hardware wallet solutions for long-term holdings to minimize online security risks
- Security considerations: Always verify contract addresses (0xADE00C28244d5CE17D72E40330B1c318cD12B7c3 on Ethereum), enable two-factor authentication, and never share private keys or seed phrases
V. ADX Potential Risks and Challenges
ADX Market Risks
- High volatility: The token has experienced a 48.13% decline over the past year, indicating potential for continued price fluctuations
- Liquidity concerns: With a market cap of approximately $13.57 million and relatively low trading volume, the token may face challenges in executing large orders without price impact
- Market sentiment: ADX represents a minimal 0.00043% market dominance, making it susceptible to broader market movements and sector-specific trends
ADX Regulatory Risks
- Advertising industry oversight: Web3 advertising platforms may face evolving regulations regarding user privacy, data protection, and advertising standards
- Blockchain technology regulations: Changes in cryptocurrency regulations across different jurisdictions could impact the platform's operations and token utility
- Compliance requirements: The need to adhere to advertising standards and anti-fraud regulations in multiple markets may affect operational flexibility
ADX Technical Risks
- Smart contract vulnerabilities: As an ETH-based token, ADX is subject to potential smart contract exploits or bugs
- Platform adoption risk: The success of ADX is closely tied to the adoption rate of the AdEx platform by web3 advertisers and publishers
- Competition: The web3 advertising space may face competition from both traditional advertising platforms adapting to blockchain and other blockchain-based advertising solutions
VI. Conclusion and Action Recommendations
ADX Investment Value Assessment
AdEx (ADX) represents a specialized opportunity in the web3 advertising infrastructure sector, offering a transparent, fraud-protected advertising platform for the crypto industry. The token's value proposition is tied to the growth of blockchain-based advertising solutions and the platform's ability to attract web3 advertisers. However, investors should consider the recent downward price trends, relatively low market capitalization, and limited liquidity when evaluating potential investments. The long-term value depends on the platform's ability to expand its user base and demonstrate clear utility in the evolving web3 ecosystem.
ADX Investment Recommendations
✅ Beginners: Start with minimal allocation (0.5-1% of crypto portfolio) and focus on understanding the web3 advertising sector before increasing exposure. Use Gate.com for simplified trading experience
✅ Experienced investors: Consider ADX as a speculative position within a diversified web3 infrastructure portfolio, maintaining strict position sizing and stop-loss disciplines
✅ Institutional investors: Conduct thorough due diligence on the AdEx platform's adoption metrics, revenue model, and competitive positioning before considering allocation
ADX Trading Participation Methods
- Spot trading: Purchase ADX tokens on Gate.com and other supported exchanges (listed on 16 exchanges) for direct ownership
- Portfolio integration: Include ADX as part of a broader web3 infrastructure investment strategy alongside other blockchain technology tokens
- Regular monitoring: Track the platform's development updates, partnership announcements, and user adoption metrics to inform holding decisions
Cryptocurrency investments carry extremely high risks, and this article does not constitute investment advice. Investors should make prudent decisions based on their own risk tolerance and are advised to consult professional financial advisors. Never invest more than you can afford to lose.
FAQ
What is the ADX indicator and how does it help predict price trends?
ADX(Average Directional Index)measures trend strength from 0-100. Readings above 25 indicate strong trends, below 20 suggest weak trends. ADX helps traders identify when price momentum is building, enabling better entry timing for ADX token price movements and trend-following strategies.
How to use ADX indicator for trading decisions and risk management?
ADX measures trend strength above 25 indicating strong momentum. Use ADX above 25 to confirm entries, combine with price action for exits. Set stop-loss below recent lows, take profits at resistance. ADX below 20 signals weak trends, avoid trading. Scale position size based on ADX strength for risk control.
What is the accuracy rate of ADX price predictions and what are its limitations?
ADX price predictions typically achieve 60-75% accuracy in trending markets, using technical analysis and on-chain data. Limitations include market volatility, sudden regulatory changes, and unpredictable macroeconomic events that can significantly impact predictions.
What are the advantages and disadvantages of ADX compared to other technical indicators like MACD and RSI?
ADX excels at measuring trend strength independently of direction, ideal for trend confirmation. Unlike MACD and RSI which focus on momentum and overbought/oversold conditions, ADX avoids false signals in ranging markets. However, ADX lags during trend initiation. Combining ADX with MACD and RSI provides comprehensive analysis: ADX confirms trends, MACD identifies entries, RSI validates momentum for stronger predictions.
How should I combine ADX with other analysis methods to predict prices in actual trading?
Combine ADX with moving averages and support/resistance levels for comprehensive analysis. Use ADX to confirm trend strength, apply RSI for overbought/oversold conditions, and monitor trading volume for entry signals. This multi-method approach enhances prediction accuracy and trading decision-making effectiveness.
What do ADX values above 20, 40, and 50 mean, and how should they be interpreted?
ADX below 20 indicates weak trend strength. ADX 20-40 shows moderate trend development with increasing momentum. ADX above 40 signals strong trending conditions. ADX above 50 represents very strong trend momentum, suggesting potential significant price movements and trading opportunities ahead.
* The information is not intended to be and does not constitute financial advice or any other recommendation of any sort offered or endorsed by Gate.