This comprehensive analysis examines ALI (Artificial Liquid Intelligence) price trends from 2026 to 2031, offering professional forecasts for investors. Currently trading at $0.002451 with a $22.35 million market cap, ALI operates as an innovative iNFT protocol combining generative AI and blockchain technology. The article provides conservative to optimistic price predictions, ranging from $0.00213 to $0.00303 in 2026, potentially reaching $0.0067 by 2031. It covers critical factors influencing ALI's valuation, including ecosystem development, market sentiment, and regulatory environment. Additionally, the guide outlines investment strategies for different investor profiles, risk management frameworks, security best practices on Gate, and potential challenges including liquidity concerns and technological risks. Ideal for those evaluating ALI as part of AI-blockchain portfolio exposure.
Introduction: ALI's Market Position and Investment Value
Artificial Liquid Intelligence (ALI), as a pioneering protocol for intelligent and interactive NFTs (iNFTs), has been driving innovation at the intersection of generative AI and blockchain technology since its inception. As of 2026, ALI maintains a market capitalization of approximately $22.35 million, with a circulating supply of around 9.12 billion tokens and a trading price hovering near $0.002451. This asset, recognized as a groundbreaking solution for decentralized AI governance and NFT intelligence, is playing an increasingly vital role in the metaverse and AI-powered digital asset ecosystems.
This article will comprehensively analyze ALI's price trajectory from 2026 to 2031, combining historical patterns, market supply-demand dynamics, ecosystem development, and macroeconomic conditions to provide investors with professional price forecasts and practical investment strategies.
I. ALI Price History Review and Current Market Status
ALI Historical Price Evolution Trajectory
- 2022: ALI reached a notable price level of $0.201312 on April 2, marking a significant milestone in its early trading history
- 2025: The token experienced substantial market pressure, with the price declining to $0.00196181 on December 18, representing a considerable correction from previous levels
- Recent Period: Market volatility has characterized ALI's performance, with the token trading within a range that reflects broader shifts in the digital asset landscape
ALI Current Market Situation
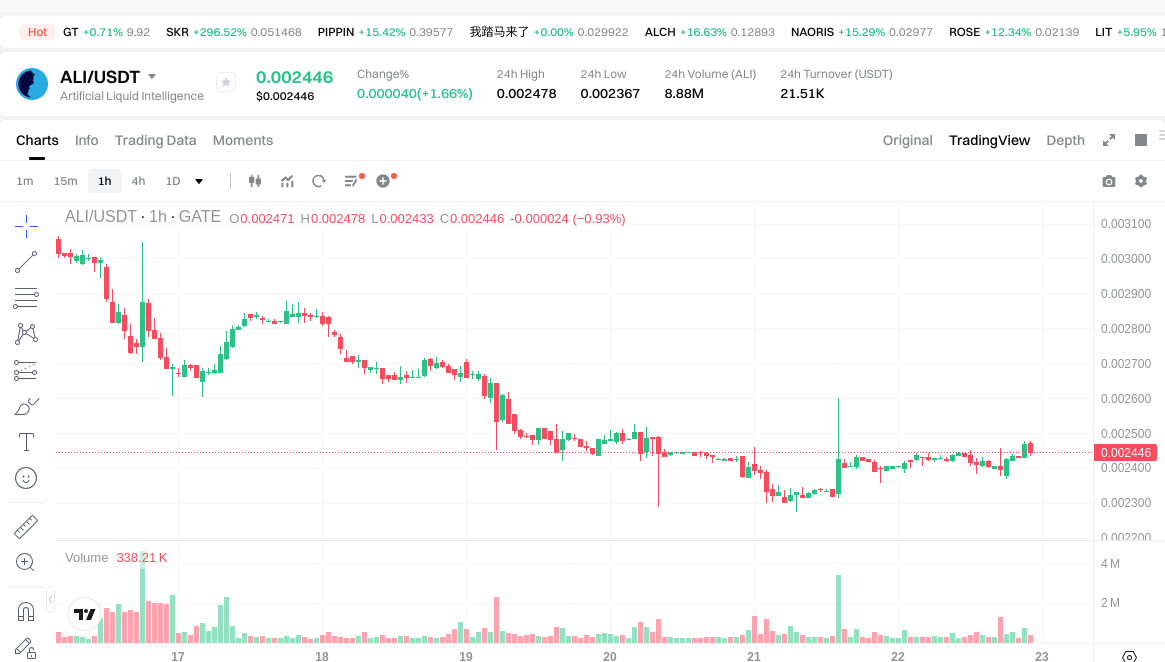
As of January 22, 2026, ALI is trading at $0.002451, reflecting a 2.41% increase over the past 24 hours. The token has demonstrated mixed short-term performance, with a 1-hour decline of 0.33% contrasting with the daily gain. Over the past week, ALI has experienced a 19.03% decrease, while the 30-day performance shows an 18.23% increase. The annual performance indicates an 82.62% decline compared to the previous year.
The current 24-hour trading volume stands at $21,523.38, with the price fluctuating between a low of $0.002367 and a high of $0.002478 during this period. ALI's market capitalization is approximately $22.35 million, with a circulating supply of 9.12 billion tokens out of a maximum supply of 9.87 billion tokens, representing a circulation ratio of 92.37%. The fully diluted market valuation is estimated at $24.19 million.
The token holds a market ranking of 828 and accounts for 0.00076% of the total cryptocurrency market. According to available market sentiment data, the current environment reflects extreme caution among participants, with a fear index reading of 20.
ALI operates as an ERC-20 utility token on the Ethereum blockchain, with its smart contract address verified at 0x6B0b3a982b4634aC68dD83a4DBF02311cE324181. The token has attracted a holder base of approximately 16,119 addresses and is listed on 8 exchanges, including Gate.com.
Click to view the current ALI market price
ALI Market Sentiment Index
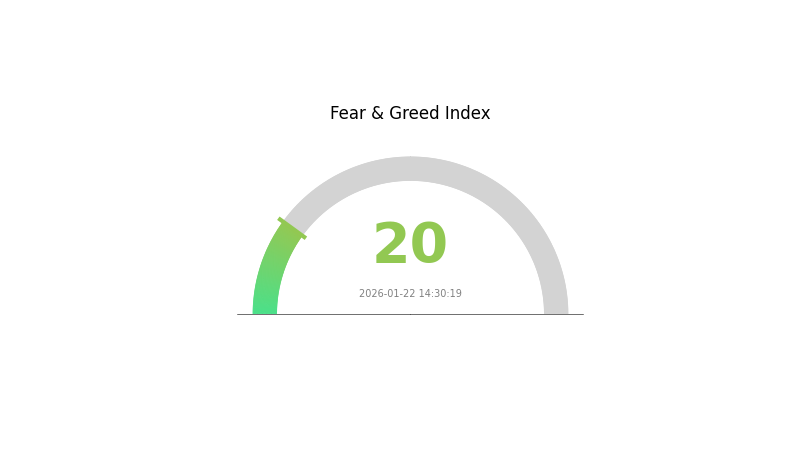
2026-01-22 Fear and Greed Index: 20 (Extreme Fear)
Click to view current Fear & Greed Index
The cryptocurrency market is currently experiencing extreme fear, with the index at 20. This indicates heightened market anxiety and pessimism among investors. During periods of extreme fear, asset prices typically decline as panic selling intensifies. Experienced traders often view such conditions as potential buying opportunities, as markets tend to recover from extreme sentiment readings. However, caution is advised, as further volatility may occur before stabilization. Monitoring market fundamentals and maintaining proper risk management strategies remain essential during this fearful market phase.
ALI Holding Distribution
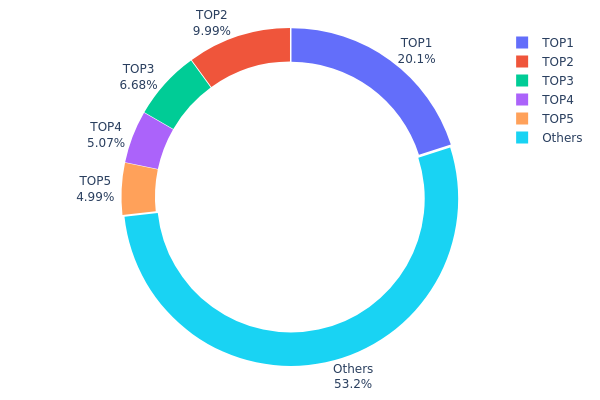
The holding distribution chart represents the concentration of ALI tokens across different wallet addresses, providing insights into the decentralization level and potential market control by major holders. As of January 22, 2026, the top five addresses collectively hold 46.76% of the total ALI supply, with the largest single address (0x6c63...0ec75c) controlling approximately 20.06% of all tokens. This indicates a moderately high concentration level, where nearly half of the circulating supply is controlled by a handful of entities. The second-largest holder accounts for 9.98%, followed by 6.67%, 5.06%, and 4.99% respectively, demonstrating a gradually declining distribution pattern among the top holders.
This concentration structure presents both opportunities and risks for market dynamics. The presence of large holders can provide price stability during volatile periods, as these entities typically have long-term investment horizons and are less likely to engage in panic selling. However, the significant control by top addresses also introduces potential price manipulation risks, as coordinated sell-offs from multiple large holders could trigger substantial downward pressure. The remaining 53.24% held by other addresses suggests a relatively broad base of smaller participants, which provides some buffer against extreme concentration effects and indicates moderate retail participation in the ALI ecosystem.
From an on-chain structure perspective, ALI's current distribution pattern reflects a semi-centralized holding model that is common among utility tokens with institutional backing or early-stage project development. While not reaching the concerning threshold where a single entity could unilaterally influence market direction, the concentration warrants continued monitoring. The gradual decline in holding percentages from the first to fifth-largest addresses, rather than a sharp drop-off, suggests a more balanced power distribution among major stakeholders, which contributes positively to the token's governance stability and reduces the likelihood of sudden structural shifts in the market.
Click to view current ALI Holding Distribution
| Top |
Address |
Holding Qty |
Holding (%) |
| 1 |
0x6c63...0ec75c |
1980159.51K |
20.06% |
| 2 |
0x404f...79c770 |
985833.33K |
9.98% |
| 3 |
0x26aa...7603c8 |
659062.52K |
6.67% |
| 4 |
0x9812...4ef859 |
500000.00K |
5.06% |
| 5 |
0x7871...6f2a1d |
492701.64K |
4.99% |
| - |
Others |
5253146.74K |
53.24% |
II. Core Factors Affecting ALI's Future Price
Based on the currently available information, there is insufficient data to provide a comprehensive analysis of the core factors that may influence ALI's future price movements. A thorough evaluation would require detailed information about supply mechanisms, institutional holdings, macroeconomic conditions, and technical developments within the ALI ecosystem.
Investors interested in ALI should conduct their own research and seek additional sources of information before making any investment decisions. Market conditions can change rapidly, and multiple factors may simultaneously impact cryptocurrency valuations.
III. 2026-2031 ALI Price Prediction
2026 Outlook
- Conservative prediction: $0.00213 - $0.00245
- Neutral prediction: Around $0.00245
- Optimistic prediction: Up to $0.00303 (requires favorable market conditions and ecosystem development)
2027-2029 Outlook
- Market stage expectation: Potential gradual growth phase with increasing adoption and ecosystem expansion
- Price range prediction:
- 2027: $0.00255 - $0.00381 (approximately 11% increase)
- 2028: $0.00236 - $0.00481 (approximately 33% increase)
- 2029: $0.0021 - $0.00558 (approximately 64% increase)
- Key catalysts: Platform adoption growth, technological upgrades, and broader market sentiment in the AI and blockchain sectors
2030-2031 Long-term Outlook
- Baseline scenario: $0.00433 - $0.00635 (assuming steady ecosystem development and market maturity)
- Optimistic scenario: $0.00558 - $0.0067 (assuming accelerated adoption and favorable regulatory environment)
- Transformative scenario: Potential to reach upper ranges if significant partnerships and breakthrough innovations materialize
- 2026-01-22: ALI trading within initial predicted range of $0.00213 - $0.00303 (early stage of projected growth cycle)
| Year |
Predicted High Price |
Predicted Average Price |
Predicted Low Price |
Price Change |
| 2026 |
0.00303 |
0.00245 |
0.00213 |
0 |
| 2027 |
0.00381 |
0.00274 |
0.00255 |
11 |
| 2028 |
0.00481 |
0.00327 |
0.00236 |
33 |
| 2029 |
0.00558 |
0.00404 |
0.0021 |
64 |
| 2030 |
0.00635 |
0.00481 |
0.00433 |
96 |
| 2031 |
0.0067 |
0.00558 |
0.00368 |
127 |
IV. ALI Professional Investment Strategy and Risk Management
ALI Investment Methodology
(1) Long-term Holding Strategy
- Suitable for: Investors focused on AI and blockchain convergence with medium to high risk tolerance
- Operational Recommendations:
- Consider accumulating positions during market corrections when price approaches key support levels
- Monitor developments in the iNFT protocol ecosystem and Noah's Ark metaverse adoption metrics
- Utilize secure storage solutions such as Gate Web3 Wallet for long-term asset custody
(2) Active Trading Strategy
- Technical Analysis Tools:
- Volume Analysis: Monitor the 24-hour trading volume of approximately $21,523 to identify liquidity trends and potential breakout signals
- Support and Resistance Levels: Track the 24-hour range between $0.002367 (low) and $0.002478 (high) to establish short-term trading boundaries
- Swing Trading Points:
- Consider the 7-day decline of 19.03% as a potential oversold condition for reversal opportunities
- Monitor the 30-day gain of 18.23% to assess medium-term momentum and trend strength
ALI Risk Management Framework
(1) Asset Allocation Principles
- Conservative Investors: 1-3% of crypto portfolio allocation
- Aggressive Investors: 5-8% of crypto portfolio allocation
- Professional Investors: Up to 10-15% with active hedging strategies
(2) Risk Hedging Solutions
- Diversification Strategy: Balance ALI exposure with established large-cap cryptocurrencies to reduce portfolio volatility
- Position Sizing: Implement staged entry and exit strategies to minimize timing risk
(3) Secure Storage Solutions
- Hot Wallet Recommendation: Gate Web3 Wallet for convenient trading and ecosystem participation
- Cold Storage Solution: Hardware wallet storage for long-term holdings exceeding investment comfort levels
- Security Precautions: Never share private keys or seed phrases; enable two-factor authentication on all exchange accounts; verify contract addresses (0x6B0b3a982b4634aC68dD83a4DBF02311cE324181 on Ethereum) before transactions
V. ALI Potential Risks and Challenges
ALI Market Risks
- High Volatility: ALI experienced an 82.62% decline over one year, demonstrating significant price volatility that may result in substantial capital loss
- Liquidity Concerns: With a market capitalization of approximately $22.35 million and ranking at 828, the token faces relatively limited trading depth compared to major cryptocurrencies
- Market Concentration: A circulating supply of 9.12 billion tokens with only 16,119 holders suggests concentrated ownership that could amplify price movements
ALI Regulatory Risks
- NFT Classification Uncertainty: Regulatory frameworks for intelligent NFTs (iNFTs) remain underdeveloped across major jurisdictions, creating compliance uncertainty
- AI Technology Oversight: Increasing scrutiny of AI applications globally may impact projects combining blockchain and artificial intelligence
- Cross-border Compliance: Operating across multiple jurisdictions exposes the project to varying regulatory requirements and potential restrictions
ALI Technical Risks
- Smart Contract Vulnerabilities: As an ERC-20 token with complex iNFT protocol integrations, potential security flaws could compromise user assets
- Protocol Adoption Risk: The success of ALI depends on widespread adoption of the iNFT standard and Noah's Ark metaverse, which remains uncertain
- Technological Obsolescence: Rapid evolution in both AI and blockchain sectors may render current technical implementations less competitive
VI. Conclusion and Action Recommendations
ALI Investment Value Assessment
ALI represents an innovative intersection of generative AI and blockchain technology through its iNFT protocol. With a current price of $0.0024 and market dominance of 0.00076%, the token offers exposure to the emerging intelligent NFT sector. The 18.23% gain over 30 days suggests recovering momentum following the 19.03% weekly decline. However, the 82.62% annual decline from its historical high of $0.201 indicates substantial risk. The project's focus on decentralized AI governance and metaverse applications positions it within growing sectors, but execution risks remain significant given its current market ranking and limited liquidity.
ALI Investment Recommendations
✅ Beginners: Limit exposure to 1-2% of total crypto portfolio; focus on understanding iNFT technology and monitoring ecosystem development before increasing positions; utilize Gate.com for spot trading with strict stop-loss orders
✅ Experienced Investors: Consider 3-5% allocation as a speculative position in the AI-blockchain convergence theme; implement dollar-cost averaging during market weakness; actively monitor protocol updates and metaverse adoption metrics
✅ Institutional Investors: Evaluate ALI as part of a broader thematic AI-blockchain portfolio with 5-10% allocation; conduct thorough due diligence on technological infrastructure and team execution capabilities; consider strategic partnerships or direct protocol participation
ALI Trading Participation Methods
- Spot Trading on Gate.com: Direct purchase and sale of ALI tokens with access to real-time market data and competitive trading fees
- Gate Web3 Wallet Integration: Secure self-custody solution enabling direct interaction with iNFT protocol and Noah's Ark metaverse applications
- Staged Accumulation: Implement systematic purchase plans during market corrections to build positions at favorable average entry prices
Cryptocurrency investment carries extremely high risk, and this article does not constitute investment advice. Investors should make cautious decisions based on their own risk tolerance and are advised to consult professional financial advisors. Never invest more than you can afford to lose.
FAQ
What is the current price of ALI, and what are its historical highest and lowest prices?
ALI's current price fluctuates based on market conditions. Historical data shows ALI has experienced significant price movements since its launch, reaching notable highs during bull market periods and lows during market corrections. For real-time pricing information, check current market data sources to get the most accurate and up-to-date price, all-time high, and all-time low figures.
What are the main factors affecting ALI price?
ALI price is primarily influenced by market demand and trading volume, project development progress, overall crypto market trends, investor sentiment, and regulatory developments in the Web3 sector.
How to conduct ALI price technical analysis and prediction?
Analyze ALI price trends using candlestick charts, moving averages, and RSI indicators. Monitor trading volume, support/resistance levels, and market sentiment. Track on-chain metrics and correlation with broader crypto market movements for comprehensive prediction insights.
What are professional analysts' predictions for ALI's future price?
Professional analysts project ALI could reach $0.50-$1.50 by late 2026, driven by increasing adoption, ecosystem expansion, and positive market sentiment. Growth potential depends on technological developments and market conditions.
How is ALI's price correlation with other cryptocurrencies or assets?
ALI shows moderate positive correlation with major cryptocurrencies like Bitcoin and Ethereum during bull markets, driven by overall market sentiment. During market corrections, ALI typically moves independently based on project fundamentals and adoption metrics. Its correlation strengthens during periods of high trading volume across the crypto market.
What are the risks and opportunities of investing in ALI?
Opportunities: ALI benefits from growing AI adoption, strong tokenomics, and increasing institutional interest in AI-crypto convergence. Risks include market volatility, regulatory uncertainty, and competition in the AI sector. Early investors may see significant upside as the project matures and gains mainstream recognition.
* The information is not intended to be and does not constitute financial advice or any other recommendation of any sort offered or endorsed by Gate.