This comprehensive analysis examines ARIA's market position and price trajectory through 2031, providing investors with data-driven forecasts and strategic guidance. Currently trading at $0.0793 with a $14.52 million market cap, ARIA demonstrates the convergence of Web2 gaming standards with Web3 innovation through AI technology. The article evaluates historical performance, current market sentiment (extreme fear at index 25), and token distribution patterns, revealing concentrated holdings among top addresses. Price forecasts range from $0.04769 to $0.10889 for 2026, with potential reaches to $0.16902 by 2030 under optimistic scenarios. Essential risk considerations include price volatility, liquidity constraints, and regulatory uncertainties. The analysis provides tailored investment methodologies for beginners, experienced traders, and institutional investors, emphasizing portfolio allocation principles and secure asset storage through Gate Web3 Wallet solutions.
Introduction: ARIA's Market Position and Investment Value
AriaAI (ARIA), as a next-generation gaming development and publishing project inspired by Disney-style immersive worlds and AI technology, has been making notable progress in the Web3 gaming sector since its launch in 2025. As of 2026, ARIA has achieved a market capitalization of approximately $14.52 million, with a circulating supply of around 183 million tokens, and its price hovers around $0.0793. This asset, representing the convergence of Web2 gaming quality standards with Web3 innovation through AI implementation, is playing an increasingly relevant role in the blockchain gaming and AI-integrated entertainment sectors.
This article will comprehensively analyze ARIA's price trajectory from 2026 to 2031, combining historical patterns, market supply and demand dynamics, ecosystem development, and macroeconomic conditions to provide investors with professional price forecasts and practical investment strategies.
I. ARIA Price History Review and Market Overview
ARIA Historical Price Evolution Trajectory
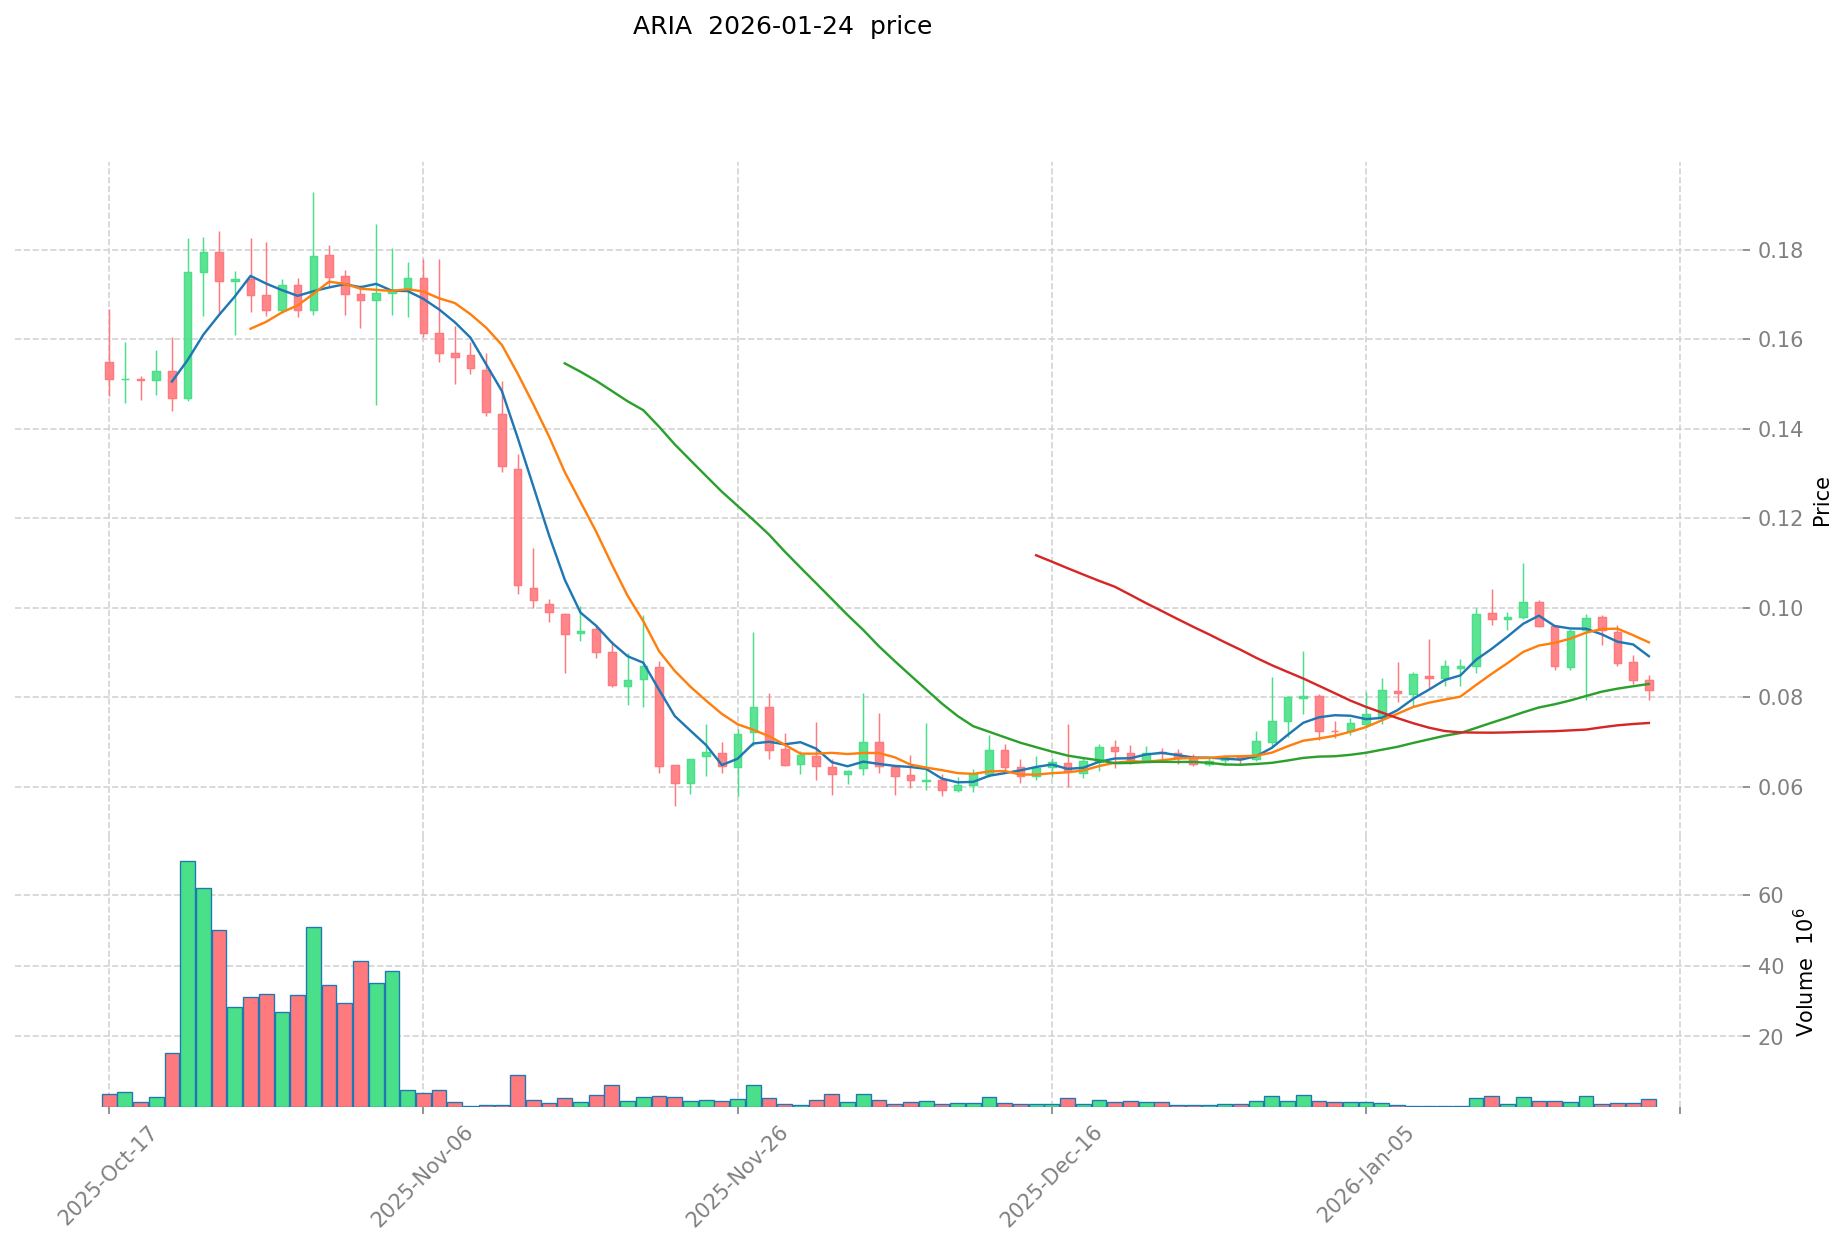
- 2025: ARIA experienced notable price volatility throughout its initial trading period, with the price establishing its all-time low at $0.01 on August 21, 2025
- 2025: The token reached a significant milestone on October 1, 2025, achieving its all-time high of $0.24838, representing substantial growth from its launch price
- Late 2025 to Early 2026: Following the October peak, ARIA entered a consolidation phase, with the price adjusting downward as part of broader market dynamics
ARIA Current Market Status
As of January 24, 2026, ARIA is trading at $0.07933, reflecting a decline from its historical peak but maintaining a position above its all-time low. The token has demonstrated mixed performance across different timeframes, with a 1-year gain of approximately 33.94% and a 30-day increase of around 18.98%. However, shorter-term metrics show downward pressure, with a 7-day decline of approximately 11.88% and a 24-hour decrease of 0.84%.
ARIA's 24-hour trading range spans from $0.07754 to $0.08252, with a total trading volume of approximately $70,030. The project maintains a market capitalization of approximately $14.52 million, with 183 million tokens in circulation representing 18.3% of the maximum supply of 1 billion tokens. The fully diluted market cap stands at approximately $79.33 million.
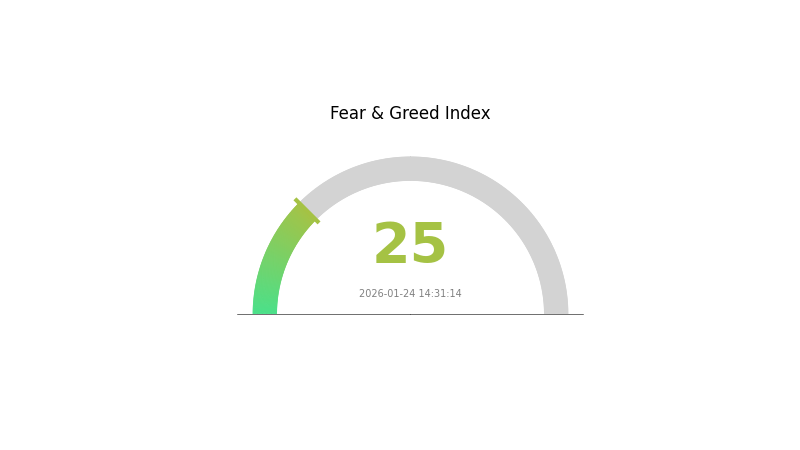
The token has attracted a community of approximately 79,189 holders and is available on 16 exchanges, indicating growing accessibility. The current market sentiment index registers at 25, corresponding to an extreme fear level in the broader cryptocurrency market environment.
Click to view current ARIA market price
ARIA Market Sentiment Index
2026-01-24 Fear & Greed Index: 25 (Extreme Fear)
Click to view current Fear & Greed Index
The crypto market is currently experiencing extreme fear with the ARIA index at 25, indicating significant pessimism among investors. This level suggests heightened market anxiety and potential capitulation, where selling pressure intensifies due to negative sentiment. During extreme fear periods, the market often presents contrarian opportunities for long-term investors, as asset prices may be undervalued. However, caution is warranted as volatility remains elevated and further downside movements are possible. Market participants should monitor key support levels and consider risk management strategies while assessing entry opportunities.
ARIA Token Holding Distribution
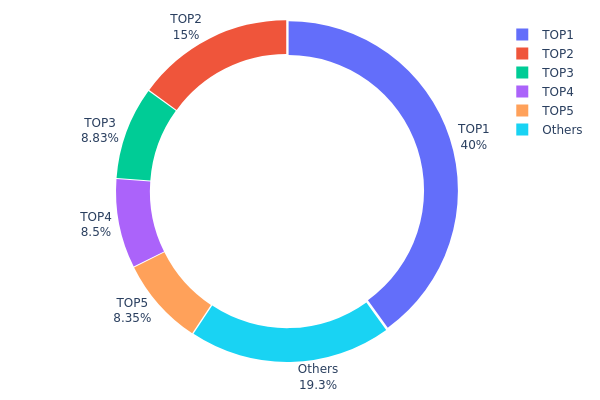
The token holding distribution chart reveals the allocation pattern of ARIA tokens across different wallet addresses, serving as a crucial indicator of market decentralization and potential concentration risks. By analyzing the proportion of tokens held by top addresses versus smaller holders, investors can assess the project's structural stability and susceptibility to price manipulation.
According to the current on-chain data, ARIA exhibits a notably high concentration pattern. The top five addresses collectively control 70.72% of the total token supply, with the largest single address holding 400.42 million tokens (40.04%), followed by the second-largest at 150 million tokens (15.00%). This pronounced concentration presents significant structural concerns, as a relatively small number of entities possess substantial control over the token's circulating supply. The remaining addresses outside the top five hold only 19.28% collectively, indicating a heavily skewed distribution landscape.
This concentrated holding structure poses several market implications. From a price volatility perspective, large-scale sell-offs by top holders could trigger dramatic price movements, creating heightened risk for retail investors. The lack of broad distribution suggests limited decentralization, potentially compromising the project's resistance to coordinated manipulation. While such concentration is not uncommon during early project stages or for tokens with strategic lockups, investors should remain vigilant about the potential for sudden supply releases that could impact market liquidity and price stability.
Click to view current ARIA Token Holding Distribution
| Top |
Address |
Holding Qty |
Holding (%) |
| 1 |
0x4747...376d91 |
400416.67K |
40.04% |
| 2 |
0xf88b...5f02c1 |
150000.00K |
15.00% |
| 3 |
0xc119...3d01cd |
88325.56K |
8.83% |
| 4 |
0x40f5...d8cef0 |
85000.00K |
8.50% |
| 5 |
0x28ef...510890 |
83527.78K |
8.35% |
| - |
Others |
192730.00K |
19.28% |
II. Core Factors Influencing ARIA's Future Price
Based on the currently available information, there is insufficient data to conduct a comprehensive analysis of the core factors that may influence ARIA's future price. The specific supply mechanisms, institutional dynamics, macroeconomic correlations, and technical developments related to ARIA cannot be determined from the provided materials.
As market conditions evolve and more information becomes available, these factors can be evaluated more thoroughly to assess their potential impact on ARIA's price trajectory.
III. 2026-2031 ARIA Price Forecast
2026 Outlook
- Conservative forecast: $0.04769 - $0.07948
- Neutral forecast: $0.07948
- Optimistic forecast: $0.10889 (requires favorable market conditions and increased adoption)
2027-2029 Mid-term Outlook
- Market stage expectation: The token is projected to enter a gradual growth phase with moderate volatility, potentially driven by ecosystem development and broader market recovery.
- Price range forecast:
- 2027: $0.07252 - $0.13562
- 2028: $0.08158 - $0.12295
- 2029: $0.07492 - $0.12963
- Key catalysts: Technology upgrades, strategic partnerships, and expanding use cases within the ecosystem may serve as primary drivers for price appreciation.
2030-2031 Long-term Outlook
- Baseline scenario: $0.09694 - $0.12428 (assuming steady ecosystem growth and stable market conditions)
- Optimistic scenario: $0.13492 - $0.16902 (contingent on significant technological breakthroughs and widespread adoption)
- Transformative scenario: Potential to reach $0.16902 (requires exceptional market conditions, major institutional adoption, and sustained bull market momentum)
- January 24, 2026: ARIA is positioned at the beginning of its forecasted growth trajectory, with analysts projecting incremental gains over the next five years based on historical performance patterns and market dynamics.
| Year |
Predicted High Price |
Predicted Average Price |
Predicted Low Price |
Price Change |
| 2026 |
0.10889 |
0.07948 |
0.04769 |
0 |
| 2027 |
0.13562 |
0.09418 |
0.07252 |
18 |
| 2028 |
0.12295 |
0.1149 |
0.08158 |
44 |
| 2029 |
0.12963 |
0.11893 |
0.07492 |
49 |
| 2030 |
0.16902 |
0.12428 |
0.09694 |
56 |
| 2031 |
0.15251 |
0.14665 |
0.13492 |
84 |
IV. ARIA Professional Investment Strategy and Risk Management
ARIA Investment Methodology
(1) Long-term Holding Strategy
- Suitable for: Investors seeking exposure to AI-integrated gaming projects with moderate risk tolerance
- Operational Recommendations:
- Consider gradual accumulation during price corrections to average entry costs
- Monitor project development milestones and technological implementation progress
- Utilize secure storage solutions such as Gate Web3 Wallet for long-term asset custody
(2) Active Trading Strategy
- Technical Analysis Tools:
- Volume Analysis: Monitor the 24-hour trading volume (currently at 70,030.58 USDT) to identify liquidity trends and potential breakout signals
- Price Range Analysis: Track the 24-hour high (0.08252 USDT) and low (0.07754 USDT) to establish support and resistance levels
- Swing Trading Considerations:
- Observe short-term volatility patterns, noting the recent 7-day decline of 11.88% against the 30-day gain of 18.98%
- Set appropriate stop-loss orders to manage downside risk in volatile market conditions
ARIA Risk Management Framework
(1) Asset Allocation Principles
- Conservative Investors: 1-3% of crypto portfolio allocation
- Aggressive Investors: 5-8% of crypto portfolio allocation
- Professional Investors: Up to 10% with active hedging strategies
(2) Risk Hedging Solutions
- Portfolio Diversification: Balance ARIA holdings with established crypto assets to mitigate project-specific risks
- Position Sizing: Limit individual position size relative to overall portfolio value
(3) Secure Storage Solutions
- Hot Wallet Recommendation: Gate Web3 Wallet for active trading and convenient access
- Cold Storage Solution: Hardware wallet integration for long-term holdings exceeding trading needs
- Security Precautions: Enable two-factor authentication, verify contract addresses (0x5d3a12c42e5372b2cc3264ab3cdcf660a1555238 on BSC), and avoid sharing private keys
V. ARIA Potential Risks and Challenges
ARIA Market Risks
- Price Volatility: ARIA has experienced significant fluctuations, with a 7-day decline of 11.88% despite broader 30-day gains of 18.98%
- Liquidity Concerns: With a 24-hour trading volume of approximately 70,030 USDT and market capitalization of 14.52 million USDT, liquidity may be limited during market stress
- Market Dominance: ARIA represents only 0.0025% of the crypto market, indicating susceptibility to broader market sentiment shifts
ARIA Regulatory Risks
- Gaming Token Classification: Evolving regulatory frameworks for blockchain-based gaming assets may impact token utility and trading availability
- Cross-border Compliance: As a gaming platform integrating AI technology, ARIA may face varying regulatory requirements across different jurisdictions
- Smart Contract Jurisdiction: BEP-20 token operations on BSC may be subject to regulatory scrutiny affecting DeFi and gaming tokens
ARIA Technical Risks
- Smart Contract Vulnerabilities: As with all blockchain projects, potential security flaws in smart contract code could affect token functionality
- Platform Development Risk: The success of ARIA depends on the continued development and adoption of its gaming ecosystem
- Technology Integration: The experimental nature of combining AI technology with Web3 gaming introduces execution risks
VI. Conclusion and Action Recommendations
ARIA Investment Value Assessment
ARIA represents an experimental approach to merging AI technology with Web3 gaming, targeting the intersection of immersive entertainment and blockchain infrastructure. While the project shows positive 30-day performance (18.98% gain) and year-to-date returns (33.94%), investors should note the limited circulating supply (18.3% of total supply) and recent short-term volatility. The long-term value proposition depends on successful execution of the gaming platform and adoption within the Web3 gaming community. Short-term risks include market volatility, regulatory uncertainty, and the early-stage nature of the project.
ARIA Investment Recommendations
✅ Beginners: Start with minimal allocation (1-2% of crypto portfolio) and focus on understanding the project fundamentals before increasing exposure
✅ Experienced Investors: Consider strategic accumulation during price corrections while monitoring development progress and community growth
✅ Institutional Investors: Conduct thorough due diligence on technology integration, team execution capability, and market positioning before committing significant capital
ARIA Trading Participation Methods
- Spot Trading: Purchase ARIA through Gate.com spot markets with multiple trading pairs available
- DCA Strategy: Implement dollar-cost averaging to reduce timing risk in volatile market conditions
- Research-based Approach: Monitor project updates, gaming platform development, and community engagement metrics before making investment decisions
Cryptocurrency investment carries extremely high risks, and this article does not constitute investment advice. Investors should make prudent decisions based on their own risk tolerance and are advised to consult professional financial advisors. Never invest more than you can afford to lose.
FAQ
What is ARIA? What are its use cases and value proposition?
ARIA is a Web3 utility token designed for decentralized prediction markets and AI-driven analytics. Its value proposition includes enabling users to participate in price forecasting, governance participation, and accessing premium predictive insights. ARIA facilitates trustless transactions and rewards accurate predictions within the ecosystem.
ARIA has demonstrated strong growth momentum since launch, with prices appreciating significantly through multiple market cycles. The token experienced key rallies during bull market phases, showing resilience during corrections. Recent trends indicate sustained upward momentum, with growing adoption driving increased trading volume and price discovery throughout 2025-2026.
What are the main factors affecting ARIA price?
ARIA price is primarily influenced by market demand and trading volume, network adoption rates, overall cryptocurrency market sentiment, project development progress, and macroeconomic conditions. Supply dynamics and investor confidence also play significant roles in price movements.
What is the price prediction for ARIA in 2024?
Based on market analysis and historical trends, ARIA demonstrated strong growth potential through 2024. Analysts projected price ranges between $0.15-$0.35, driven by increasing adoption, ecosystem development, and market recovery. However, actual performance depends on broader market conditions and project milestones.
What are the risks and uncertainties to consider in ARIA price predictions?
ARIA price predictions involve market volatility, regulatory changes, liquidity fluctuations, and macroeconomic factors. Technical analysis accuracy depends on historical data patterns, while sentiment shifts and adoption rates directly impact valuation. Consider multiple data sources and timeframes for comprehensive analysis.
How to conduct ARIA price technical analysis and fundamental analysis?
For technical analysis, monitor ARIA price charts, trading volume, moving averages, and support/resistance levels. For fundamental analysis, evaluate project development progress, team strength, partnerships, tokenomics, and market adoption. Combine both approaches to assess ARIA's potential.
* The information is not intended to be and does not constitute financial advice or any other recommendation of any sort offered or endorsed by Gate.