This comprehensive article analyzes ARPA's price trajectory and investment potential from 2026 to 2031, providing expert forecasts for this privacy computing protocol token. Currently trading at $0.01402 with extreme market fear sentiment, ARPA demonstrates moderate holder concentration with strong technical innovation in secure multi-party computation across finance, healthcare, and enterprise sectors. The analysis projects conservative to optimistic price ranges, with 2026 predictions of $0.00913-$0.01797 and long-term targets potentially reaching $0.03221 by 2031, representing 65% growth potential. The article details three investment strategies—long-term holding, active trading, and dollar-cost averaging—suitable for different investor profiles, emphasizing position sizing of 1-10% based on risk tolerance. Critical risk factors including market volatility, regulatory scrutiny, liquidity constraints, and competition are thoroughly examined. Investors can trade ARPA on Gate.com with appropriate security mea
Introduction: ARPA's Market Position and Investment Value
ARPA (ARPA) serves as a flexible and highly compatible privacy computing protocol layer for mainstream public blockchains, focusing on multi-party secure computation technology. Since its inception in 2019, the project has established partnerships across financial transactions, credit investigation, marketing, and healthcare sectors. As of 2026, ARPA maintains a market capitalization of approximately $13.77 million, with a circulating supply of around 982.17 million tokens, and the price hovering around $0.01402. This privacy-focused computing network, recognized for its cryptographic innovation in secure data sharing, is playing an increasingly important role in enterprise data integration and collaborative computing applications.
This article will comprehensively analyze ARPA's price trends from 2026 to 2031, combining historical patterns, market supply-demand dynamics, ecosystem development, and macroeconomic factors to provide investors with professional price forecasts and practical investment strategies.
I. ARPA Price History Review and Market Status
ARPA Historical Price Evolution Trajectory
- 2020: ARPA recorded its all-time low price of $0.00339441 on March 13, with the token experiencing significant volatility during the early stages of market development.
- 2021: ARPA reached its all-time high price of $0.268622 on November 3, representing substantial growth as the privacy computing narrative gained traction in the crypto market.
- 2022-2025: Following the broader market downturn, ARPA entered a prolonged consolidation phase, with price declining from previous highs as overall market sentiment shifted.
ARPA Current Market Status
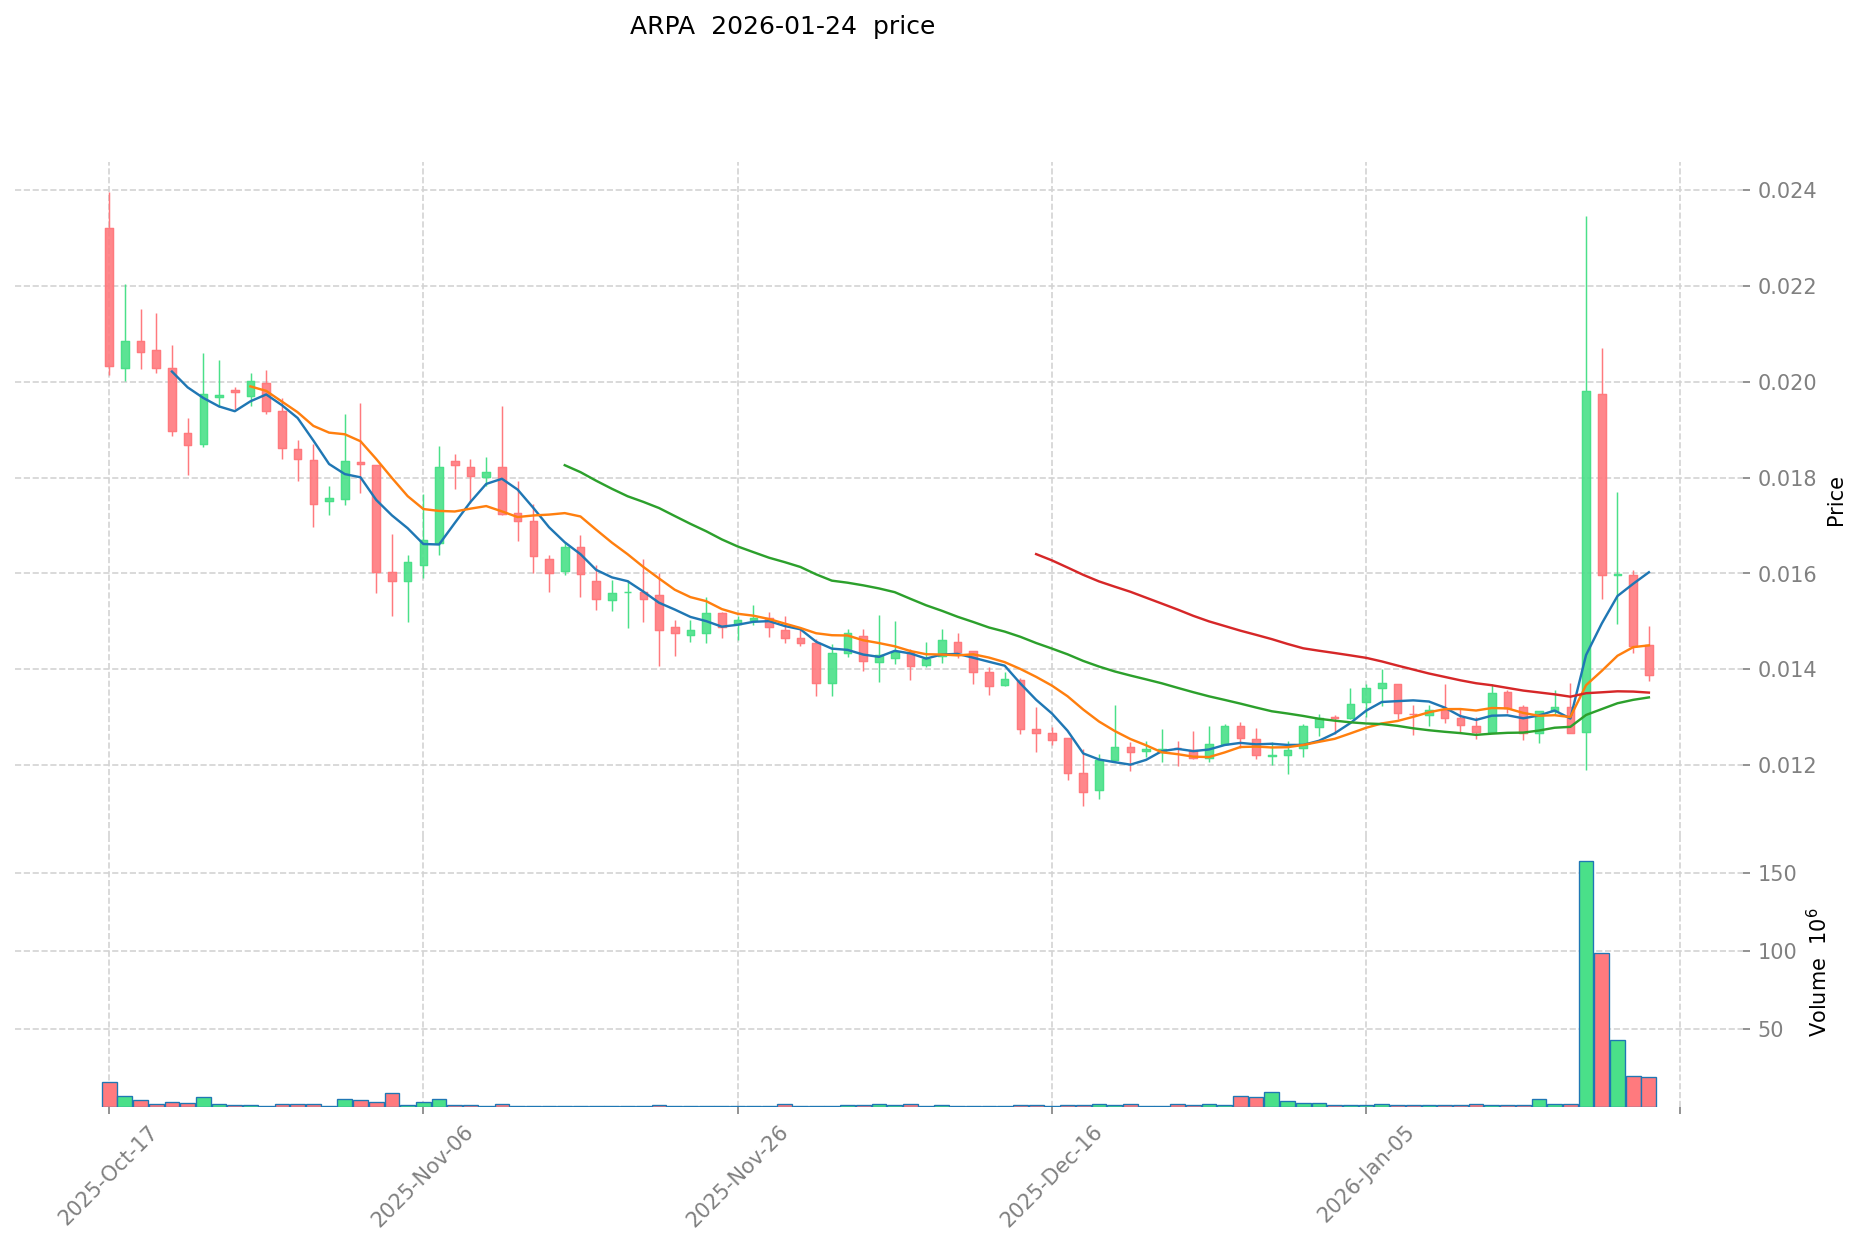
As of January 25, 2026, ARPA is trading at $0.01402, showing a 24-hour price change of -1.74%. The token has demonstrated recent volatility with a 1-hour change of +0.64%, a 7-day increase of 5.25%, and a 30-day gain of 12.86%. However, the 1-year performance shows a decline of -67.56%.
The 24-hour trading range spans from $0.0134 to $0.01445, with total trading volume reaching $210,192.13. ARPA's circulating supply stands at 982,174,603.29 tokens, representing approximately 49.11% of the maximum supply of 2 billion tokens. The current market capitalization is $13,770,087.94, with a fully diluted valuation of $28,039,999.99.
ARPA maintains a market dominance of 0.00088% and is ranked #1051 in the overall cryptocurrency market. The token is held by 26,627 addresses and is listed on 28 exchanges. According to the current market sentiment indicator, the market is experiencing extreme fear with a volatility index of 25.
ARPA is deployed on multiple blockchain networks, with contract addresses on Ethereum (0xBA50933C268F567BDC86E1aC131BE072C6B0b71a) and BSC (0x6f769e65c14ebd1f68817f5f1dcdb61cfa2d6f7e). The initial token offering price was $0.02, launched on March 14, 2021.
Click to view the current ARPA market price
ARPA Market Sentiment Indicator
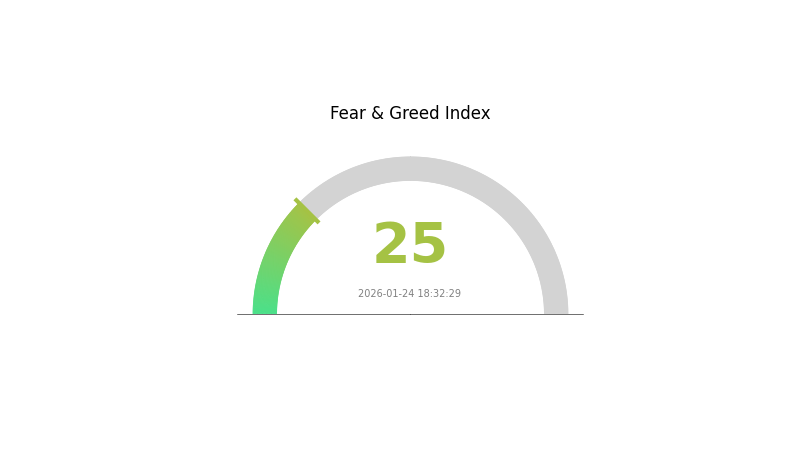
2026-01-24 Fear and Greed Index: 25 (Extreme Fear)
Click to view the current Fear & Greed Index
The cryptocurrency market is currently experiencing extreme fear, with the Fear and Greed Index standing at 25. This indicates heightened market anxiety and pessimistic sentiment among investors. During such periods, risk-averse traders typically reduce exposure, while contrarian investors may identify potential buying opportunities at depressed valuations. Market volatility remains elevated as participants reassess positions and sentiment. It is crucial to monitor macroeconomic factors and on-chain data to gauge whether this fear-driven downturn represents a temporary correction or signals deeper market concerns.
ARPA 持仓分布
The address holding distribution chart provides a comprehensive view of how ARPA tokens are distributed across different wallet addresses on the blockchain, offering crucial insights into the token's ownership concentration and decentralization level. This metric serves as a fundamental indicator for assessing market structure and potential manipulation risks.
According to the current data, ARPA exhibits a moderately concentrated holding pattern. The top five addresses collectively control approximately 50.78% of the total token supply, with the largest single address holding 15.09% (301.85 million tokens). The second and third largest addresses hold 11.16% and 10.28% respectively, while the remaining addresses in the top five each control between 6.40% and 7.85%. The "Others" category, representing all addresses outside the top five, accounts for 49.22% of the total supply.
This distribution structure suggests a relatively balanced ownership profile. While the top holder maintains a significant position at over 15%, no single entity possesses an overwhelming majority that would enable unilateral market manipulation. The presence of multiple large holders with comparable holdings creates a form of checks and balances within the ecosystem. However, the fact that just five addresses control over half of the circulating supply does introduce certain centralization risks, particularly regarding coordinated selling pressure or governance influence. This concentration level is fairly typical for early-stage blockchain projects but may warrant monitoring as the project matures and aims for broader decentralization.
Click to view current ARPA Holding Distribution

| Top |
Address |
Holding Qty |
Holding (%) |
| 1 |
0xf977...41acec |
301846.14K |
15.09% |
| 2 |
0x5ec0...f8d3ab |
223302.29K |
11.16% |
| 3 |
0x76ec...78fbd3 |
205618.82K |
10.28% |
| 4 |
0x1681...5b4f65 |
157111.11K |
7.85% |
| 5 |
0x231a...8ec720 |
128098.38K |
6.40% |
| - |
Others |
984023.25K |
49.22% |
II. Core Factors Influencing ARPA's Future Price
Due to the absence of specific data in the provided materials regarding ARPA's supply mechanisms, institutional holdings, macroeconomic correlations, and technical developments, a comprehensive analysis of the core factors affecting ARPA's future price cannot be conducted at this time.
Investors are advised to monitor official project announcements, on-chain data analytics platforms, and reputable crypto research sources for updated information on supply dynamics, institutional activities, technological upgrades, and ecosystem expansion that may impact ARPA's market performance.
III. 2026-2031 ARPA Price Prediction
2026 Outlook
- Conservative Prediction: $0.00913 - $0.01404
- Neutral Prediction: $0.01404
- Optimistic Prediction: $0.01797 (requires favorable market conditions and increased adoption)
2027-2029 Outlook
- Market Stage Expectation: The token is anticipated to enter a gradual growth phase, with potential increases driven by ecosystem development and broader market recovery trends.
- Price Range Prediction:
- 2027: $0.01489 - $0.02273
- 2028: $0.01569 - $0.0215
- 2029: $0.01778 - $0.02288
- Key Catalysts: Progressive price appreciation may be supported by continued protocol enhancements, strategic partnerships, and growing utility within the privacy computing sector.
2030-2031 Long-term Outlook
- Baseline Scenario: $0.01624 - $0.02166 (assuming steady market conditions and sustained project development)
- Optimistic Scenario: $0.02166 - $0.02469 (driven by significant ecosystem expansion and increased institutional interest)
- Transformative Scenario: $0.01645 - $0.03221 (contingent upon breakthrough technological implementations and widespread adoption across multiple industries)
- 2026-01-25: ARPA shows potential for gradual appreciation over the forecast period, with projected changes ranging from 14% in 2027 to 65% by 2031 compared to 2026 baseline levels.
| Year |
Predicted High Price |
Predicted Average Price |
Predicted Low Price |
Price Change |
| 2026 |
0.01797 |
0.01404 |
0.00913 |
0 |
| 2027 |
0.02273 |
0.01601 |
0.01489 |
14 |
| 2028 |
0.0215 |
0.01937 |
0.01569 |
38 |
| 2029 |
0.02288 |
0.02043 |
0.01778 |
45 |
| 2030 |
0.02469 |
0.02166 |
0.01624 |
54 |
| 2031 |
0.03221 |
0.02317 |
0.01645 |
65 |
IV. ARPA Professional Investment Strategies and Risk Management
ARPA Investment Methodology
(1) Long-term Holding Strategy
- Suitable for: Investors seeking exposure to privacy computing infrastructure with a medium to long-term horizon
- Operational Recommendations:
- Consider accumulating positions during market corrections when the price approaches historical support levels
- Monitor network development milestones and partnership announcements for strategic entry points
- Store assets securely using Gate Web3 Wallet for convenient management and enhanced security features
(2) Active Trading Strategy
- Technical Analysis Tools:
- Moving Averages: Utilize 50-day and 200-day moving averages to identify trend directions and potential reversal points
- Volume Analysis: Monitor trading volume patterns to confirm price movements and identify potential breakout opportunities
- Swing Trading Key Points:
- Pay attention to the current price range between $0.0134 and $0.01445, with potential resistance near recent highs
- Set appropriate stop-loss orders to manage downside risk, particularly given the token's historical volatility
ARPA Risk Management Framework
(1) Asset Allocation Principles
- Conservative Investors: 1-3% of crypto portfolio allocation
- Aggressive Investors: 5-8% of crypto portfolio allocation
- Professional Investors: Up to 10% with active monitoring and hedging strategies
(2) Risk Hedging Solutions
- Portfolio Diversification: Combine ARPA holdings with established blockchain infrastructure projects to reduce concentration risk
- Position Sizing: Implement gradual accumulation strategies rather than single large purchases to average entry costs
(3) Security Storage Solutions
- Hot Wallet Recommendation: Gate Web3 Wallet for active trading and convenient access to liquidity
- Cold Storage Solution: For long-term holdings, consider hardware wallet storage with proper backup procedures
- Security Considerations: Enable two-factor authentication, regularly update security settings, and never share private keys or seed phrases
V. ARPA Potential Risks and Challenges
ARPA Market Risks
- Price Volatility: ARPA has experienced significant price fluctuations, with a 67.56% decline over the past year, indicating high market volatility
- Liquidity Constraints: With a 24-hour trading volume of approximately $210,192, liquidity may be limited during periods of market stress
- Market Cap Position: Ranked at #1051 with a market dominance of 0.00088%, suggesting higher susceptibility to broader market movements
ARPA Regulatory Risks
- Privacy Computing Scrutiny: As privacy-focused technologies face increasing regulatory attention globally, potential restrictions could impact adoption
- Cross-border Data Regulations: Varying international data protection laws may affect ARPA's multi-party computation applications
- Compliance Requirements: Evolving regulatory frameworks for blockchain projects may require significant adaptation and resources
ARPA Technical Risks
- Network Security: Multi-party secure computation systems require robust cryptographic implementations to prevent potential vulnerabilities
- Integration Complexity: Compatibility with multiple mainstream blockchains introduces technical challenges and potential integration risks
- Competition: The privacy computing and secure multi-party computation sector faces competition from both blockchain and traditional technology solutions
VI. Conclusion and Action Recommendations
ARPA Investment Value Assessment
ARPA presents an interesting proposition in the privacy computing infrastructure space, offering multi-party secure computation solutions for data integration and analysis. While the project demonstrates technical innovation with applications across financial services, credit assessment, marketing, and healthcare, investors should note the significant price decline of 67.56% over the past year and modest market capitalization. The recent 30-day uptrend of 12.86% suggests renewed interest, but the token remains far from its all-time high of $0.268622 reached in November 2021. The circulating supply represents approximately 49.11% of maximum supply, indicating potential future dilution considerations.
ARPA Investment Recommendations
✅ Beginners: Start with small position sizes (no more than 1-2% of crypto portfolio) and focus on understanding the project's fundamentals and privacy computing use cases before increasing exposure
✅ Experienced Investors: Consider ARPA as a speculative allocation within a diversified privacy/infrastructure portfolio, with active monitoring of development milestones and market sentiment
✅ Institutional Investors: Evaluate ARPA within the context of broader privacy computing infrastructure investments, with thorough due diligence on technology architecture and competitive positioning
ARPA Trading Participation Methods
- Spot Trading: Direct purchase and holding of ARPA tokens on Gate.com for straightforward exposure to price movements
- Dollar-Cost Averaging: Implement systematic periodic purchases to reduce timing risk and average entry prices over time
- Portfolio Integration: Include ARPA as part of a diversified blockchain infrastructure strategy alongside complementary projects
Cryptocurrency investment carries extremely high risks, and this article does not constitute investment advice. Investors should make cautious decisions based on their own risk tolerance and are advised to consult professional financial advisors. Never invest more than you can afford to lose.
FAQ
What is ARPA? What are its main uses and application scenarios?
ARPA is a decentralized computing protocol enabling secure multi-party computation and privacy-preserving solutions. Its main applications include confidential data analysis, secure machine learning, privacy-protected financial services, and enterprise data collaboration. ARPA facilitates trustless computation while maintaining data privacy across blockchain ecosystems.
How has ARPA token performed historically in price, and what are the main factors affecting its price volatility?
ARPA has shown significant growth since launch, driven by protocol upgrades, partnerships, and market sentiment. Key factors include network adoption rates, competition in the privacy computing space, overall crypto market trends, and community governance developments affecting tokenomics.
What is the ARPA price prediction for 2024-2025? What do experts think?
Experts anticipate ARPA could reach $0.15-$0.25 by end of 2025, driven by ecosystem expansion and increased adoption. Market sentiment remains positive with potential 3-5x growth, contingent on broader crypto market conditions and project developments.
ARPA's advantages include its robust threshold cryptography technology, strong academic partnerships, and proven mainnet performance. Disadvantages are lower market liquidity and smaller ecosystem compared to established competitors. The protocol's focus on secure multi-party computation positions it well for enterprise adoption in privacy solutions.
What are the main risks of investing in ARPA tokens? What should I pay attention to?
ARPA token risks include market volatility, liquidity fluctuations, regulatory changes, and technology development uncertainties. Monitor project updates, diversify your portfolio, and only invest what you can afford to lose. Stay informed about network developments and community sentiment.
What is ARPA's technical development roadmap? What are the important updates in the future?
ARPA is advancing multi-party computation and privacy-preserving technologies. Key updates include enhanced network scalability, improved consensus mechanisms, expanded cross-chain compatibility, and strengthened cryptographic protocols for decentralized computing.
* The information is not intended to be and does not constitute financial advice or any other recommendation of any sort offered or endorsed by Gate.