This comprehensive analysis examines ARTY token's market position and provides expert price forecasts for 2026-2031. Trading at $0.124 as of January 2026, ARTY operates as a GameFi ecosystem token within the Artyfact metaverse platform, offering AAA-quality gaming experiences and NFT marketplace functionality. The article evaluates historical price trends showing an 82% annual decline from prior peaks, analyzes core market drivers including platform adoption and macroeconomic conditions, and presents tiered price predictions ranging from conservative to optimistic scenarios. Detailed investment strategies address portfolio allocation, risk management frameworks, and secure storage solutions via Gate Web3 Wallet. The analysis identifies significant risks including price volatility, limited liquidity, and regulatory uncertainties while offering actionable recommendations for beginners, experienced, and institutional investors navigating this emerging gaming sector asset.
Introduction: ARTY's Market Position and Investment Value
Artyfact (ARTY), positioned as a virtual world platform integrating AAA-quality gaming experiences with innovative GameFi mechanisms, has been actively developing since its launch in 2023. As of 2026, ARTY has achieved a market capitalization of approximately $2.83 million, with a circulating supply of around 22.86 million tokens, and its price is maintained at approximately $0.124. This asset, recognized as a "Play-to-Earn gaming ecosystem token," is playing an increasingly significant role in the blockchain gaming and virtual entertainment sectors.
This article will comprehensively analyze ARTY's price trends from 2026 to 2031, combining historical patterns, market supply and demand dynamics, ecosystem development, and macroeconomic conditions to provide investors with professional price forecasts and practical investment strategies.
I. ARTY Price History Review and Market Status
ARTY Historical Price Evolution Trajectory
- 2023: ARTY launched on Gate.com in December, reaching a peak price of $3.2499 on December 21, 2023, shortly after its debut
- 2024: The token experienced significant volatility throughout the year as the broader crypto market underwent correction phases
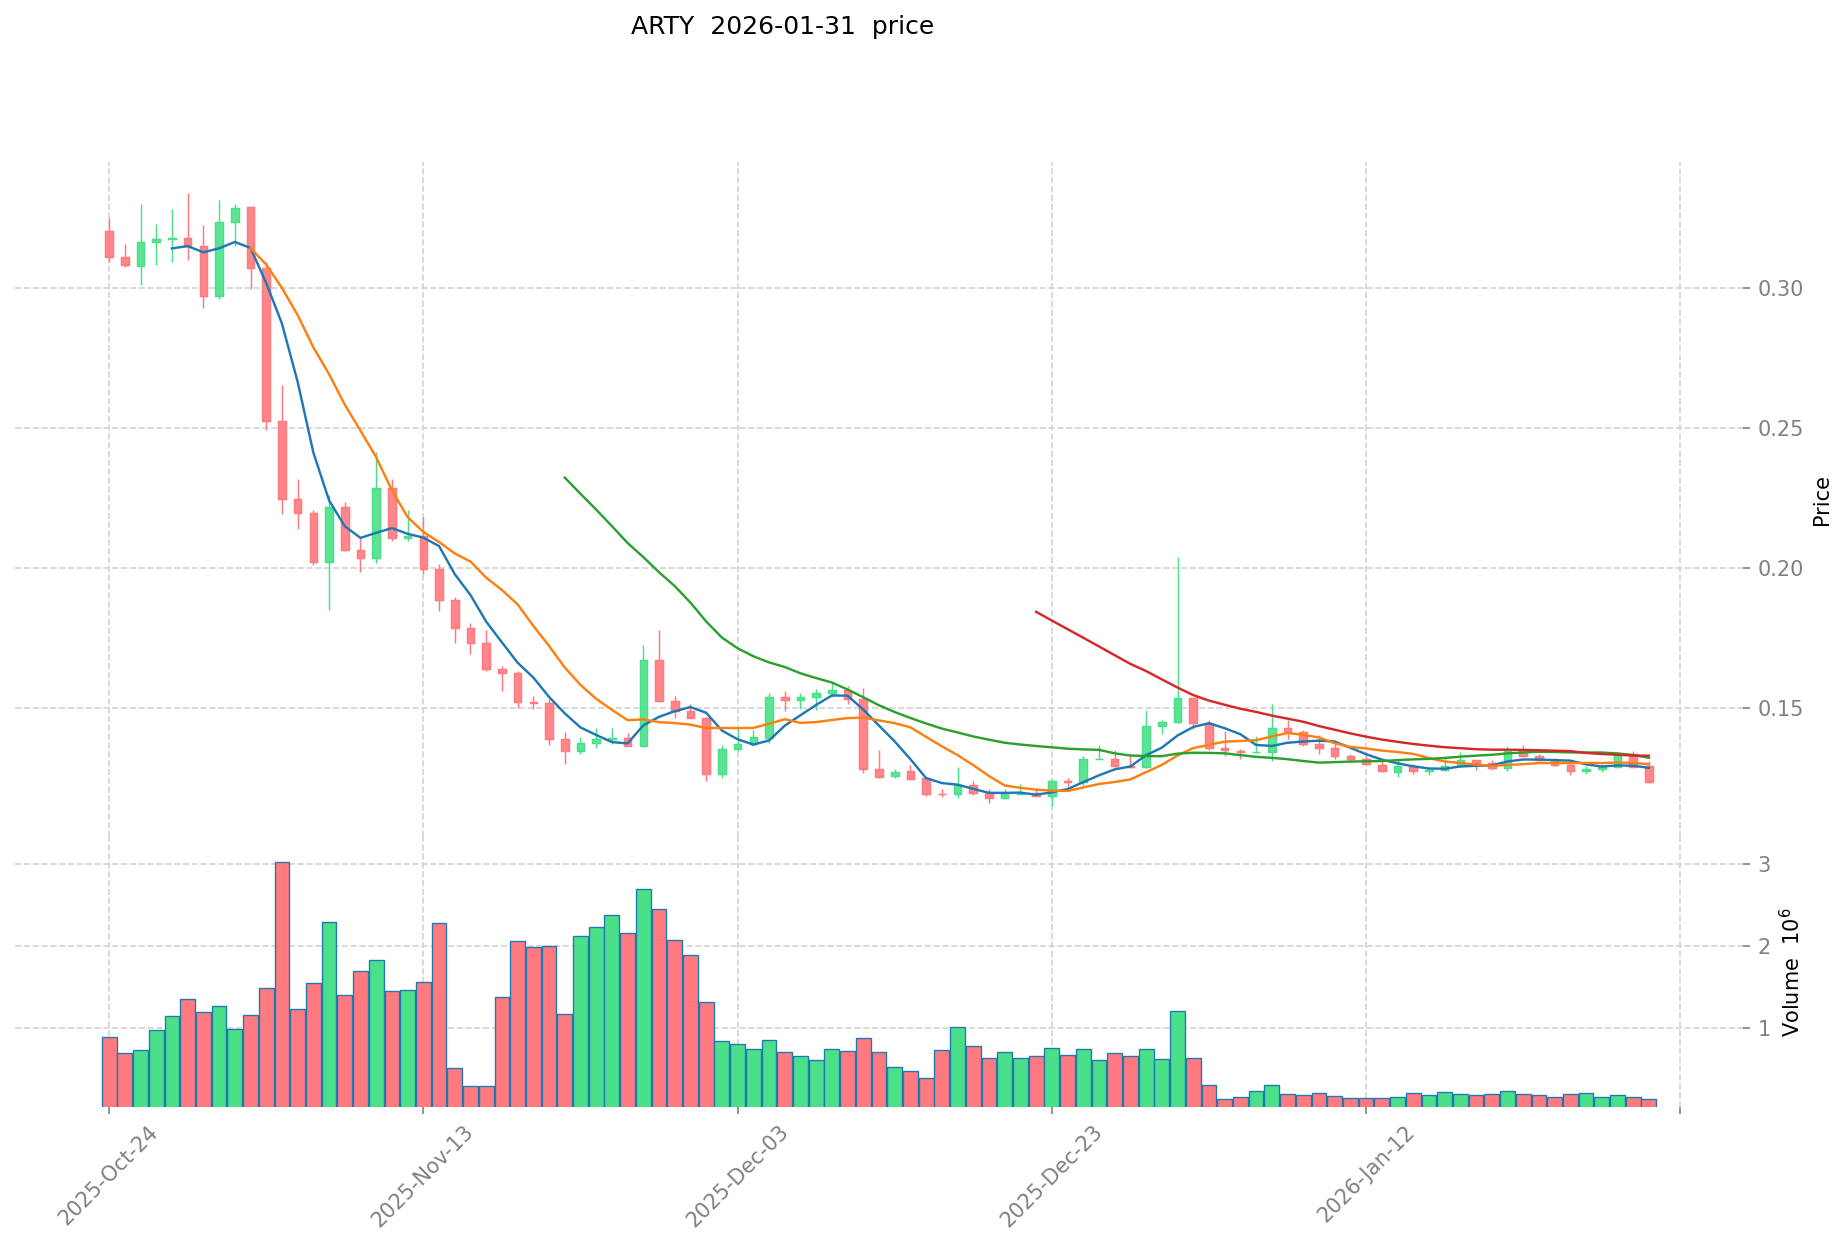
- 2025: ARTY entered a prolonged downtrend, declining to its historical low of $0.115 on December 23, 2025, representing a substantial decrease from its all-time high
ARTY Current Market Status
As of January 31, 2026, ARTY is trading at $0.124, showing a decline of 3.2% over the past 24 hours. The token has experienced downward pressure across multiple timeframes, with a 5.56% decrease over the past week and a 17.33% decline over the past 30 days. On an annual basis, ARTY has decreased by 82.14% from its price one year ago.
The token's 24-hour trading volume stands at $15,657.15, with prices ranging between $0.1234 and $0.1311 during this period. ARTY's current market capitalization is approximately $2.83 million, with a circulating supply of 22.86 million tokens representing 91.42% of the total supply of 24.79 million tokens. The fully diluted market cap is calculated at $3.07 million, with a maximum supply capped at 25 million tokens.
ARTY ranks #1,860 in the cryptocurrency market by market capitalization, accounting for 0.00010% of the total crypto market share. The token is deployed on the Binance Smart Chain (BSC) as a BEP-20 token and is currently listed on 7 exchanges, with Gate.com being one of the primary trading platforms. The project has attracted a holder base of 71,148 addresses.
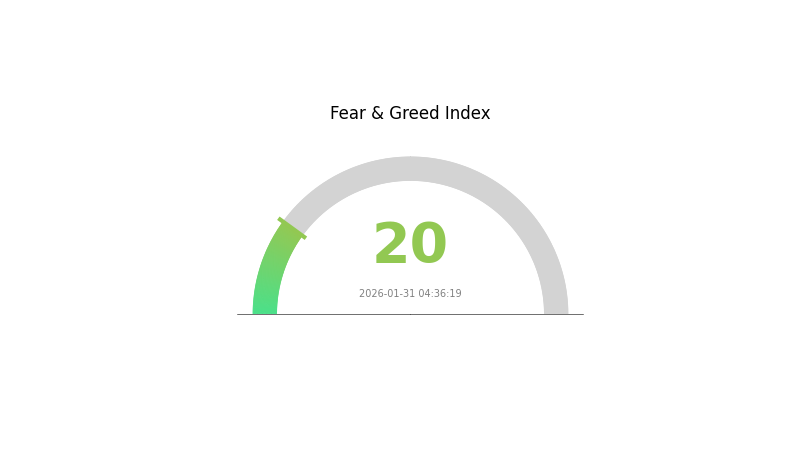
According to market sentiment indicators, the current crypto fear and greed index stands at 20, indicating "Extreme Fear" conditions in the broader market, which may be contributing to ARTY's recent price performance.
Click to view current ARTY market price
ARTY Market Sentiment Indicator
2026-01-31 Fear and Greed Index: 20 (Extreme Fear)
Click to view current Fear & Greed Index
The market is currently experiencing extreme fear, with the index dropping to 20. This sentiment suggests investors are highly pessimistic, with significant selling pressure and risk aversion dominating trading behavior. Such extreme fear conditions often present contrarian opportunities for long-term investors, as markets tend to overreact during panic periods. However, caution remains essential as further downside pressure may still occur. Traders should monitor support levels closely and consider risk management strategies while awaiting signs of stabilization.
ARTY Holding Distribution
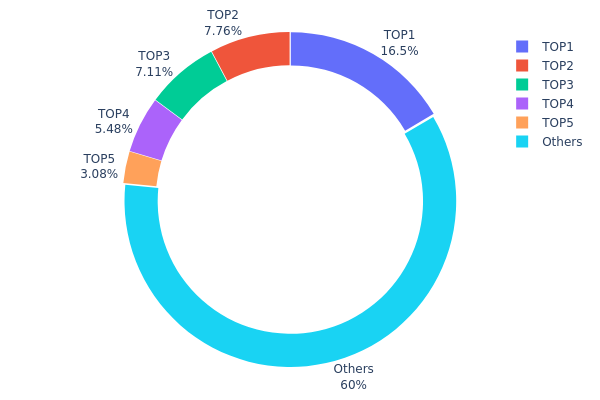
The holding distribution chart reveals the allocation of ARTY tokens across different wallet addresses, serving as a crucial indicator of decentralization and market structure stability. By examining the concentration of tokens among top holders versus the broader community, analysts can assess potential risks related to price manipulation, liquidity constraints, and overall market health. A more balanced distribution typically suggests a healthier, more resilient ecosystem with reduced vulnerability to single-entity actions.
Based on current data, ARTY exhibits moderate concentration characteristics. The top holder controls approximately 16.52% of total supply (4,095.39K tokens), while the top five addresses collectively hold 39.94% of circulating tokens. This concentration level falls within a typical range for emerging crypto assets but warrants careful monitoring. The remaining 60.06% distributed among other addresses indicates reasonable token dispersion, though the gap between the largest holder and subsequent addresses is notable.
From a market structure perspective, this distribution pattern presents both opportunities and concerns. The significant holdings by top addresses could potentially amplify price volatility during large transactions or strategic movements. However, the substantial portion held by the broader community (60.06%) provides a stabilizing counterbalance and suggests genuine adoption beyond whale accumulation. This configuration reflects a developing ecosystem where early participants or strategic investors maintain meaningful positions while community engagement continues to expand. The current structure demonstrates moderate decentralization with room for improvement as the project matures and token circulation broadens further.
Click to view current ARTY Holding Distribution
| Top |
Address |
Holding Qty |
Holding (%) |
| 1 |
0xf89d...5eaa40 |
4095.39K |
16.52% |
| 2 |
0x69be...6ee5e0 |
1924.51K |
7.76% |
| 3 |
0x4982...6e89cb |
1762.47K |
7.11% |
| 4 |
0x2e8f...725e64 |
1357.90K |
5.47% |
| 5 |
0xc882...84f071 |
764.64K |
3.08% |
| - |
Others |
14881.80K |
60.06% |
II. Core Factors Influencing ARTY's Future Price
Supply Mechanism
- Market Accessibility: The platform addresses key challenges in traditional art and collectibles markets, including accessibility issues where high-value assets have historically been difficult for ordinary investors to obtain, and liquidity concerns as these assets typically suffer from poor liquidity and limited trading opportunities.
- Historical Pattern: The evolution of art market accessibility has traditionally created barriers for retail investors, limiting participation to institutional players and high-net-worth individuals.
- Current Impact: Enhanced accessibility through digital platforms may potentially broaden the investor base and improve market liquidity for art-related assets.
Institutional and Major Holder Dynamics
- Institutional Holdings: Information regarding specific institutional positions in ARTY is not available in the provided materials.
- Corporate Adoption: Details about notable enterprises adopting ARTY are not mentioned in the reference materials.
- National Policy: The reference materials do not contain information about country-level policies specifically affecting ARTY.
Macroeconomic Environment
- Monetary Policy Impact: Market expectations regarding Federal Reserve rate decisions continue to influence risk assets. Current market sentiment reflects uncertainty around central bank policy direction, with interest rate expectations affecting capital allocation across asset classes.
- Geopolitical Factors: International developments and trade dynamics have contributed to market volatility, with geopolitical tensions periodically affecting investor risk appetite and capital flows across various asset categories.
Technology Development and Ecosystem Building
- Platform Innovation: The platform development focuses on solving traditional challenges in art and collectibles markets through enhanced accessibility and liquidity mechanisms.
- Ecosystem Applications: Specific details about DApps or major ecosystem projects related to ARTY are not provided in the available materials.
Note: Price predictions are derived from technical analysis, market sentiment, project fundamentals, and industry trends. However, the cryptocurrency market exhibits significant volatility, and all forecasts should not be regarded as investment advice.
III. 2026-2031 ARTY Price Forecast
2026 Outlook
- Conservative Forecast: $0.07074 - $0.1241
- Neutral Forecast: $0.1241
- Optimistic Forecast: $0.15016 (subject to favorable market conditions and increased adoption)
2027-2029 Outlook
- Market Stage Expectation: During this period, ARTY may enter a gradual growth phase, with price volatility expected as the project matures and expands its ecosystem.
- Price Range Forecast:
- 2027: $0.12205 - $0.1961, representing approximately 10% growth
- 2028: $0.10996 - $0.20327, with potential 34% increase
- 2029: $0.09802 - $0.19234, showing possible 49% appreciation
- Key Catalysts: Market adoption rate, technological developments within the ARTY ecosystem, and broader cryptocurrency market sentiment may serve as primary drivers for price movement.
2030-2031 Long-term Outlook
- Baseline Scenario: $0.10564 - $0.27919 in 2030 (assuming steady ecosystem development and maintained market interest)
- Optimistic Scenario: $0.19883 - $0.3228 by 2031 (contingent upon significant platform upgrades and expanded user base)
- Transformational Scenario: Reaching toward $0.3228 (requires breakthrough partnerships, major exchange listings on platforms like Gate.com, and substantial increase in trading volume)
- 2031-12-31: ARTY could potentially achieve approximately 88% cumulative growth from 2026 baseline, positioning at an average of $0.23391 (assuming sustained positive market dynamics)
| Year |
Predicted High Price |
Predicted Average Price |
Predicted Low Price |
Price Change |
| 2026 |
0.15016 |
0.1241 |
0.07074 |
0 |
| 2027 |
0.1961 |
0.13713 |
0.12205 |
10 |
| 2028 |
0.20327 |
0.16661 |
0.10996 |
34 |
| 2029 |
0.19234 |
0.18494 |
0.09802 |
49 |
| 2030 |
0.27919 |
0.18864 |
0.10564 |
52 |
| 2031 |
0.3228 |
0.23391 |
0.19883 |
88 |
IV. ARTY Professional Investment Strategy and Risk Management
ARTY Investment Methodology
(1) Long-term Holding Strategy
- Suitable for: GameFi enthusiasts and believers in the metaverse ecosystem development
- Operational Recommendations:
- Consider accumulating positions during market corrections when ARTY trades near support levels
- Monitor project development milestones including new game releases and NFT marketplace expansions
- Utilize secure storage solutions such as Gate Web3 Wallet for long-term asset custody
(2) Active Trading Strategy
- Technical Analysis Tools:
- Moving Averages: Use 50-day and 200-day moving averages to identify potential trend reversals and momentum shifts
- Volume Analysis: Monitor 24-hour trading volume ($15,657) relative to historical averages to gauge market interest
- Swing Trading Points:
- Set entry points near the 24-hour low ($0.1234) and exit targets near resistance levels
- Implement stop-loss orders to limit downside exposure given recent price volatility
ARTY Risk Management Framework
(1) Asset Allocation Principles
- Conservative Investors: 1-3% of crypto portfolio allocation
- Active Investors: 3-7% of crypto portfolio allocation
- Professional Investors: May allocate up to 10% with appropriate hedging strategies
(2) Risk Hedging Solutions
- Diversification: Balance ARTY holdings with other gaming and metaverse tokens to reduce sector-specific risk
- Position Sizing: Implement dollar-cost averaging to mitigate timing risk given recent downward trends
(3) Secure Storage Solutions
- Hot Wallet Recommendation: Gate Web3 Wallet for active trading and staking participation
- Cold Storage Option: Hardware wallet solutions for long-term holdings exceeding immediate trading needs
- Security Precautions: Enable two-factor authentication, verify contract addresses (0x617Cab4aAae1f8dfb3eE138698330776a1e1b324 on BSC), and be cautious of phishing attempts
V. ARTY Potential Risks and Challenges
ARTY Market Risks
- Price Volatility: ARTY has experienced significant price fluctuations, with a 1-year decline of approximately 82% from previous levels
- Liquidity Concerns: With a 24-hour trading volume of $15,657 and market capitalization of approximately $2.83 million, liquidity may be limited during periods of high volatility
- Market Sentiment: Ranking at #1860 suggests relatively lower market attention compared to major cryptocurrencies
ARTY Regulatory Risks
- Gaming Token Classification: Evolving regulations regarding utility tokens in gaming platforms may impact ARTY's operational framework
- NFT Regulation: Increasing regulatory scrutiny on NFT marketplaces could affect Artyfact's trading ecosystem
- Jurisdictional Variations: Different regulatory approaches across regions may limit platform accessibility and token utility
ARTY Technical Risks
- Smart Contract Vulnerabilities: As a BEP-20 token on BSC, ARTY faces potential smart contract risks inherent to blockchain platforms
- Platform Dependency: Token utility is closely tied to Artyfact platform adoption and user engagement
- Competition: The GameFi and metaverse sectors face intense competition, which may impact user retention and token demand
VI. Conclusion and Action Recommendations
ARTY Investment Value Assessment
ARTY presents opportunities within the GameFi and metaverse sectors through its platform offering AAA-quality games, NFT marketplace, and virtual entertainment ecosystem. However, investors should carefully consider the token's recent price performance, limited market capitalization, and inherent risks associated with early-stage gaming platforms. The project's success depends on sustained user adoption, continued platform development, and favorable market conditions for GameFi tokens.
ARTY Investment Recommendations
✅ Beginners: Start with minimal position sizes (under 2% of crypto portfolio) and focus on understanding the Artyfact ecosystem before increasing exposure
✅ Experienced Investors: Consider strategic accumulation during market dips while maintaining strict risk management protocols and diversification across multiple gaming tokens
✅ Institutional Investors: Conduct thorough due diligence on platform metrics, user retention data, and competitive positioning before considering allocation
ARTY Trading Participation Methods
- Spot Trading: Purchase ARTY through Gate.com and other supported exchanges with current listing on 7 platforms
- Portfolio Integration: Incorporate ARTY as part of a diversified GameFi and metaverse token portfolio strategy
- Community Engagement: Participate in the Artyfact ecosystem to understand platform developments and token utility firsthand
Cryptocurrency investments carry extremely high risks, and this article does not constitute investment advice. Investors should make prudent decisions based on their own risk tolerance and are advised to consult professional financial advisors. Never invest more than you can afford to lose.
FAQ
What is ARTY token and what is its purpose?
ARTY is the native token of Artyfact metaverse and governance token of Artyfact DAO. It powers ecosystem activities and enables users to pay for items and services within the platform.
What factors influence ARTY price?
ARTY price is influenced by platform adoption rate, user growth, and gaming industry trends. Increased users creating or trading NFTs drive demand higher. Market sentiment and GameFi sector performance also significantly impact price movements.
How to analyze ARTY price trends?
Analyze ARTY price trends by examining historical price data, market dynamics, and trading volume patterns. Monitor real-time data to identify short-term and long-term price movements, helping you make informed decisions on ARTY's potential future price direction.
ARTY reached an all-time high of $3.20 in December 2023, with a low of $0.115649 in December 2025. As of January 2026, it trades between $0.132181 and $0.135499, showing significant volatility since its peak.
What are expert predictions for ARTY's future price?
Experts predict ARTY will fluctuate between $1.50 to $2 in the near term. Long-term price forecasts remain uncertain among analysts, with varied perspectives on future years' performance and market conditions.
ARTY stands out with superior artistic authenticity and emphasis on original creator expression rather than standardized production. It prioritizes genuine artistic innovation and cultural value, delivering stronger long-term appreciation potential than typical art tokens.
What risks should I pay attention to when purchasing ARTY?
ARTY price volatility can be significant due to market conditions and investor sentiment. Ensure you understand the project fundamentals, verify token authenticity, and only invest capital you can afford to lose. Monitor liquidity and trading volume to avoid slippage.
* The information is not intended to be and does not constitute financial advice or any other recommendation of any sort offered or endorsed by Gate.