This comprehensive analysis examines ARTY's price trajectory from 2026 to 2031, providing investors with data-driven forecasts for the digital art token. As of January 2026, ARTY trades at $0.1234 with a $2.82 million market cap, despite an 82% one-year decline. The article evaluates key factors including supply mechanisms, institutional dynamics, and macroeconomic conditions influencing price movements. Detailed forecasts project ARTY ranging from $0.1074-$0.1370 in 2026, with potential growth to $0.2416 by 2031. Professional investment strategies, risk management frameworks, and secure storage solutions on Gate are outlined for various investor profiles. Essential insights on regulatory risks, technical vulnerabilities, and market liquidity considerations help readers make informed decisions in the volatile GameFi sector.
Introduction: ARTY's Market Position and Investment Value
Artyfact (ARTY), positioned as a virtual world platform integrating AAA-quality gaming experiences with innovative GameFi mechanisms, has been developing its ecosystem since its launch in December 2023. As of January 2026, ARTY maintains a market capitalization of approximately $2.82 million, with a circulating supply of around 22.86 million tokens, and its price hovering near $0.1234. This asset, recognized for its integration of gaming, NFT trading, and virtual entertainment, is playing an increasingly notable role in the GameFi and metaverse sectors.
This article will comprehensively analyze ARTY's price trajectory from 2026 to 2031, examining historical patterns, market supply-demand dynamics, ecosystem development, and macroeconomic conditions to provide investors with professional price forecasts and practical investment strategies.
I. ARTY Price History Review and Current Market Status
ARTY Historical Price Evolution Trajectory
- 2023: Token launched on December 21, price reached $3.2499
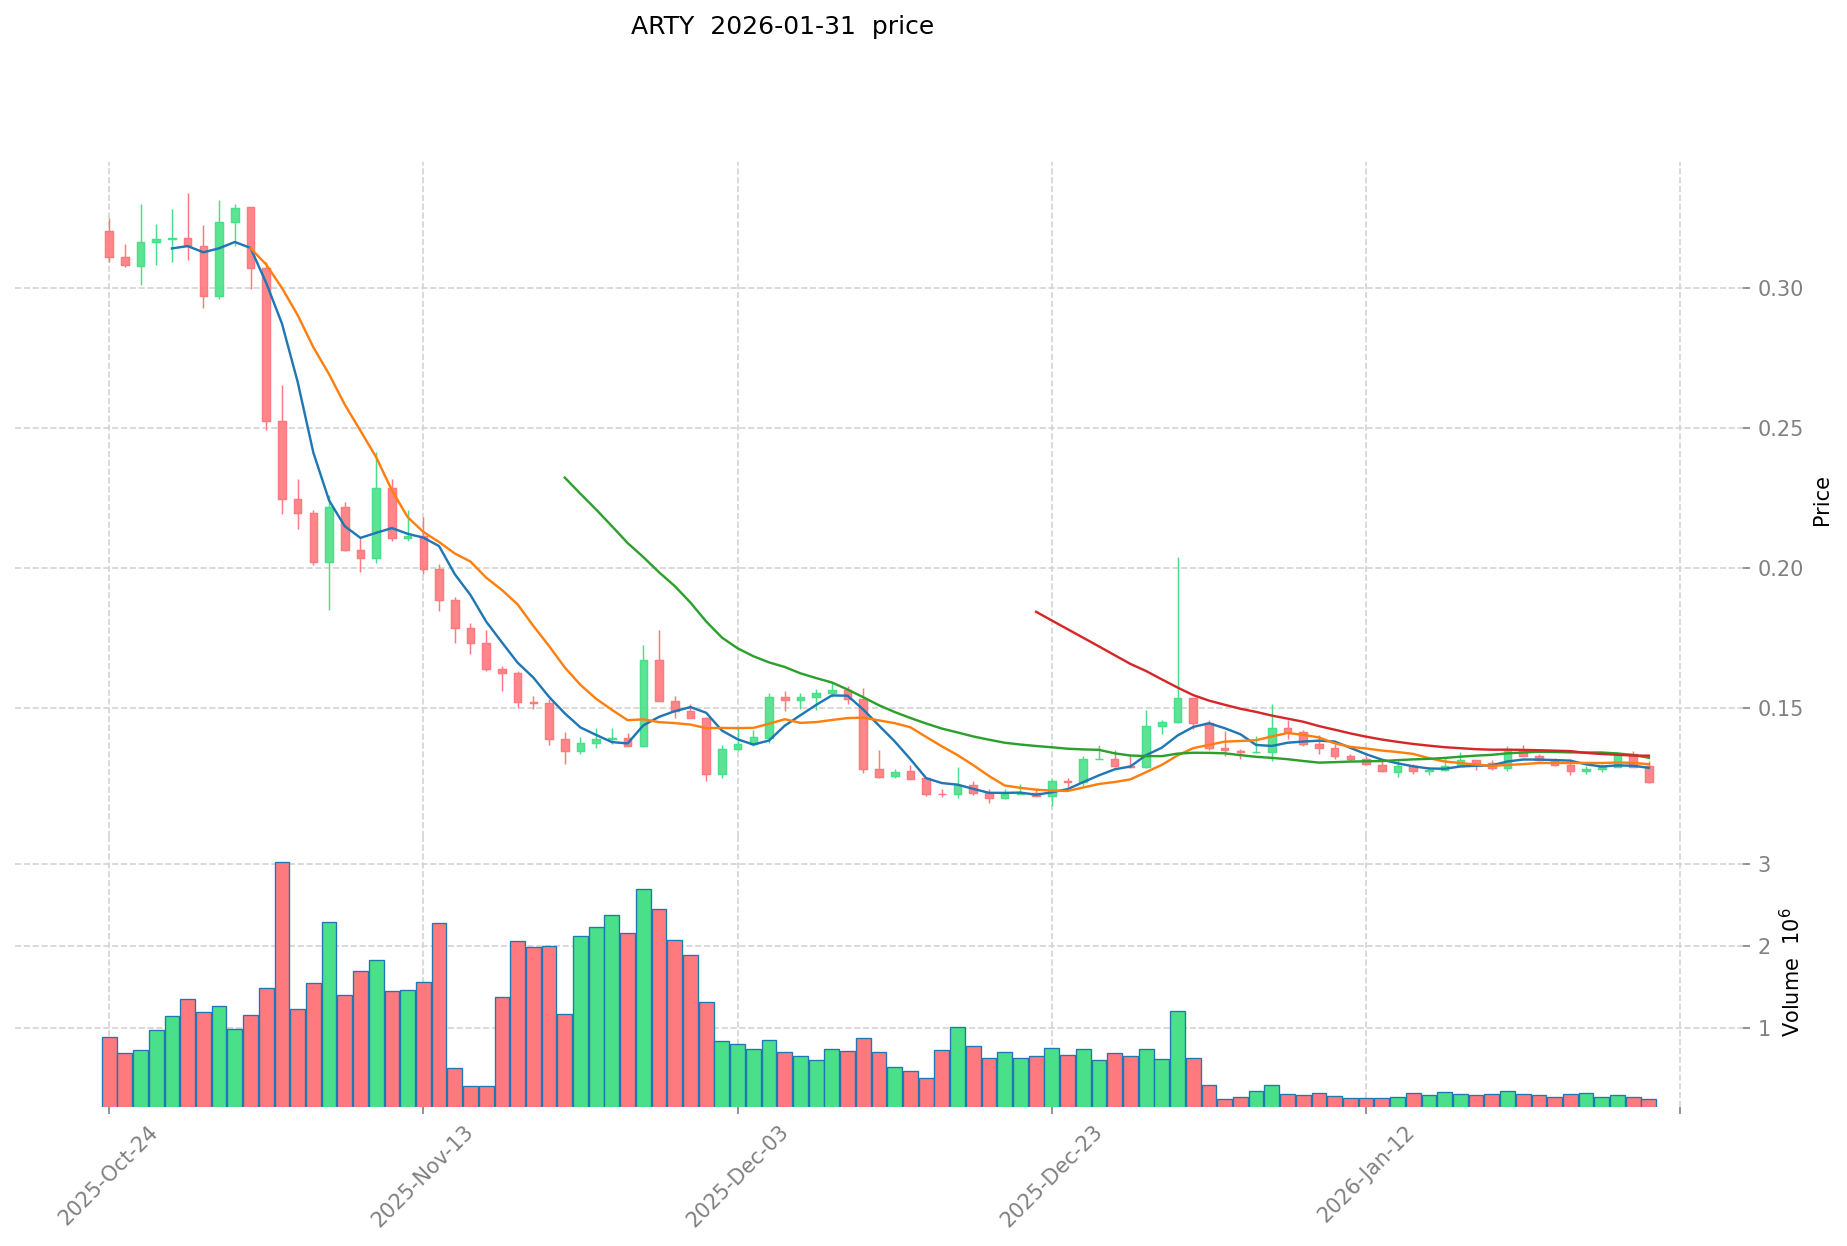
- 2025: Market downturn led to price decline, reaching $0.115 on December 23
- 2026: Price stabilized around $0.1234 in late January
ARTY Current Market Situation
As of January 31, 2026, ARTY is trading at $0.1234, with a 24-hour trading volume of $14,549.16. The token has experienced a 5.36% decrease over the past 24 hours, with an hourly decline of 0.55%. Over the past week, ARTY has dropped 5.87%, while the 30-day performance shows a 17.46% decline. The one-year performance indicates an 82.23% decrease.
The current market capitalization stands at $2,820,393.95, with a circulating supply of 22,855,704.63 ARTY tokens, representing 91.42% of the maximum supply of 25,000,000 tokens. The fully diluted market cap is $3,058,678.29. ARTY's market dominance is 0.00010%, with 71,148 holders and listings on 7 exchanges.
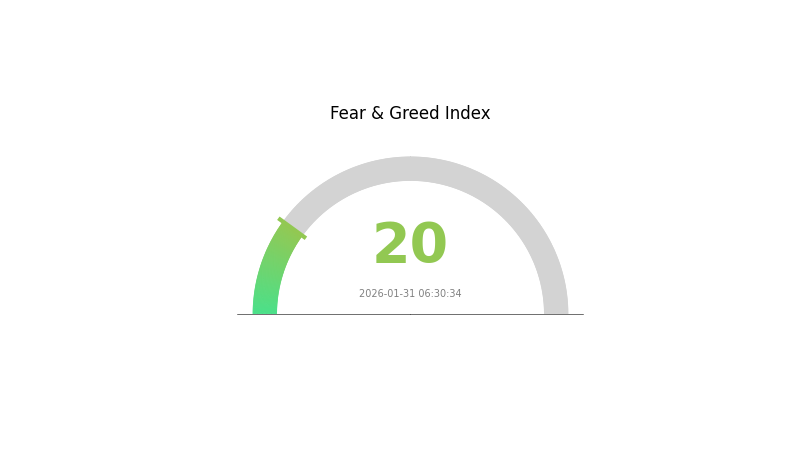
The 24-hour price range has fluctuated between $0.1234 and $0.1307. The current cryptocurrency market sentiment index shows a value of 20, indicating extreme fear conditions.
Click to view current ARTY market price
ARTY Market Sentiment Indicator
2026-01-31 Fear and Greed Index: 20 (Extreme Fear)
Click to view the current Fear & Greed Index
The cryptocurrency market is currently experiencing extreme fear, with the Fear and Greed Index standing at 20. This reading indicates significant market anxiety and pessimistic sentiment among investors. During periods of extreme fear, risk aversion tends to peak, often creating potential buying opportunities for contrarian investors. However, traders should exercise caution and conduct thorough analysis before making investment decisions. Market conditions remain volatile, and careful risk management is essential in such uncertain environments.
ARTY Holding Distribution
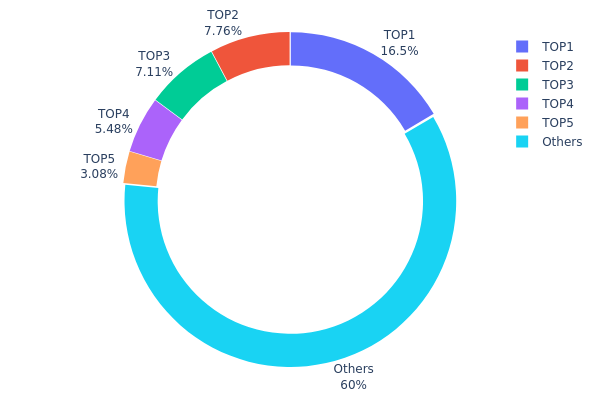
The holding distribution chart reflects the concentration level of token holdings across different addresses on the blockchain. By analyzing the proportion of tokens held by top addresses versus the broader holder base, this metric reveals the degree of centralization or decentralization within a token's ecosystem, providing crucial insights into potential market manipulation risks and structural stability.
According to current data, ARTY exhibits a moderate level of concentration in its holding distribution. The top address controls 4,095.39K tokens, representing 16.52% of the total supply, while the top five addresses collectively hold approximately 40% of the circulating supply. The remaining 60.06% is distributed among other holders, indicating that despite notable whale presence, more than half of the tokens are held by a broader participant base.
This distribution pattern suggests a balanced market structure with manageable concentration risk. While the top holders possess significant influence, the substantial portion held by others (60.06%) provides a degree of market stability and reduces the likelihood of extreme price manipulation by any single entity. The current distribution reflects a relatively healthy on-chain structure, though investors should remain aware that coordinated action by top holders could still impact short-term price movements. The moderate decentralization level indicates reasonable community participation while maintaining the interest of major stakeholders in the project's long-term development.
Click to view current ARTY Holding Distribution
| Top |
Address |
Holding Qty |
Holding (%) |
| 1 |
0xf89d...5eaa40 |
4095.39K |
16.52% |
| 2 |
0x69be...6ee5e0 |
1924.51K |
7.76% |
| 3 |
0x4982...6e89cb |
1762.47K |
7.11% |
| 4 |
0x2e8f...725e64 |
1357.90K |
5.47% |
| 5 |
0xc882...84f071 |
764.64K |
3.08% |
| - |
Others |
14881.80K |
60.06% |
II. Core Factors Influencing ARTY's Future Price
Supply Mechanism
- Expense Ratio Structure: ARTY maintains a 0.47% expense ratio, which means investors pay this cost regardless of the ETF's performance. This fee structure represents a continuous operational cost that may impact net returns over extended holding periods.
- Historical Patterns: ETF expense ratios create a steady drag on returns, particularly notable during periods of market volatility or underperformance. Lower-cost alternatives in the market may attract cost-conscious investors seeking similar exposure.
- Current Impact: The ongoing fee obligation remains a consideration for investors evaluating ARTY against competing investment vehicles, particularly as the broader technology and artificial intelligence sectors experience fluctuating performance.
Institutional and Major Holder Dynamics
- Institutional Positioning: As a thematic ETF focused on future artificial intelligence and technology sectors, ARTY's performance correlates closely with institutional sentiment toward technology equities. Market participants monitor allocation trends within technology-focused portfolios.
- Sector Exposure: The ETF's concentration in technology and AI-related holdings means performance may be disproportionately affected when these sectors face headwinds or experience sector rotation pressures.
- Market Structure: Investment flows into thematic ETFs like ARTY tend to reflect broader risk appetite for growth-oriented technology investments, making positioning sensitive to shifts in investor sentiment toward innovation sectors.
Macroeconomic Environment
- Monetary Policy Influence: Federal Reserve policy expectations significantly impact technology sector valuations. Market participants have adjusted rate cut probabilities substantially in recent periods, with expectations for December monetary easing rising notably. These policy shifts directly influence technology stock valuations and, consequently, ARTY's underlying holdings.
- Geopolitical Considerations: International developments, including trade relationships and policy changes, create uncertainty that affects market sentiment. Technology sectors often experience heightened sensitivity to geopolitical shifts, particularly regarding international supply chains and market access.
- Economic Growth Dynamics: Macroeconomic drivers including capital cost fluctuations, demographic shifts, and policy transformations continue reshaping investment landscapes. Technology and AI sectors remain particularly sensitive to economic growth expectations and capital availability conditions.
Technology Development and Ecosystem Building
- Sector Performance Dependency: ARTY's future trajectory depends substantially on the broader technology sector's performance and artificial intelligence industry developments. When these sectors encounter resistance or experience rapid innovation cycles, the ETF may experience corresponding volatility.
- Market Sentiment Factors: Price movements reflect not only fundamental developments within technology companies but also evolving market sentiment toward innovation sectors. Investor confidence in AI technology adoption rates and commercialization timelines influences positioning.
- Risk Considerations: The thematic nature of ARTY's holdings means concentration risk remains present. Market participants should monitor technological advancement rates, competitive dynamics within AI sectors, and regulatory developments affecting technology companies when evaluating potential price movements.
III. 2026-2031 ARTY Price Forecast
2026 Outlook
- Conservative forecast: $0.1074 - $0.1234
- Neutral forecast: $0.1234
- Optimistic forecast: $0.1370 (subject to favorable market conditions)
2027-2029 Mid-term Outlook
- Market stage expectation: The token may experience gradual growth as the project matures and establishes stronger market presence
- Price range forecast:
- 2027: $0.0859 - $0.1810
- 2028: $0.1198 - $0.2085
- 2029: $0.1474 - $0.1984
- Key catalysts: Progressive price appreciation driven by potential ecosystem development and broader market adoption
2030-2031 Long-term Outlook
- Baseline scenario: $0.1236 - $0.2416 (assuming steady market development)
- Optimistic scenario: $0.2159 - $0.2416 (contingent on strong ecosystem growth)
- Transformative scenario: Potential price levels above $0.2416 (under exceptionally favorable conditions including widespread adoption)
- 2026-01-31: ARTY maintains baseline positioning in early forecast period
| Year |
Predicted High Price |
Predicted Average Price |
Predicted Low Price |
Price Change |
| 2026 |
0.13697 |
0.1234 |
0.10736 |
0 |
| 2027 |
0.18096 |
0.13019 |
0.08592 |
5 |
| 2028 |
0.20847 |
0.15557 |
0.11979 |
26 |
| 2029 |
0.1984 |
0.18202 |
0.14744 |
47 |
| 2030 |
0.24157 |
0.19021 |
0.12364 |
54 |
| 2031 |
0.22237 |
0.21589 |
0.12522 |
74 |
IV. ARTY Professional Investment Strategies and Risk Management
ARTY Investment Methodology
(I) Long-term Holding Strategy
- Suitable for: Investors who believe in the long-term potential of GameFi and metaverse ecosystems
- Operational Recommendations:
- Consider accumulating ARTY during market downturns, as the token has experienced significant volatility with a 1-year decline of approximately 82%
- Monitor the project's development milestones, including new game releases, NFT marketplace expansions, and partnership announcements
- Storage Solution: Utilize Gate Web3 Wallet for secure storage with convenient access to the BSC ecosystem
(II) Active Trading Strategy
- Technical Analysis Tools:
- Support and Resistance Levels: Track the 24-hour low of $0.1234 and high of $0.1307 as key short-term levels
- Volume Analysis: Monitor the 24-hour trading volume of approximately $14,549 to gauge market interest and liquidity
- Swing Trading Key Points:
- Be aware of short-term volatility, with recent 1-hour and 24-hour price movements showing declines of 0.55% and 5.36% respectively
- Consider the 7-day and 30-day trends (down 5.87% and 17.46%) when planning medium-term positions
ARTY Risk Management Framework
(I) Asset Allocation Principles
- Conservative Investors: 1-3% of crypto portfolio
- Aggressive Investors: 5-10% of crypto portfolio
- Professional Investors: Up to 15% with active hedging strategies
(II) Risk Hedging Solutions
- Diversification Strategy: Balance ARTY holdings with established cryptocurrencies and other gaming tokens to reduce sector-specific risk
- Position Sizing: Given the token's high volatility and decline from its historical high of $3.2499, consider dollar-cost averaging to mitigate timing risk
(III) Secure Storage Solutions
- Hot Wallet Recommendation: Gate Web3 Wallet for active trading and easy access to BSC-based dApps
- Cold Storage Option: For long-term holdings, consider hardware wallet solutions that support BEP-20 tokens
- Security Considerations: Always verify the contract address (0x617Cab4aAae1f8dfb3eE138698330776a1e1b324) before transactions, enable two-factor authentication, and never share private keys
V. ARTY Potential Risks and Challenges
ARTY Market Risks
- High Volatility: ARTY has experienced a substantial decline of approximately 82% over the past year, indicating significant price volatility
- Limited Liquidity: With a 24-hour trading volume of approximately $14,549 and listing on 7 exchanges, liquidity may be constrained during high volatility periods
- Market Cap Sensitivity: With a circulating market cap of approximately $2.82 million, the token is susceptible to price manipulation and large holder movements
ARTY Regulatory Risks
- Gaming Token Classification: Evolving regulations around GameFi and play-to-earn models may impact the project's operational model
- NFT Regulatory Uncertainty: As the platform involves NFT trading of in-game assets, changes in digital asset regulations could affect functionality
- Cross-border Compliance: The global nature of the metaverse platform may face varying regulatory requirements across different jurisdictions
ARTY Technical Risks
- Smart Contract Dependency: As a BEP-20 token on BSC, ARTY is subject to potential vulnerabilities in smart contract code
- Platform Development Risk: The success of ARTY is closely tied to the continued development and user adoption of Artyfact's gaming ecosystem
- Competition Risk: The GameFi and metaverse sectors are highly competitive, with numerous projects vying for user attention and market share
VI. Conclusion and Action Recommendations
ARTY Investment Value Assessment
ARTY represents an investment in the convergence of gaming, NFTs, and the metaverse through the Artyfact platform. While the project offers exposure to innovative GameFi modes and a comprehensive virtual entertainment ecosystem, investors should carefully consider the token's recent performance trajectory. The approximately 82% decline over the past year and relatively low market capitalization suggest both elevated risk and potential recovery opportunities for risk-tolerant investors. The project's long-term value proposition depends on successful execution of its gaming platform, user adoption, and ability to differentiate in a crowded market. Short-term risks include continued price volatility, limited liquidity, and broader market sentiment toward gaming tokens.
ARTY Investment Recommendations
✅ Beginners: Start with minimal exposure (0.5-1% of portfolio) and focus on understanding the GameFi ecosystem before increasing position size. Use Gate.com for straightforward purchasing and Gate Web3 Wallet for secure storage.
✅ Experienced Investors: Consider tactical positions during market weakness, but maintain strict risk management given the token's volatility. Monitor development updates and user growth metrics closely.
✅ Institutional Investors: Conduct thorough due diligence on the project's roadmap, team credentials, and competitive positioning. Consider ARTY as part of a diversified gaming token basket rather than a concentrated position.
ARTY Trading Participation Methods
- Spot Trading: Purchase ARTY on Gate.com and other supporting exchanges with transparent pricing and adequate liquidity
- DeFi Integration: Interact with BSC-based DeFi protocols using ARTY for yield opportunities, while being mindful of smart contract risks
- NFT Ecosystem Participation: Acquire ARTY to participate in the Artyfact marketplace for trading in-game assets, attending virtual events, and accessing platform features
Cryptocurrency investment carries extremely high risks, and this article does not constitute investment advice. Investors should make prudent decisions based on their own risk tolerance and are advised to consult professional financial advisors. Never invest more than you can afford to lose.
FAQ
What is ARTY token and what is its current market price?
ARTY token is a cryptocurrency asset with a current market price of $0.00000000000001. As of 2026-01-31, it maintains a market cap of approximately $2.52 million, reflecting its position in the digital asset market.
What factors influence ARTY price movements and market trends?
ARTY price is influenced by market demand, trading volume, investor sentiment, broader crypto market trends, project developments, and macroeconomic conditions. Supply dynamics and exchange liquidity also play key roles in price fluctuations.
What are expert price predictions for ARTY in the short and long term?
Experts predict ARTY will maintain support above $1.89 in the near term, with potential peaks reaching $2.14. Long-term projections suggest continued upward momentum driven by market trends and adoption growth.
Use technical analysis tools to track price trends, trading volume, and moving averages. Apply statistical models to identify patterns and support levels. Analyze market sentiment and volatility indicators to forecast future price movements accurately.
What are the risks and volatility factors associated with ARTY price prediction?
ARTY price prediction involves high volatility due to AI and tech sector exposure. Key risk factors include market sentiment shifts, regulatory changes, trading volume fluctuations, and sector-specific technology developments. Higher standard deviation indicates greater price volatility and investment risk potential.
ARTY is projected to reach $0.604 - $1.079 by 2030, demonstrating strong price growth potential compared to similar tokens. Its performance trajectory suggests competitive advantages in the market.
* The information is not intended to be and does not constitute financial advice or any other recommendation of any sort offered or endorsed by Gate.