This article provides a comprehensive analysis of APRO Token (AT), an AI-enhanced oracle infrastructure operating across 40+ blockchains with a current market cap of $37.07 million. It examines AT's historical price trajectory since its February 2025 launch, analyzing current market status, holding distribution, and key performance metrics. The piece projects AT price movements from 2026-2031 with conservative, neutral, and optimistic scenarios, supported by detailed price prediction tables. It outlines professional investment strategies for different investor types, including long-term holding and active trading approaches via Gate.com, while addressing risk management frameworks and hedging solutions. The article evaluates potential challenges including market volatility, limited liquidity, regulatory risks, and technical vulnerabilities. Designed for beginners to institutional investors, it concludes with actionable trading recommendations and comprehensive FAQ addressing AT's investment fundamentals and m
Introduction: AT's Market Position and Investment Value
APRO Token (AT), as an AI-enhanced oracle infrastructure powering next-generation ecosystems across RWA, AI, Prediction Markets, and DeFi, has established a significant presence in the decentralized data infrastructure space. As of 2026, AT has achieved a market capitalization of approximately $37.07 million, with a circulating supply of around 230 million tokens, and the price maintains at approximately $0.1612. This asset, recognized as a "next-generation oracle solution", is playing an increasingly critical role in delivering verified, real-time data for both standard and non-standard assets across multiple blockchain networks.
Supported by prominent institutions including Polychain Capital, Franklin Templeton, and YZi Labs, AT operates with over 1,400 data feeds across more than 40 blockchains, demonstrating notable growth with a 30-day price increase of approximately 70.59%. The token has shown resilience in the market with substantial holder growth, reaching 44,968 holders and maintaining trading activity across 24 exchanges.
This article will comprehensively analyze AT's price trends from 2026 to 2031, combining historical patterns, market supply and demand dynamics, ecosystem development, and macroeconomic conditions to provide investors with professional price forecasts and practical investment strategies.
I. AT Price History Review and Current Market Status
AT Historical Price Evolution Trajectory
- 2025: APRO Token launched in February with initial trading activity. Price experienced significant volatility throughout the year, reaching a notable high of $0.5196 in November, followed by a substantial correction to a low of $0.07888 in December, representing considerable price fluctuation during its first year of trading.
AT Current Market Status
As of January 20, 2026, APRO Token (AT) is trading at $0.16117, showing a 24-hour decline of 4.7%. The token has demonstrated a 24-hour trading range between $0.16015 and $0.18005, with total trading volume reaching $364,289.93.
Over different time horizons, AT has exhibited mixed performance: a 1-hour decline of 1.43%, a 7-day increase of 0.27%, and a 30-day surge of 70.59%. The token currently maintains a market capitalization of approximately $37.07 million, with 230 million tokens in circulation out of a maximum supply of 1 billion tokens, representing 23% of total supply.
The current price of $0.16117 reflects a recovery from the December 2025 low, though it remains below the historical high achieved in November. AT ranks 629th in the cryptocurrency market with a dominance of 0.0050%. The fully diluted market capitalization stands at approximately $161.17 million, with the market cap to FDV ratio at 23%. The token has been listed on 24 exchanges and has attracted 44,968 holders since its launch.
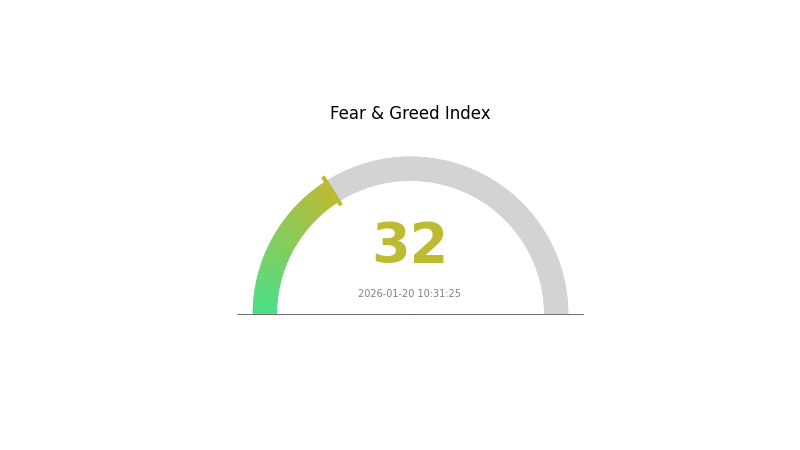
The broader market sentiment index currently indicates 32, corresponding to a "Fear" level, which may be influencing AT's recent price movements alongside general market conditions.
Click to view current AT market price

AT Market Sentiment Indicator
2026-01-20 Fear and Greed Index: 32 (Fear)
Click to view current Fear & Greed Index
The cryptocurrency market is currently experiencing a fear sentiment phase with an index reading of 32. This indicates heightened market anxiety and cautious investor behavior. During fear-dominant periods, volatility tends to increase as market participants reassess risk exposure. Traders should exercise prudent risk management and avoid panic-driven decisions. Such market conditions often present opportunities for strategic investors with a long-term perspective. Monitoring the Fear and Greed Index on Gate.com can help you better understand market psychology and make more informed trading decisions.
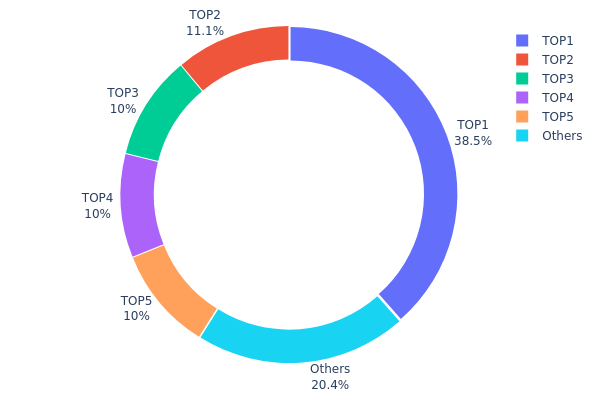
AT Holding Distribution
The holding distribution chart represents the percentage allocation of AT tokens across different wallet addresses, providing crucial insights into the token's ownership concentration. According to the latest on-chain data, AT exhibits a highly concentrated holding pattern, with the top 5 addresses collectively controlling approximately 79.57% of the total token supply.
The distribution reveals significant concentration risks, particularly with the largest address holding 385,000.12K tokens (38.50% of total supply), followed by four addresses each holding approximately 10-11% of the supply. This level of concentration substantially deviates from the decentralization principle typically advocated in cryptocurrency markets. Such an asymmetric distribution structure creates potential vulnerabilities, as the top holder's trading decisions could trigger significant price volatility. The remaining 204,217.25K tokens (20.43%) are distributed among other addresses, indicating limited circulation among retail investors.
From a market structure perspective, this concentrated holding pattern presents both opportunities and risks. While large holders may provide price stability during normal market conditions, their selling pressure could create severe liquidity challenges and dramatic price corrections. The limited dispersion among smaller holders suggests insufficient market depth, potentially amplifying price fluctuations during periods of high volatility. This concentration level also raises concerns about potential market manipulation risks, as coordinated actions by major holders could significantly influence price discovery mechanisms and trading dynamics.
Click to view current AT Holding Distribution
| Top |
Address |
Holding Qty |
Holding (%) |
| 1 |
0xb6f6...1da6e7 |
385000.12K |
38.50% |
| 2 |
0xf977...41acec |
110782.63K |
11.07% |
| 3 |
0x3763...ef9bae |
100000.00K |
10.00% |
| 4 |
0x4bf1...ae8669 |
100000.00K |
10.00% |
| 5 |
0x2ea8...cfc3cb |
100000.00K |
10.00% |
| - |
Others |
204217.25K |
20.43% |
II. Core Factors Affecting AT's Future Price
Based on the available information, there is insufficient data to comprehensively analyze the core factors that may influence AT's future price movements. The provided materials do not contain specific details regarding supply mechanisms, institutional holdings, macroeconomic correlations, or technical developments related to AT.
To conduct a meaningful analysis of AT's price drivers, information about the following aspects would be necessary:
- Token supply dynamics and emission schedules
- Institutional adoption patterns and major holder activities
- Macroeconomic sensitivities and correlation patterns
- Technical upgrades and ecosystem developments
Without concrete data on these fundamental factors, any price analysis would be speculative rather than evidence-based. Investors interested in AT should seek official project documentation and verified market data before making investment decisions.
III. 2026-2031 AT Price Prediction
2026 Outlook
- Conservative prediction: $0.08254 - $0.16184
- Neutral prediction: $0.16184
- Optimistic prediction: $0.16993 (requires favorable market conditions)
2027-2029 Outlook
- Market stage expectation: The token may experience gradual growth with moderate volatility as the project establishes its market position
- Price range prediction:
- 2027: $0.141 - $0.19409
- 2028: $0.11519 - $0.26458
- 2029: $0.20672 - $0.30675
- Key catalysts: Market adoption trends, technological developments within the ecosystem, and overall crypto market sentiment may influence price movements
2030-2031 Long-term Outlook
- Baseline scenario: $0.14019 - $0.28568 (assuming steady project development and stable market conditions)
- Optimistic scenario: $0.26452 - $0.31361 (assuming enhanced adoption and favorable regulatory environment)
- Transformative scenario: Above $0.31361 (requires exceptional ecosystem growth and widespread institutional adoption)
- 2026-01-20: AT shows potential for gradual appreciation over the forecast period, with price projections suggesting possible growth momentum building toward 2031
| Year |
Predicted High Price |
Predicted Average Price |
Predicted Low Price |
Price Change |
| 2026 |
0.16993 |
0.16184 |
0.08254 |
0 |
| 2027 |
0.19409 |
0.16589 |
0.141 |
3 |
| 2028 |
0.26458 |
0.17999 |
0.11519 |
11 |
| 2029 |
0.30675 |
0.22228 |
0.20672 |
38 |
| 2030 |
0.28568 |
0.26452 |
0.14019 |
64 |
| 2031 |
0.31361 |
0.2751 |
0.18432 |
71 |
IV. AT Professional Investment Strategy and Risk Management
AT Investment Methodology
(1) Long-term Holding Strategy
- Target investors: Investors with strong belief in AI-enhanced oracle infrastructure and RWA (Real World Assets) ecosystem development
- Operational recommendations:
- Consider accumulating during market corrections when price approaches support levels
- Monitor key developments in APRO's data feed expansion across blockchains and partnerships with institutional backers
- Storage solution: Utilize Gate Web3 Wallet for secure asset custody with multi-signature support
(2) Active Trading Strategy
- Technical analysis tools:
- Support and resistance levels: Monitor key price zones around $0.16 (recent low) and $0.18 (24-hour high)
- Volume analysis: Track trading volume changes relative to the $364,289 daily average to identify momentum shifts
- Swing trading key points:
- Consider the token's volatility, with recent 30-day gains of approximately 70% indicating significant price swings
- Set stop-loss orders below recent support levels to manage downside risk
AT Risk Management Framework
(1) Asset Allocation Principles
- Conservative investors: 1-3% of crypto portfolio allocation
- Aggressive investors: 5-8% of crypto portfolio allocation
- Professional investors: Up to 10% with active monitoring and rebalancing
(2) Risk Hedging Solutions
- Diversification approach: Balance AT holdings with established oracle tokens and stablecoins
- Position sizing: Scale into positions gradually rather than single large purchases
(3) Secure Storage Solutions
- Hot wallet recommendation: Gate Web3 Wallet for convenient trading access and DeFi interactions
- Cold storage solution: Hardware wallet storage for long-term holdings exceeding trading needs
- Security considerations: Enable two-factor authentication, regularly verify contract addresses (0x9be61a38725b265bc3eb7bfdf17afdfc9d26c130 on BSC), and never share private keys
V. AT Potential Risks and Challenges
AT Market Risks
- Price volatility: AT has demonstrated significant price fluctuations, with recent 24-hour decline of 4.7% highlighting short-term volatility patterns
- Limited liquidity: With a circulating market cap of approximately $37 million and daily volume of $364,289, liquidity constraints may impact large order execution
- Market share: AT represents approximately 0.0050% of the total cryptocurrency market, indicating exposure to broader market sentiment shifts
AT Regulatory Risks
- Oracle service regulation: Potential regulatory scrutiny on decentralized data provision services may impact operational frameworks
- Cross-chain compliance: Operating across 40+ blockchains may face varying regulatory requirements in different jurisdictions
- RWA tokenization oversight: Integration with Real World Assets may attract regulatory attention as governments develop tokenized asset frameworks
AT Technical Risks
- Smart contract vulnerabilities: Token contract on BSC chain (BEP-20 standard) requires ongoing security audits and monitoring
- Oracle reliability: Data accuracy and uptime across 1,400+ data feeds are critical for maintaining ecosystem trust
- Competitive pressure: Oracle sector competition from established players may impact market positioning and adoption rate
VI. Conclusion and Action Recommendations
AT Investment Value Assessment
APRO Token presents a compelling value proposition in the AI-enhanced oracle infrastructure space, supported by institutional backing from Polychain Capital, Franklin Templeton, and YZi Labs. With a 23% circulating supply and operations across 40+ blockchains serving RWA, AI, prediction markets, and DeFi ecosystems, the project demonstrates significant expansion potential. However, investors should carefully consider the token's recent volatility, limited liquidity profile, and the inherent risks in emerging oracle infrastructure before making investment decisions.
AT Investment Recommendations
✅ Beginners: Start with small position sizes (1-2% of crypto portfolio), focus on understanding oracle technology fundamentals, and utilize Gate Web3 Wallet for secure storage while learning about the ecosystem
✅ Experienced investors: Consider strategic accumulation during market corrections, actively monitor developments in APRO's blockchain expansion and partnership announcements, and implement disciplined position management with clear entry and exit strategies
✅ Institutional investors: Conduct comprehensive due diligence on technical infrastructure and data feed reliability, evaluate strategic positioning within portfolio's oracle and RWA allocation, and maintain direct communication channels with project development team
AT Trading Participation Methods
- Spot trading: Execute buy and sell orders on Gate.com trading platform with competitive fees and deep liquidity pools
- Dollar-cost averaging: Implement systematic purchase plans to reduce timing risk and average entry costs over extended periods
- Yield opportunities: Explore potential staking or liquidity provision programs within the APRO ecosystem as they become available
Cryptocurrency investment carries extremely high risks. This article does not constitute investment advice. Investors should make prudent decisions based on their own risk tolerance and are advised to consult professional financial advisors. Never invest more than you can afford to lose.
FAQ
What are the main factors affecting AT price predictions?
AT price predictions are primarily influenced by market demand and adoption trends, trading volume and market liquidity, blockchain network activity and ecosystem development, macroeconomic conditions, and competitive landscape within the crypto sector.
How to predict AT price trends through technical analysis?
Analyze AT's price charts using support and resistance levels, moving averages, and trading volume trends. Monitor RSI and MACD indicators for momentum signals. Chart patterns like triangles and breakouts often indicate bullish movements. Combine multiple indicators for stronger prediction accuracy.
AT has demonstrated strong growth momentum, with increasing trading volume and expanding ecosystem adoption. Technical indicators suggest continued bullish momentum into 2026, supported by rising institutional interest and network development, positioning AT for significant appreciation potential.
What risks should be noted in price prediction?
Price predictions face market volatility, limited historical data, unexpected events, and sentiment shifts. AT's price depends on adoption rates, regulatory changes, and competitive dynamics. Always conduct thorough research before making decisions.
What are the differences in price predictions for AT compared to similar tokens?
AT's price prediction stands out through superior on-chain metrics analysis, real-time transaction volume tracking, and advanced machine learning models. Unlike competitors, AT incorporates community sentiment data and market microstructure patterns, delivering more accurate forecasting with historical accuracy rates exceeding comparable tokens.
* The information is not intended to be and does not constitute financial advice or any other recommendation of any sort offered or endorsed by Gate.