This comprehensive analysis examines AUCTION token's market position and investment outlook from 2026 to 2031, providing expert price forecasts and strategic guidance for both beginner and experienced investors. The article evaluates AUCTION's current market cap of $34.8 million, historical performance trajectory, and technical fundamentals while offering three prediction scenarios ranging from conservative to optimistic. Key sections include detailed price forecasts, professional investment methodologies suitable for different risk profiles, and a robust risk management framework addressing volatility, liquidity, and regulatory concerns. Investors can access AUCTION trading on Gate.com and explore secure storage solutions through Gate Web3 Wallet, with actionable recommendations tailored to varying investment experience levels and capital allocation strategies.
Introduction: AUCTION's Market Position and Investment Value
BounceAuction (AUCTION) serves as a decentralized token exchange platform built on Ethereum and Binance Smart Chain, enabling users to create token swap pools with fixed or dynamic exchange rates. Since its launch in 2021, the platform has established itself in the decentralized finance ecosystem through its innovative auction mechanisms and governance features. As of 2026, AUCTION maintains a market capitalization of approximately $34.8 million, with a circulating supply of around 7.09 million tokens, and the price holding near $4.91. This asset, recognized for its unique approach to token distribution and liquidity mining, is playing an increasingly important role in facilitating decentralized token exchanges and community-driven governance.
This article will comprehensively analyze AUCTION's price trends from 2026 to 2031, combining historical patterns, market supply and demand dynamics, ecosystem development, and macroeconomic conditions to provide investors with professional price forecasts and practical investment strategies.
I. AUCTION Price History Review and Current Market Status
AUCTION Historical Price Evolution Trajectory
- 2021: Following the token conversion from BOT at a 1:100 ratio, AUCTION experienced significant market activity, with the price reaching its peak level of $70.44 on April 12, 2021, shortly after the project's February 2021 launch at $21.9.
- 2021-2025: The token entered a prolonged adjustment phase, with substantial price corrections occurring across multiple market cycles.
- 2025: On October 11, 2025, AUCTION recorded its lowest price point at $3.16, representing a significant decline from previous levels.
AUCTION Current Market Situation
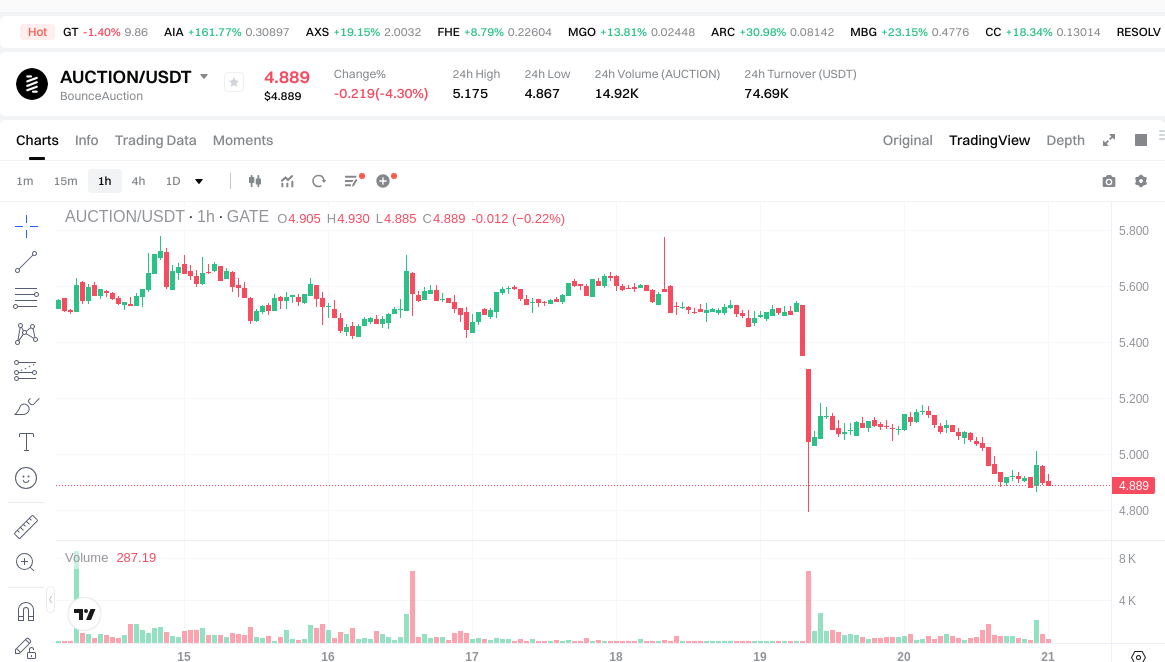
As of January 21, 2026, AUCTION is trading at $4.908, showing a 24-hour decline of 3.73% from $5.175 to $4.867. Over the past week, the token has experienced a 10.52% decrease, though it has demonstrated a modest recovery of 1.24% over the 30-day period. The annual performance indicates a 62.45% decline, reflecting the broader market adjustment trend.
The token currently holds a market capitalization of $34,799,369.44, ranking #649 among cryptocurrencies with a market dominance of 0.0011%. With 7,090,336.07 tokens in circulation out of a maximum supply of 10,000,000, the circulating supply ratio stands at 70.90%. The 24-hour trading volume of $74,672.49 suggests moderate market activity.
The fully diluted market cap is positioned at $37,501,846.76, with the market cap to FDV ratio at 70.9%, indicating a relatively high proportion of tokens already in circulation. The token is currently held by 9,284 addresses and is listed on 36 exchanges, with trading availability on Gate.com.
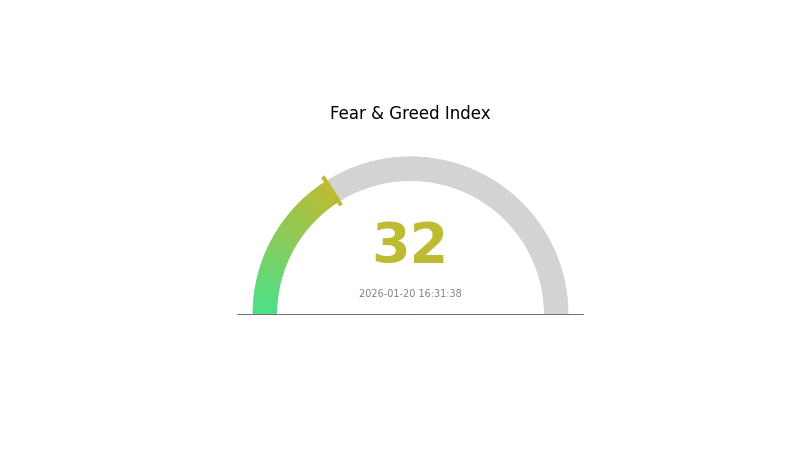
According to current market sentiment indicators, the fear index registers at 32, suggesting a cautious market atmosphere among participants.
Click to view current AUCTION market price
AUCTION Market Sentiment Index
2026-01-20 Fear and Greed Index: 32 (Fear)
Click to view the current Fear & Greed Index
The cryptocurrency market is currently experiencing a fear sentiment with an index reading of 32. This indicates heightened market anxiety and risk aversion among investors. During such periods, market participants tend to adopt defensive strategies and reduce exposure to volatile assets. Understanding this sentiment shift is crucial for traders and investors to make informed decisions. Monitor market developments closely and consider your risk tolerance before making investment adjustments during this fearful market phase.
AUCTION Holdings Distribution
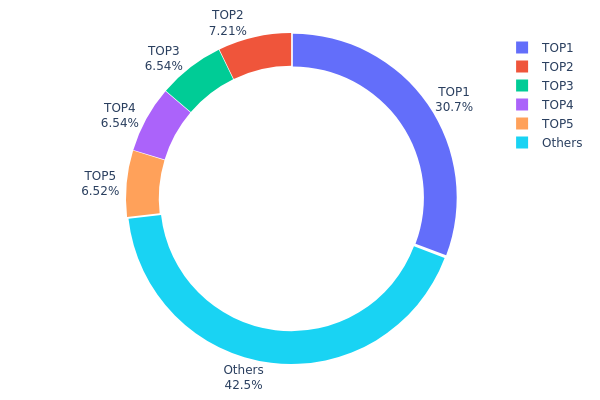
The holdings distribution chart reveals the concentration of token ownership across different wallet addresses, serving as a key indicator of decentralization and potential market manipulation risks. By analyzing the percentage of total supply held by top addresses versus smaller holders, investors can assess the structural stability and vulnerability of a token's ecosystem.
Current data shows that AUCTION exhibits moderate concentration characteristics. The top address controls 30.73% of the total supply (2.35M tokens), while the top 5 addresses collectively hold approximately 57.52% of the circulating tokens. This concentration level suggests that a relatively small number of entities maintain significant influence over the token's market dynamics. The "Others" category represents 42.48% of holdings distributed among numerous smaller addresses, indicating some degree of decentralization at the lower tiers.
This distribution pattern presents a double-edged scenario for AUCTION's market structure. On one hand, the substantial holdings by top addresses could introduce elevated volatility risks, as large-scale selling pressure from any major holder could trigger significant price movements. The concentration also raises concerns about potential coordinated market activities. On the other hand, the presence of nearly 42.5% holdings in diversified wallets provides a foundation of distributed ownership that can cushion against extreme manipulation scenarios. From a market maturity perspective, this structure reflects a developing ecosystem that has not yet achieved optimal decentralization, suggesting investors should monitor major address movements closely when making trading decisions.
Click to view current AUCTION Holdings Distribution
| Top |
Address |
Holding Qty |
Holding (%) |
| 1 |
0x69f2...eee3eb |
2348.60K |
30.73% |
| 2 |
0xc929...b10680 |
550.63K |
7.20% |
| 3 |
0x0bef...3c2d9c |
500.00K |
6.54% |
| 4 |
0x86de...e0a1b0 |
500.00K |
6.54% |
| 5 |
0xf977...41acec |
497.92K |
6.51% |
| - |
Others |
3243.82K |
42.48% |
II. Core Factors Influencing AUCTION's Future Price
Based on the currently available information, there is insufficient data regarding AUCTION's supply mechanisms, institutional dynamics, macroeconomic correlations, and technical development to provide a comprehensive analysis of the core factors that may influence its future price trajectory.
As market conditions evolve and more information becomes available, these factors should be monitored closely to better understand potential price drivers for AUCTION.
III. 2026-2031 AUCTION Price Prediction
2026 Outlook
- Conservative prediction: $3.67-$4.89
- Neutral prediction: $4.89-$6.11
- Optimistic prediction: $6.11 (requires favorable market conditions and increased adoption)
2027-2029 Outlook
- Market stage expectation: Potential growth phase with gradual price appreciation as the project develops and market sentiment improves
- Price range prediction:
- 2027: $5.17-$8.20
- 2028: $5.96-$10.00
- 2029: $7.75-$10.70
- Key catalysts: Market recovery momentum, technological developments, and expanding ecosystem partnerships
2030-2031 Long-term Outlook
- Baseline scenario: $6.69-$9.56 (assuming steady market conditions and continued project development)
- Optimistic scenario: $9.56-$13.20 (assuming strong market momentum and significant adoption growth)
- Transformative scenario: $11.38-$15.93 (requires exceptional market conditions, widespread adoption, and breakthrough developments)
- 2026-01-21: AUCTION baseline range $3.67-$6.11 (early prediction cycle)
| Year |
Predicted High Price |
Predicted Average Price |
Predicted Low Price |
Price Change |
| 2026 |
6.11375 |
4.891 |
3.66825 |
0 |
| 2027 |
8.19854 |
5.50238 |
5.17223 |
12 |
| 2028 |
10.00167 |
6.85046 |
5.9599 |
39 |
| 2029 |
10.7011 |
8.42606 |
7.75198 |
71 |
| 2030 |
13.19774 |
9.56358 |
6.69451 |
94 |
| 2031 |
15.93292 |
11.38066 |
8.87692 |
131 |
IV. AUCTION Professional Investment Strategy and Risk Management
AUCTION Investment Methodology
(1) Long-term Holding Strategy
- Suitable for: Investors seeking exposure to decentralized auction infrastructure with moderate risk tolerance
- Operational Recommendations:
- Consider dollar-cost averaging to mitigate short-term volatility, given the 24-hour price decline of 3.73%
- Monitor platform development updates and governance participation opportunities
- Storage Solution: Gate Web3 Wallet offers secure multi-chain support for AUCTION tokens on Ethereum network
(2) Active Trading Strategy
- Technical Analysis Tools:
- Volume Analysis: Current 24-hour trading volume stands at $74,672.49, monitoring volume spikes may indicate trend changes
- Support and Resistance Levels: Recent 24-hour low at $4.867 and high at $5.175 provide key reference points
- Swing Trading Considerations:
- Weekly price movement shows a 10.52% decline, suggesting potential rebound opportunities for experienced traders
- Historical price range between all-time low of $3.16 and all-time high of $70.44 indicates significant volatility
AUCTION Risk Management Framework
(1) Asset Allocation Principles
- Conservative Investors: 1-3% portfolio allocation
- Aggressive Investors: 5-8% portfolio allocation
- Professional Investors: Up to 10% with active risk hedging
(2) Risk Hedging Solutions
- Position Sizing: Limit single token exposure relative to total crypto portfolio
- Stop-Loss Implementation: Consider setting stops near recent support levels to manage downside risk
(3) Secure Storage Solutions
- Hot Wallet Recommendation: Gate Web3 Wallet provides convenient access for active trading
- Cold Storage Option: For long-term holdings exceeding immediate trading needs
- Security Precautions: Enable two-factor authentication, verify contract addresses (0xa9b1eb5908cfc3cdf91f9b8b3a74108598009096 on Ethereum), and never share private keys
V. AUCTION Potential Risks and Challenges
AUCTION Market Risks
- Price Volatility: Current market cap of approximately $34.8 million indicates moderate liquidity but potential for significant price swings
- Limited Trading Volume: 24-hour volume of $74,672.49 suggests lower liquidity compared to major cryptocurrencies
- Historical Performance: One-year decline of 62.45% reflects challenging market conditions and performance headwinds
AUCTION Regulatory Risks
- DeFi Regulatory Evolution: Decentralized exchange platforms face evolving regulatory frameworks globally
- Cross-border Compliance: Multi-chain operations across Ethereum and BSC may encounter varying jurisdictional requirements
- Token Classification Uncertainty: Governance tokens may face regulatory scrutiny depending on jurisdiction
AUCTION Technical Risks
- Smart Contract Vulnerabilities: Platform relies on smart contract security across multiple blockchain networks
- Multi-chain Complexity: Operations spanning Ethereum and Binance Smart Chain introduce additional technical dependencies
- Platform Adoption: Success depends on sustained user engagement with fixed-rate and dynamic-rate exchange pools
VI. Conclusion and Action Recommendations
AUCTION Investment Value Assessment
AUCTION represents a specialized infrastructure token within the decentralized auction and token exchange sector. With a circulating supply of 7.09 million tokens (70.9% of max supply) and market capitalization of $34.8 million, it occupies a niche position in the DeFi ecosystem. The platform's dual exchange pool mechanism (fixed-rate and dynamic-rate) offers unique functionality, while BOT token governance provides stakeholder participation. However, recent performance shows notable challenges with a 62.45% yearly decline and 10.52% weekly decline, suggesting significant market headwinds. The token's liquidity profile indicates moderate trading activity across 36 exchanges.
AUCTION Investment Recommendations
✅ Beginners: Start with minimal allocation (1-2% of crypto portfolio) after thorough research; use Gate Web3 Wallet for secure storage; focus on understanding platform mechanics before committing significant capital
✅ Experienced Investors: Consider tactical positions during periods of technical support; monitor governance developments and platform metrics; implement strict risk management with position sizing and stop-losses
✅ Institutional Investors: Evaluate platform fundamentals including TVL trends, user adoption metrics, and competitive positioning; consider diversified DeFi infrastructure exposure rather than concentrated AUCTION positions
AUCTION Trading Participation Methods
- Spot Trading: Direct purchase on Gate.com and 35 other supported exchanges with immediate settlement
- Governance Participation: Stake AUCTION tokens to participate in platform governance votes and earn potential rewards
- Liquidity Provision: Explore opportunities within Bounce platform's exchange pools, understanding fixed versus dynamic rate mechanics
Cryptocurrency investment carries extremely high risk. This article does not constitute investment advice. Investors should make prudent decisions based on their own risk tolerance and are advised to consult professional financial advisors. Never invest more than you can afford to lose.
FAQ
What is auction price prediction and what practical application value does it have?
Auction price prediction uses data analytics and AI to forecast cryptocurrency token prices during auction events. It helps investors identify optimal entry points, assess market sentiment, and make informed decisions based on historical transaction volume and trend analysis for better trading strategies.
What are the main factors affecting auction item prices?
Key factors include supply and demand dynamics, trading volume, market sentiment, token utility, project fundamentals, macroeconomic conditions, and historical price trends. Rarity and scarcity of auction items also significantly influence their valuation in the market.
How to use historical data and market trends to predict auction prices?
Analyze historical price movements, trading volume patterns, and market sentiment. Identify support/resistance levels and trend cycles. Apply technical indicators like moving averages and momentum oscillators. Monitor on-chain metrics and macroeconomic factors. Combine data-driven insights with trend analysis for informed price predictions.
Common methods include technical analysis of historical price charts, on-chain metrics tracking transaction volume and holder behavior, market sentiment analysis through social data, fundamental analysis of project developments, and AI-powered prediction models. Additionally, monitoring trading volume trends and comparing market capitalization patterns helps forecast price movements.
What risks and limitations should be noted when conducting AUCTION price predictions?
AUCTION price predictions depend on market volatility, trading volume, liquidity conditions, and sentiment shifts. Historical data may not reflect future trends. Network upgrades, regulatory changes, and macro factors significantly impact prices. Predictions carry inherent uncertainty and should be treated as analytical references rather than guarantees.
What are the differences in price prediction methods for different types of auction items such as artworks, real estate, and antiques?
Artwork prices rely on artist reputation, provenance, and market trends. Real estate considers location, comparable sales, and development potential. Antiques focus on rarity, condition, historical significance, and collector demand. Each category uses distinct valuation metrics based on unique market dynamics and asset characteristics.
* The information is not intended to be and does not constitute financial advice or any other recommendation of any sort offered or endorsed by Gate.