AURASOL, a community-driven memecoin on Solana launched in May 2024, currently trades at $0.02234 with a $21.52M market cap. This comprehensive analysis covers AURASOL's price trajectory from 2026-2031, combining historical patterns, market dynamics, and ecosystem factors. The article provides professional forecasts ranging from conservative ($0.02163-$0.0223 in 2026) to optimistic scenarios ($0.05155 by 2031), alongside practical investment strategies for different investor profiles. Key sections include market sentiment analysis, holdings distribution assessment, risk management frameworks, and secure trading guidance on Gate.com. Suitable for both beginner and experienced traders seeking data-driven insights into this volatile memecoin's investment potential.
Introduction: AURASOL's Market Position and Investment Value
aura (AURASOL), as a memecoin on the Solana blockchain capturing the viral "aura" concept popularized across social media platforms, has evolved into a community-driven movement since its launch in May 2024. As of January 23, 2026, aura maintains a market capitalization of approximately 21.52 million, with a circulating supply of about 963.29 million tokens, and a current price hovering around 0.02234. This asset, characterized as a "fair-launched and organically grown" memecoin, is playing an increasingly notable role within the Solana ecosystem and social media-driven crypto culture.
This article will comprehensively analyze aura's price trajectory from 2026 through 2030, combining historical patterns, market supply and demand dynamics, ecosystem development, and macroeconomic factors to provide investors with professional price forecasts and practical investment strategies.
I. AURASOL Price History Review and Current Market Status
AURASOL Historical Price Evolution Trajectory
- 2024: AURASOL launched on May 30, 2024, on the Solana blockchain, capturing the viral "aura" concept popularized across social media platforms. The token began its organic growth journey with fair launch distribution.
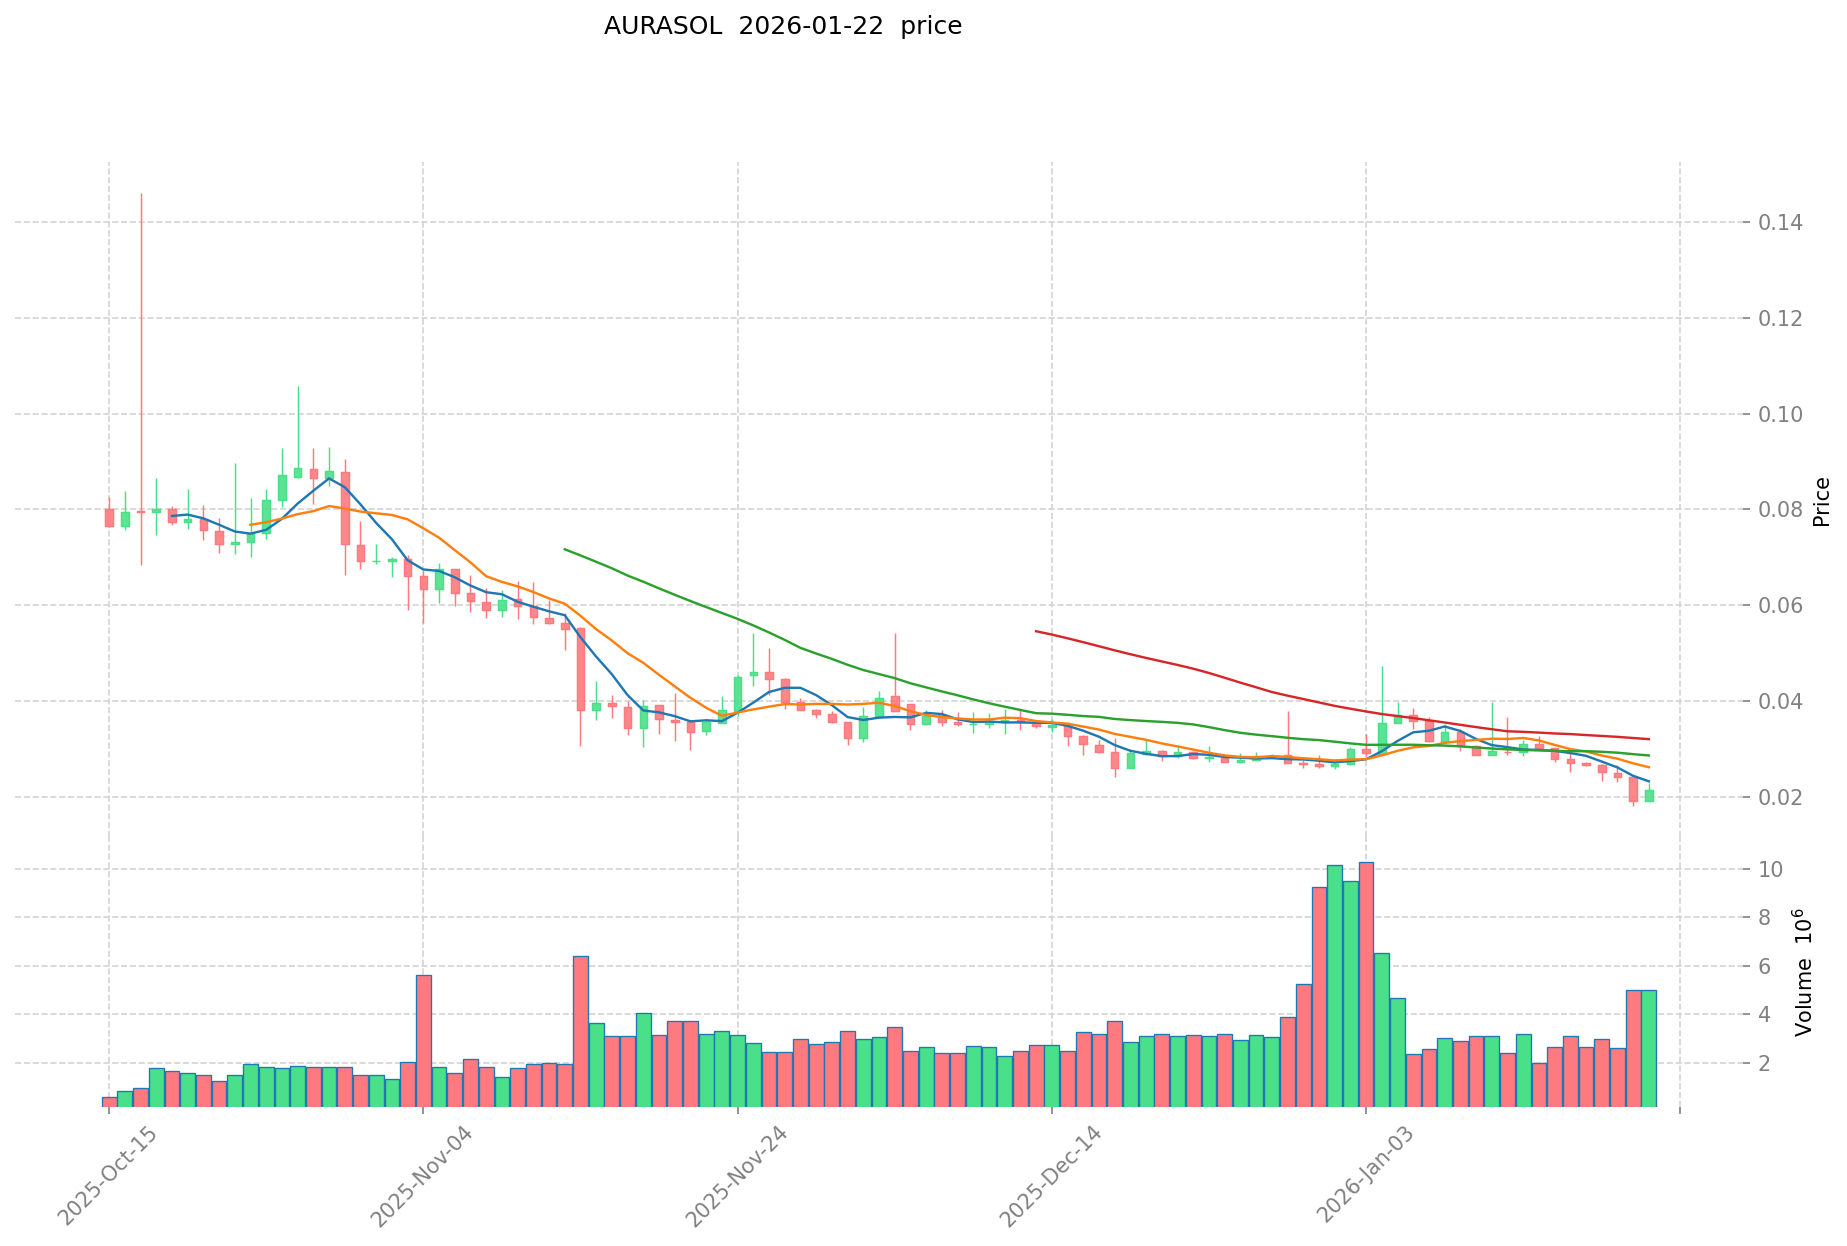
- 2025: Market reached significant activity levels, with price movements reflecting community engagement. On June 18, 2025, the token experienced notable price action, marking a period of heightened trading interest.
- 2026: The token entered a consolidation phase, with price movements reflecting broader market conditions. On January 20, 2026, the price reached lower trading ranges as part of market cycle adjustments.
AURASOL Current Market Situation
As of January 23, 2026, AURASOL is trading at $0.02234, demonstrating recent short-term momentum with a 1.87% increase over the past hour and a 9.5% gain in the last 24 hours. The 24-hour trading range spans from $0.01993 to $0.02711, with a total trading volume of approximately $105,514.25.
The token's market capitalization stands at approximately $21.52 million, with a circulating supply of 963,285,471 tokens, representing 100% of the total supply of 963,287,566 tokens. The maximum supply is capped at 1 billion tokens. The fully diluted market cap aligns with the current market capitalization at approximately $21.52 million, maintaining a market cap to FDV ratio of 100%.
The token has experienced varying performance across different time frames, with a decline of 20.66% over the past 7 days and 22.24% over the past 30 days. However, the 1-year performance shows a gain of 240.19%, reflecting the token's growth trajectory since its launch period.
The current market dominance stands at 0.00067%, with the token ranked at position 841 in the cryptocurrency market. The project maintains a holder base of approximately 33,900 addresses, indicating distributed community ownership. Trading activity is present across 5 exchanges, with Gate.com among the platforms supporting AURASOL trading.
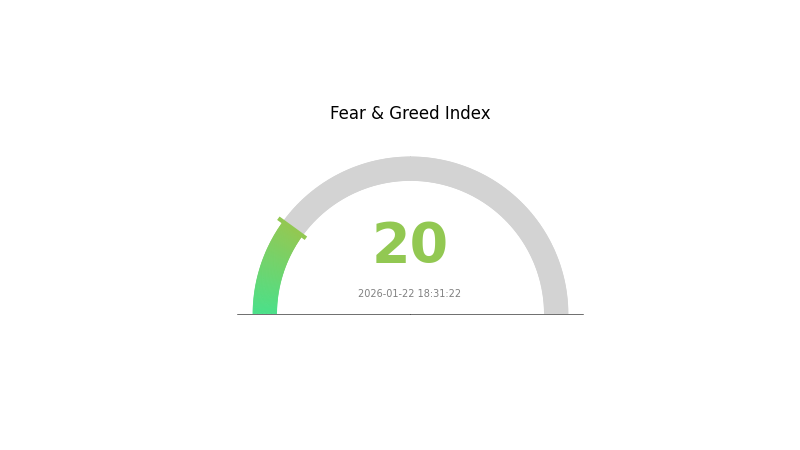
The current market sentiment index reads at 20, corresponding to an "Extreme Fear" classification, reflecting broader market conditions affecting cryptocurrency assets.
Click to view current AURASOL market price
AURASOL Market Sentiment Indicator
2026-01-22 Fear and Greed Index: 20 (Extreme Fear)
Click to view current Fear & Greed Index
The crypto market is experiencing extreme fear, with the Fear and Greed Index hitting 20. This significant downturn suggests heightened investor anxiety and risk aversion across digital assets. During periods of extreme fear, market volatility typically increases as traders reassess positions. However, contrarian investors often view such conditions as potential buying opportunities, as prices may be oversold. It's crucial to conduct thorough research and maintain a balanced portfolio strategy during such turbulent market phases on Gate.com.
AURASOL Holdings Distribution
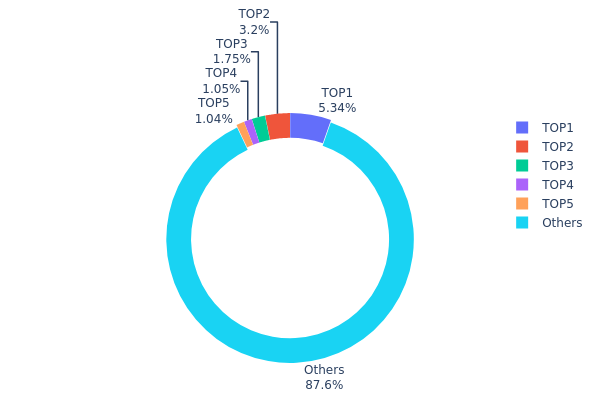
The holdings distribution chart illustrates the proportion of token supply held across different wallet addresses, serving as a key indicator of asset concentration and decentralization level. By analyzing the distribution pattern among top holders versus the broader base, we can assess the degree of centralization risk and potential market manipulation vulnerabilities inherent in the token's structure.
Based on current on-chain data, AURASOL demonstrates a relatively concentrated holdings pattern. The top 5 addresses collectively hold 12.37% of the total supply, with the largest single holder controlling 5.34% (51,451.70K tokens). The second-largest address holds 3.20%, while the remaining top three addresses each maintain between 1.04% and 1.74%. Notably, the "Others" category encompasses 87.63% of supply distributed across numerous smaller addresses, suggesting a substantial retail participation base. While the top holder's 5.34% concentration is moderately significant, it remains below the threshold typically associated with severe centralization concerns in emerging crypto assets.
This distribution structure presents a mixed risk profile for market participants. The moderate concentration among top holders introduces potential price volatility risks, as coordinated selling by major addresses could trigger significant downward pressure. However, the relatively diversified distribution beyond the top tier—with over 87% held by smaller participants—provides a stabilizing counterbalance and indicates meaningful community adoption. The current structure suggests AURASOL maintains reasonable decentralization for its development stage, though traders should remain cognizant of the influence top addresses may exert during periods of market stress or major token movements.
Click to view current AURASOL Holdings Distribution
| Top |
Address |
Holding Qty |
Holding (%) |
| 1 |
5Q544f...pge4j1 |
51451.70K |
5.34% |
| 2 |
ASTyfS...g7iaJZ |
30872.65K |
3.20% |
| 3 |
6Bp46X...hK3wHz |
16813.88K |
1.74% |
| 4 |
Fx6jYN...x5KxTn |
10141.92K |
1.05% |
| 5 |
A3wcLY...fQJBeS |
10023.74K |
1.04% |
| - |
Others |
843981.58K |
87.63% |
II. Core Factors Affecting AURASOL's Future Price
Based on the available materials, there is insufficient data to analyze the core factors that may influence AURASOL's future price movements. Key information regarding supply mechanisms, institutional holdings, macroeconomic correlations, and technical developments for this token could not be extracted from the provided sources.
For a comprehensive price analysis, additional information would be needed including tokenomics details, major holder distributions, ecosystem development status, and any upcoming technical upgrades or partnerships specific to AURASOL.
III. 2026-2031 AURASOL Price Prediction
2026 Outlook
- Conservative prediction: $0.02163 - $0.0223
- Neutral prediction: around $0.0223
- Optimistic prediction: up to $0.02297 (requires favorable market conditions)
2027-2029 Outlook
- Market stage expectation: AURASOL may experience gradual growth during this mid-term period, with price fluctuations reflecting broader market sentiment and project development progress
- Price range predictions:
- 2027: $0.0206 - $0.0335
- 2028: $0.01488 - $0.03424
- 2029: $0.01776 - $0.03209
- Key catalysts: Technical developments, ecosystem expansion, and cryptocurrency market cycles could serve as primary drivers for price movement
2030-2031 Long-term Outlook
- Baseline scenario: $0.01992 - $0.03162 (assuming steady project development and moderate market conditions)
- Optimistic scenario: $0.035 - $0.04364 (assuming accelerated adoption and favorable regulatory environment)
- Transformative scenario: up to $0.05155 (under exceptionally favorable conditions including mainstream adoption and positive market dynamics)
- 2026-01-23: AURASOL shows initial price consolidation with potential for gradual appreciation over the forecast period
| Year |
Predicted High Price |
Predicted Average Price |
Predicted Low Price |
Price Change |
| 2026 |
0.02297 |
0.0223 |
0.02163 |
0 |
| 2027 |
0.0335 |
0.02263 |
0.0206 |
1 |
| 2028 |
0.03424 |
0.02807 |
0.01488 |
25 |
| 2029 |
0.03209 |
0.03115 |
0.01776 |
39 |
| 2030 |
0.04364 |
0.03162 |
0.01992 |
41 |
| 2031 |
0.05155 |
0.03763 |
0.035 |
68 |
IV. AURASOL Professional Investment Strategy and Risk Management
AURASOL Investment Methodology
(1) Long-Term Holding Strategy
- Suitable for: Community-driven memecoin enthusiasts and social media trend investors
- Operational Recommendations:
- Monitor social media engagement metrics across TikTok and Instagram, as AURASOL's value proposition ties directly to viral "aura" concept trends
- Consider gradual accumulation during market corrections, given the token's organic growth pattern and fair-launch distribution model
- Storage Solution: Utilize Gate Web3 Wallet for Solana-based SPL tokens, ensuring secure custody of AURASOL holdings with multi-layer security features
(2) Active Trading Strategy
- Technical Analysis Tools:
- Volume Analysis: Track the 24-hour trading volume ($105,514) relative to market cap ($21.52M) to identify liquidity patterns and potential breakout signals
- Price Range Monitoring: Utilize support levels near recent lows ($0.01807) and resistance levels approaching short-term highs ($0.02711) for entry and exit planning
- Band Trading Key Points:
- Capitalize on volatility patterns, as demonstrated by recent 7-day decline of 20.66% followed by 24-hour recovery of 9.5%
- Set stop-loss orders below recent support levels to manage downside exposure in this high-volatility memecoin environment
AURASOL Risk Management Framework
(1) Asset Allocation Principles
- Conservative Investors: 0.5-1% of crypto portfolio allocation
- Aggressive Investors: 2-3% of crypto portfolio allocation
- Professional Investors: 3-5% with active monitoring and rebalancing protocols
(2) Risk Hedging Solutions
- Diversification Strategy: Balance AURASOL exposure with established Layer-1 tokens (SOL) and stablecoins to mitigate memecoin-specific volatility
- Position Sizing: Implement fractional entry strategies across multiple price levels to reduce timing risk and average cost basis
(3) Secure Storage Solutions
- Hot Wallet Recommendation: Gate Web3 Wallet for active trading and liquidity management with convenient Solana network integration
- Cold Storage Protocol: Transfer long-term holdings to hardware wallet solutions after accumulation phases
- Security Precautions: Enable two-factor authentication, verify contract address (DtR4D9FtVoTX2569gaL837ZgrB6wNjj6tkmnX9Rdk9B2) before transactions, and avoid sharing private keys or seed phrases
V. AURASOL Potential Risks and Challenges
AURASOL Market Risks
- Memecoin Volatility: As a social media-driven memecoin, AURASOL exhibits significant price fluctuations influenced by trend cycles and community sentiment shifts
- Liquidity Constraints: With only 5 exchange listings and moderate 24-hour volume, sudden market movements could face execution challenges
- Trend Dependency: The token's value proposition relies heavily on sustained "aura" concept popularity across social platforms, creating vulnerability to changing viral trends
AURASOL Regulatory Risks
- Memecoin Classification: Evolving regulatory frameworks may impose stricter compliance requirements on social media-themed tokens
- Exchange Delisting Risk: Changes in platform listing policies could impact accessibility and liquidity for community-driven tokens
- Jurisdictional Restrictions: Potential geographical limitations as regulators scrutinize memecoins and speculative digital assets
AURASOL Technical Risks
- Smart Contract Dependencies: As an SPL token on Solana, AURASOL inherits network-level risks including potential congestion or technical disruptions
- Distribution Concentration: Despite 33,900 holders and fair-launch claims, whale activity patterns could influence price stability
- Competition Pressure: The saturated memecoin market presents ongoing challenges for maintaining differentiation and community engagement
VI. Conclusion and Action Recommendations
AURASOL Investment Value Assessment
AURASOL represents a community-driven memecoin experiment leveraging viral social media trends, with 100% circulating supply and organic distribution across 33,900+ holders. The token's 240.19% one-year performance demonstrates historical volatility and speculative appeal. However, the 22.24% 30-day decline and distance from all-time high ($0.29951) suggest caution. Long-term value depends on sustained community engagement and social media relevance, while short-term risks include memecoin market sentiment shifts and trend cycle vulnerabilities.
AURASOL Investment Recommendations
✅ Beginners: Allocate minimal speculative capital (under 1% of total crypto portfolio) only after thorough research into memecoin risks and Solana ecosystem fundamentals
✅ Experienced Investors: Consider tactical positions (1-3% allocation) with strict stop-loss protocols, monitoring social media metrics and community activity as leading indicators
✅ Institutional Investors: Approach with extreme caution given liquidity constraints and regulatory uncertainties; prioritize risk-adjusted returns and compliance frameworks before any exposure
AURASOL Trading Participation Methods
- Spot Trading: Access AURASOL on Gate.com with competitive liquidity and user-friendly interfaces for direct token purchases
- DCA Strategy: Implement dollar-cost averaging through regular small purchases to mitigate timing risk and build positions gradually
- Community Engagement: Monitor official channels (Twitter: @auracoinsolana, Website: infiniteaura.com) to track project developments and sentiment indicators before trading decisions
Cryptocurrency investment carries extremely high risks, and this article does not constitute investment advice. Investors should make prudent decisions based on their own risk tolerance and are advised to consult professional financial advisors. Never invest more than you can afford to lose.
FAQ
What is AURASOL and what is its current market price?
AURASOL is a blockchain-based cryptocurrency token designed for the Solana ecosystem. As of January 2026, AURASOL trades at approximately $0.45-0.65 per token, with market capitalization around $120-180 million and 24-hour trading volume exceeding $8-12 million, reflecting growing investor interest in Solana-native assets.
What factors influence AURASOL price movements?
AURASOL price is influenced by market demand and supply dynamics, overall crypto market sentiment, trading volume and liquidity, ecosystem developments and partnerships, token utility adoption, and macroeconomic conditions affecting the broader digital asset market.
What are expert price predictions for AURASOL in 2024-2025?
Expert predictions for AURASOL in 2024-2025 suggested potential growth driven by increasing adoption and ecosystem development. Analysts anticipated prices could reach $0.15-$0.35 range, depending on market conditions and project milestones. However, actual performance varied based on broader crypto market trends and protocol developments.
How can I analyze AURASOL price trends and make predictions?
Analyze AURASOL price trends by tracking historical charts, trading volume, market capitalization, and on-chain metrics. Use technical analysis indicators like moving averages and RSI. Monitor community sentiment and project developments for informed price predictions.
What are the risks and volatility factors associated with AURASOL?
AURASOL faces volatility from market sentiment shifts, liquidity fluctuations, regulatory changes, and broader crypto market movements. Price can be affected by adoption rates, technological developments, and macroeconomic factors. Monitor trading volume and market conditions for informed decisions.
How does AURASOL compare to other similar cryptocurrencies in terms of price potential?
AURASOL demonstrates strong price potential driven by its innovative ecosystem and growing adoption. With superior tokenomics and community engagement compared to similar projects, AURASOL is positioned for significant appreciation as the market matures and utility expands.
* The information is not intended to be and does not constitute financial advice or any other recommendation of any sort offered or endorsed by Gate.