This comprehensive analysis examines AURORA's price trajectory from 2026 to 2031, combining historical data, market dynamics, and ecosystem development to guide investment decisions. AURORA, an EVM solution on NEAR Protocol, currently trades at $0.04613 with market capitalization of $31.05 million, displaying extreme market fear (index: 24). The article reviews AURORA's volatile performance—declining 74.91% annually—and presents tiered price forecasts ranging from conservative to optimistic scenarios, projecting potential 79-122% growth by 2031. Professional investment strategies include dollar-cost averaging for long-term holders and technical analysis for active traders, complemented by detailed risk management frameworks addressing volatility, liquidity constraints, and regulatory uncertainties. Trading AURORA on Gate provides accessible entry for retail-sized transactions with competitive fees.
Introduction: AURORA's Market Position and Investment Value
Aurora (AURORA), as a leading Ethereum Virtual Machine (EVM) solution built on the NEAR Protocol, has been bridging Ethereum and NEAR ecosystems since its inception in 2021. As of 2026, Aurora has achieved a market capitalization of approximately $31.05 million, with a circulating supply of around 673.20 million tokens, and the price maintains at approximately $0.04613. This asset, recognized as a "turnkey solution for Ethereum compatibility on NEAR," is playing an increasingly critical role in facilitating cross-chain interoperability and enabling developers to deploy Solidity smart contracts on a high-throughput, scalable platform with significantly reduced transaction costs.
This article will comprehensively analyze Aurora's price trajectory from 2026 to 2031, combining historical patterns, market supply and demand dynamics, ecosystem development, and macroeconomic conditions to provide investors with professional price forecasts and practical investment strategies.
I. AURORA Price History Review and Market Status
AURORA Historical Price Evolution Trajectory
- 2022: Reached a notable price level of $35.4 on January 17, marking a significant point in the token's early trading history, followed by substantial volatility in the broader cryptocurrency market.
- 2022-2025: The token experienced considerable price adjustments, declining from its earlier elevated levels as market conditions evolved and the cryptocurrency sector underwent multiple cycles.
- 2026: On January 21, the price reached $0.04500567, representing a notable adjustment from previous price levels as the token continued to navigate market dynamics.
AURORA Current Market Situation
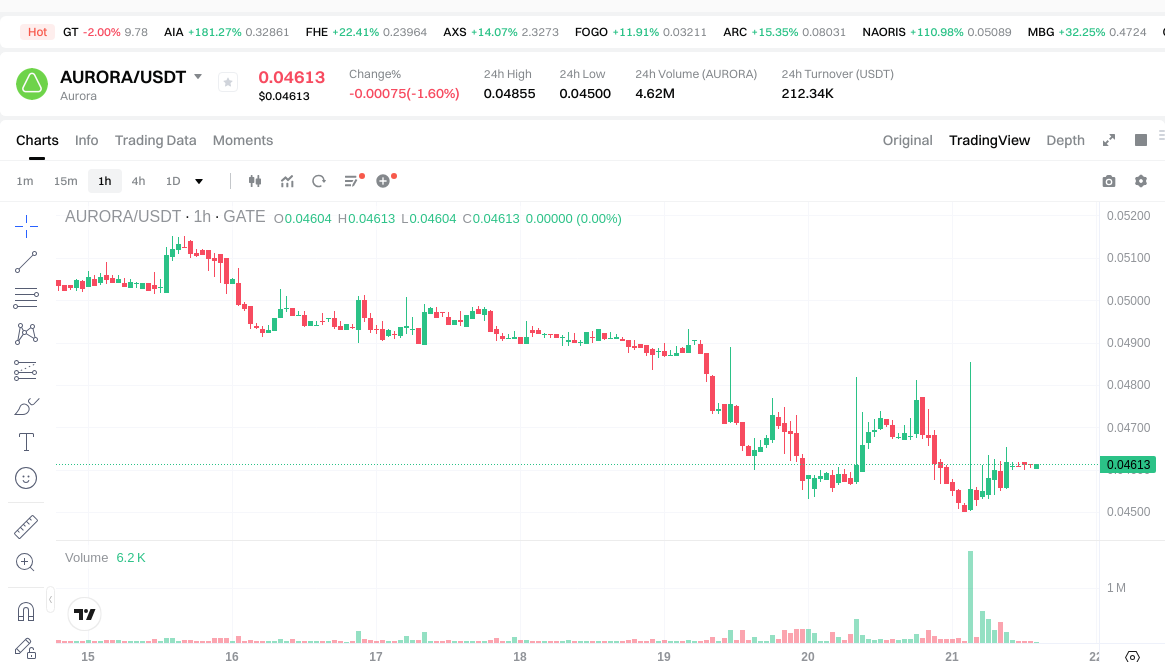
As of January 21, 2026, AURORA is trading at $0.04613, showing a 24-hour price change of -1.7%. The token's trading activity demonstrates a 24-hour volume of $212,465.10, with intraday price movements ranging between $0.045 (low) and $0.04855 (high).
The market capitalization stands at approximately $31.05 million, with a circulating supply of 673,203,215 AURORA tokens, representing 67.32% of the maximum supply of 1 billion tokens. The fully diluted market cap is calculated at $46.12 million.
Recent price performance shows a -8.6% change over the past 7 days and a -4.51% movement over 30 days. The 1-year performance indicates a -74.91% change. The token maintains a market dominance of 0.0014% and is listed on 9 exchanges.
Aurora operates as an EVM built on the NEAR Protocol, providing developers with an Ethereum-compatible platform featuring characteristics such as scalability and reduced transaction costs. The platform facilitates the deployment of Solidity smart contracts on NEAR blockchain and enables asset transfers between Ethereum and NEAR, including ERC-20 tokens. The token has contracts deployed on both Ethereum and Aurora EVM networks, with approximately 7,435 holders.
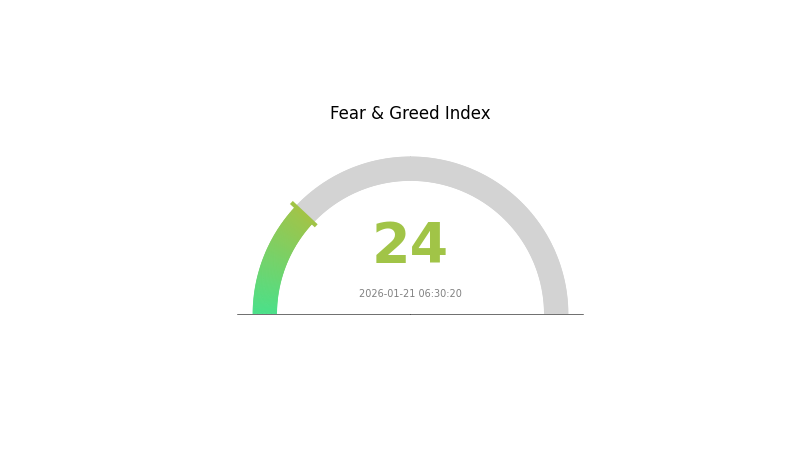
The current market sentiment index stands at 24, indicating an extreme fear level in the broader cryptocurrency market environment.
Click to view current AURORA market price
AURORA Market Sentiment Indicator
2026-01-21 Fear and Greed Index: 24 (Extreme Fear)
Click to view current Fear & Greed Index
The cryptocurrency market is currently experiencing extreme fear, with the Fear and Greed Index at 24. This historically low reading indicates severe market pessimism and heightened anxiety among investors. During such extreme fear periods, experienced traders often view it as a potential buying opportunity, as markets tend to recover from oversold conditions. However, caution remains advisable until stabilizing signals emerge. Monitor market developments closely before making investment decisions.
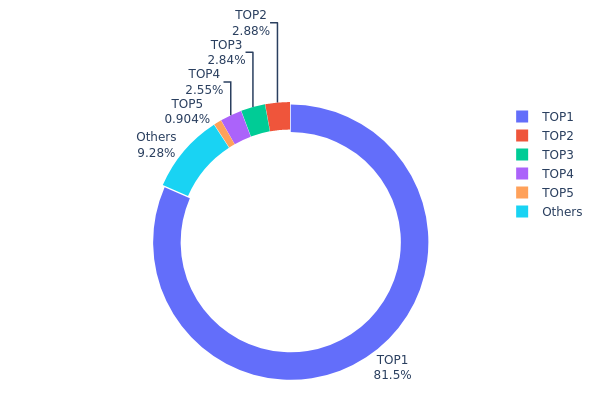
AURORA Token Holder Distribution
The holder distribution chart serves as a critical indicator of token concentration across wallet addresses, reflecting the degree of decentralization and structural stability within the blockchain ecosystem. By analyzing the proportion of tokens held by top addresses versus the broader holder base, this metric provides insights into potential market manipulation risks, liquidity dynamics, and the overall health of token distribution.
Based on the current data, AURORA exhibits an extremely high concentration level, with the top holder controlling 815,456.82K tokens, representing 81.54% of the total supply. This dominant position is significantly disproportionate compared to subsequent holders—the second through fifth largest addresses collectively hold only 8.16% of the supply. The remaining 9.3% is distributed among other addresses, indicating a highly centralized ownership structure. Such extreme concentration raises substantial concerns regarding centralization risks and potential vulnerability to single-entity decision-making.
This concentration pattern presents notable implications for market structure and price stability. The overwhelming dominance of a single address creates asymmetric market power, potentially exposing the token to heightened volatility during large-scale transfers or liquidations. The limited distribution across a broader holder base suggests reduced organic community participation and increased susceptibility to coordinated price movements. From a decentralization perspective, this distribution structure deviates significantly from the ideal of distributed ownership, reflecting a market condition where governance and economic control remain highly concentrated rather than democratized across the ecosystem.
Click to view current AURORA Token Holder Distribution
| Top |
Address |
Holding Qty |
Holding (%) |
| 1 |
0xe00c...4c85b9 |
815456.82K |
81.54% |
| 2 |
0xc938...26a5dc |
28753.57K |
2.87% |
| 3 |
0x7805...c47d5f |
28411.52K |
2.84% |
| 4 |
0xfc51...ffce8b |
25523.54K |
2.55% |
| 5 |
0xf89d...5eaa40 |
9040.58K |
0.90% |
| - |
Others |
92813.97K |
9.3% |
II. Core Factors Affecting AURORA's Future Price
Based on the available information, there is insufficient data to provide a comprehensive analysis of the core factors affecting AURORA's future price. The provided materials do not contain specific information regarding supply mechanisms, institutional dynamics, macroeconomic influences, or technical developments related to AURORA.
For investors interested in AURORA, it is recommended to:
- Monitor official project announcements for updates on tokenomics and supply schedules
- Track on-chain data through blockchain explorers to observe holder distribution patterns
- Follow reputable crypto research platforms for ecosystem development news
- Stay informed about broader market trends that may impact altcoin performance
As more concrete data becomes available regarding AURORA's fundamentals, a more detailed analysis of price-influencing factors can be conducted.
III. 2026-2031 AURORA Price Prediction
2026 Outlook
- Conservative Forecast: $0.0346 - $0.04613
- Neutral Forecast: $0.04613
- Optimistic Forecast: $0.05628 (contingent on favorable market conditions and increased adoption)
2027-2029 Outlook
- Market Phase Expectations: The token may enter a gradual growth phase, supported by ecosystem development and broader market recovery trends
- Price Range Predictions:
- 2027: $0.04506 - $0.07322
- 2028: $0.04853 - $0.07963
- 2029: $0.04681 - $0.09433
- Key Catalysts: Enhanced network utility, strategic partnerships, and potential technological upgrades could drive price appreciation during this period
2030-2031 Long-term Outlook
- Baseline Scenario: $0.05371 - $0.12229 (assuming steady ecosystem growth and sustained market interest)
- Optimistic Scenario: $0.06455 - $0.14344 (conditional on significant protocol enhancements and widespread adoption)
- Transformative Scenario: Prices exceeding $0.14344 (requiring breakthrough developments, major institutional adoption, or substantial market expansion)
- 2026-01-21: AURORA price predictions indicate potential growth ranging from 79% to 122% by 2030-2031 compared to 2026 baseline levels
| Year |
Predicted High Price |
Predicted Average Price |
Predicted Low Price |
Price Change |
| 2026 |
0.05628 |
0.04613 |
0.0346 |
0 |
| 2027 |
0.07322 |
0.0512 |
0.04506 |
11 |
| 2028 |
0.07963 |
0.06221 |
0.04853 |
34 |
| 2029 |
0.09433 |
0.07092 |
0.04681 |
53 |
| 2030 |
0.12229 |
0.08263 |
0.05371 |
79 |
| 2031 |
0.14344 |
0.10246 |
0.06455 |
122 |
IV. AURORA Professional Investment Strategy and Risk Management
AURORA Investment Methodology
(I) Long-term Holding Strategy
- Target Investors: Investors with moderate to high risk tolerance seeking exposure to Ethereum-compatible Layer 2 solutions and NEAR Protocol ecosystem growth
- Operational Recommendations:
- Consider establishing positions during market corrections when price approaches historical support levels
- Implement dollar-cost averaging to mitigate volatility impact, given the token's significant price fluctuations
- Storage Solution: Utilize Gate Web3 Wallet for secure custody with multi-signature functionality, or consider hardware wallet integration for enhanced security
(II) Active Trading Strategy
- Technical Analysis Tools:
- Moving Averages: Monitor 50-day and 200-day moving averages to identify trend reversals, particularly relevant given AURORA's -74.91% annual decline
- Volume Analysis: Track 24-hour trading volume ($212,465) relative to market cap to assess liquidity conditions and potential breakout signals
- Swing Trading Considerations:
- Set stop-loss orders at 5-8% below entry points due to observed volatility ranges
- Monitor correlation with NEAR Protocol performance and Ethereum network developments for entry/exit timing
AURORA Risk Management Framework
(I) Asset Allocation Principles
- Conservative Investors: 1-2% of crypto portfolio allocation
- Moderate Investors: 3-5% of crypto portfolio allocation
- Aggressive Investors: Up to 10% of crypto portfolio allocation
(II) Risk Hedging Solutions
- Diversification Strategy: Balance AURORA holdings with established assets to offset ecosystem-specific risks
- Position Sizing: Limit individual position size based on the token's market cap ranking (#701) and liquidity constraints
(III) Secure Storage Solutions
- Hot Wallet Recommendation: Gate Web3 Wallet offers convenient access for active trading with multi-layer security protocols
- Cold Storage Solution: Transfer long-term holdings to hardware wallets to minimize exchange-related risks
- Security Precautions: Enable two-factor authentication, verify contract addresses (0xAaAAAA20D9E0e2461697782ef11675f668207961 on Ethereum), and avoid sharing private keys
V. AURORA Potential Risks and Challenges
AURORA Market Risks
- High Volatility: The token has experienced a 74.91% decline over the past year, indicating significant market pressure and investor sentiment challenges
- Liquidity Constraints: With 24-hour trading volume of approximately $212,465 and market cap of $31.05 million, large transactions may face slippage
- Competitive Pressure: The Layer 2 and cross-chain solution space faces intense competition, potentially impacting AURORA's market share and adoption
AURORA Regulatory Risks
- Cross-Chain Compliance: As a bridge solution between Ethereum and NEAR, regulatory developments affecting either ecosystem could impact operations
- Token Classification Uncertainty: Evolving regulatory frameworks for utility tokens may affect AURORA's trading and distribution mechanisms
- Jurisdictional Variations: Different regulatory approaches across regions may limit accessibility for certain investor groups
AURORA Technical Risks
- Smart Contract Vulnerabilities: Despite auditing processes, cross-chain bridge protocols carry inherent risks of exploits or technical failures
- Network Dependency: Performance relies on both NEAR Protocol and Ethereum network stability; issues with either could affect functionality
- Adoption Challenges: The project's success depends on sustained developer and user migration from Ethereum to the NEAR ecosystem
VI. Conclusion and Action Recommendations
AURORA Investment Value Assessment
AURORA represents a specialized infrastructure play within the NEAR Protocol ecosystem, offering Ethereum compatibility and cross-chain functionality. However, the token faces significant headwinds, as evidenced by its 74.91% annual decline and relatively low market cap ranking. Long-term value proposition depends on increased adoption of NEAR Protocol and successful execution of the Aurora platform's technical roadmap. Short-term risks include continued price volatility, limited liquidity, and competitive pressures from alternative Layer 2 solutions. The circulating supply represents 67.32% of maximum supply, suggesting moderate inflation risk.
AURORA Investment Recommendations
✅ Beginners: Start with minimal allocation (under 2% of crypto portfolio) after thorough research; utilize dollar-cost averaging to manage entry risk; prioritize understanding the underlying technology before investing
✅ Experienced Investors: Consider AURORA as a satellite position within a diversified crypto portfolio; monitor NEAR Protocol ecosystem developments and technical milestones; implement disciplined position sizing based on risk tolerance
✅ Institutional Investors: Conduct comprehensive due diligence on cross-chain bridge security; assess liquidity requirements against current trading volumes; evaluate AURORA within broader Layer 2 and infrastructure allocation strategies
AURORA Trading Participation Methods
- Spot Trading: Access AURORA markets on Gate.com with competitive trading fees and adequate liquidity for retail-sized transactions
- Systematic Investment: Implement recurring purchase plans to accumulate positions while managing volatility impact
- Portfolio Diversification: Combine AURORA holdings with complementary NEAR ecosystem tokens and established Layer 2 solutions to balance risk-reward profiles
Cryptocurrency investments carry extreme risk, and this content does not constitute investment advice. Investors should make cautious decisions based on their risk tolerance and are advised to consult professional financial advisors. Never invest more than you can afford to lose.
FAQ
What is AURORA token? What are its uses and value?
AURORA is the native token of the Aurora blockchain, an Ethereum-compatible layer-2 solution. It powers network operations, enables governance participation, and facilitates transaction fees. As Web3 adoption accelerates, AURORA's utility in scaling Ethereum transactions positions it for significant growth potential in the expanding DeFi ecosystem.
What is the historical price trend of AURORA? What are the main factors affecting price fluctuations?
AURORA has experienced volatility driven by ecosystem development, market sentiment, and broader crypto trends. Key factors include protocol upgrades, adoption metrics, DeFi activity on the network, and overall market conditions. Price movements correlate with platform innovations and investor confidence in the Aurora ecosystem's growth potential.
How to conduct technical analysis on AURORA price? What are the main support and resistance levels?
AURORA technical analysis uses candlestick patterns, moving averages, and volume analysis. Key resistance around $0.15-0.18 levels, with support at $0.08-0.10. Monitor RSI and MACD for momentum confirmation. Trading volume trends help validate price movements and breakout reliability.
2024-2025 AURORA Price Prediction: What do experts think? What risk factors exist?
Experts predict AURORA could reach $0.50-$0.80 by late 2025, driven by ecosystem growth and partnerships. Key risks include market volatility, regulatory changes, and competition from other Layer 2 solutions. Monitor network adoption and developer activity for price direction.
What are the advantages and disadvantages of AURORA compared to other Layer2 or ecosystem tokens such as NEAR and Polygon?
AURORA advantages: optimized for NEAR ecosystem integration, lower gas fees, faster transactions. Disadvantages: smaller ecosystem compared to Polygon, less developer adoption than Ethereum Layer2 solutions, lower liquidity volume.
* The information is not intended to be and does not constitute financial advice or any other recommendation of any sort offered or endorsed by Gate.