This comprehensive analysis examines AVA's price trajectory from 2026 to 2031, providing professional forecasts for Travala.com's native utility token. Currently trading at $0.3475 with a $24.69 million market capitalization, AVA serves the cryptocurrency-friendly travel ecosystem. The article analyzes historical price evolution, current market sentiment during extreme fear conditions, and token holding concentration. Price predictions range from conservative estimates of $0.2955-$0.3476 in 2026 to optimistic scenarios reaching $0.7000-$0.8063 by 2031. Key sections cover investment methodologies including long-term holding and active trading strategies, comprehensive risk management frameworks, and potential challenges from regulatory and technical factors. Designed for investors seeking actionable insights on AVA trading opportunities via Gate exchange, balancing growth potential against documented market volatility and liquidity considerations.
Introduction: AVA's Market Position and Investment Value
AVA (AVA), as a native cryptocurrency within the Travala travel booking ecosystem, has been serving the cryptocurrency-friendly travel industry since its inception in 2017. As of 2026, AVA has achieved a market capitalization of approximately $24.69 million, with a circulating supply of around 71.06 million tokens, maintaining a price level near $0.3475. This asset, recognized as a "utility token bridging crypto and travel services", is playing an increasingly vital role in the decentralized travel booking sector and cryptocurrency payment adoption.
This article will comprehensively analyze AVA's price trajectory from 2026 to 2031, combining historical patterns, market supply-demand dynamics, ecosystem development, and macroeconomic conditions to provide investors with professional price forecasts and practical investment strategies.
I. AVA Price History Review and Market Status
AVA Historical Price Evolution Trajectory
- 2019: AVA reached its all-time low price of $0.01218947 on February 27, marking the token's lowest valuation point in its trading history
- 2021: The token experienced significant growth momentum, reaching its all-time high of $6.45 on April 14, representing a substantial appreciation from its historical low
- 2025-2026: Following broader market corrections, AVA has experienced notable price adjustments, with the current price stabilizing around $0.3475
AVA Current Market Status
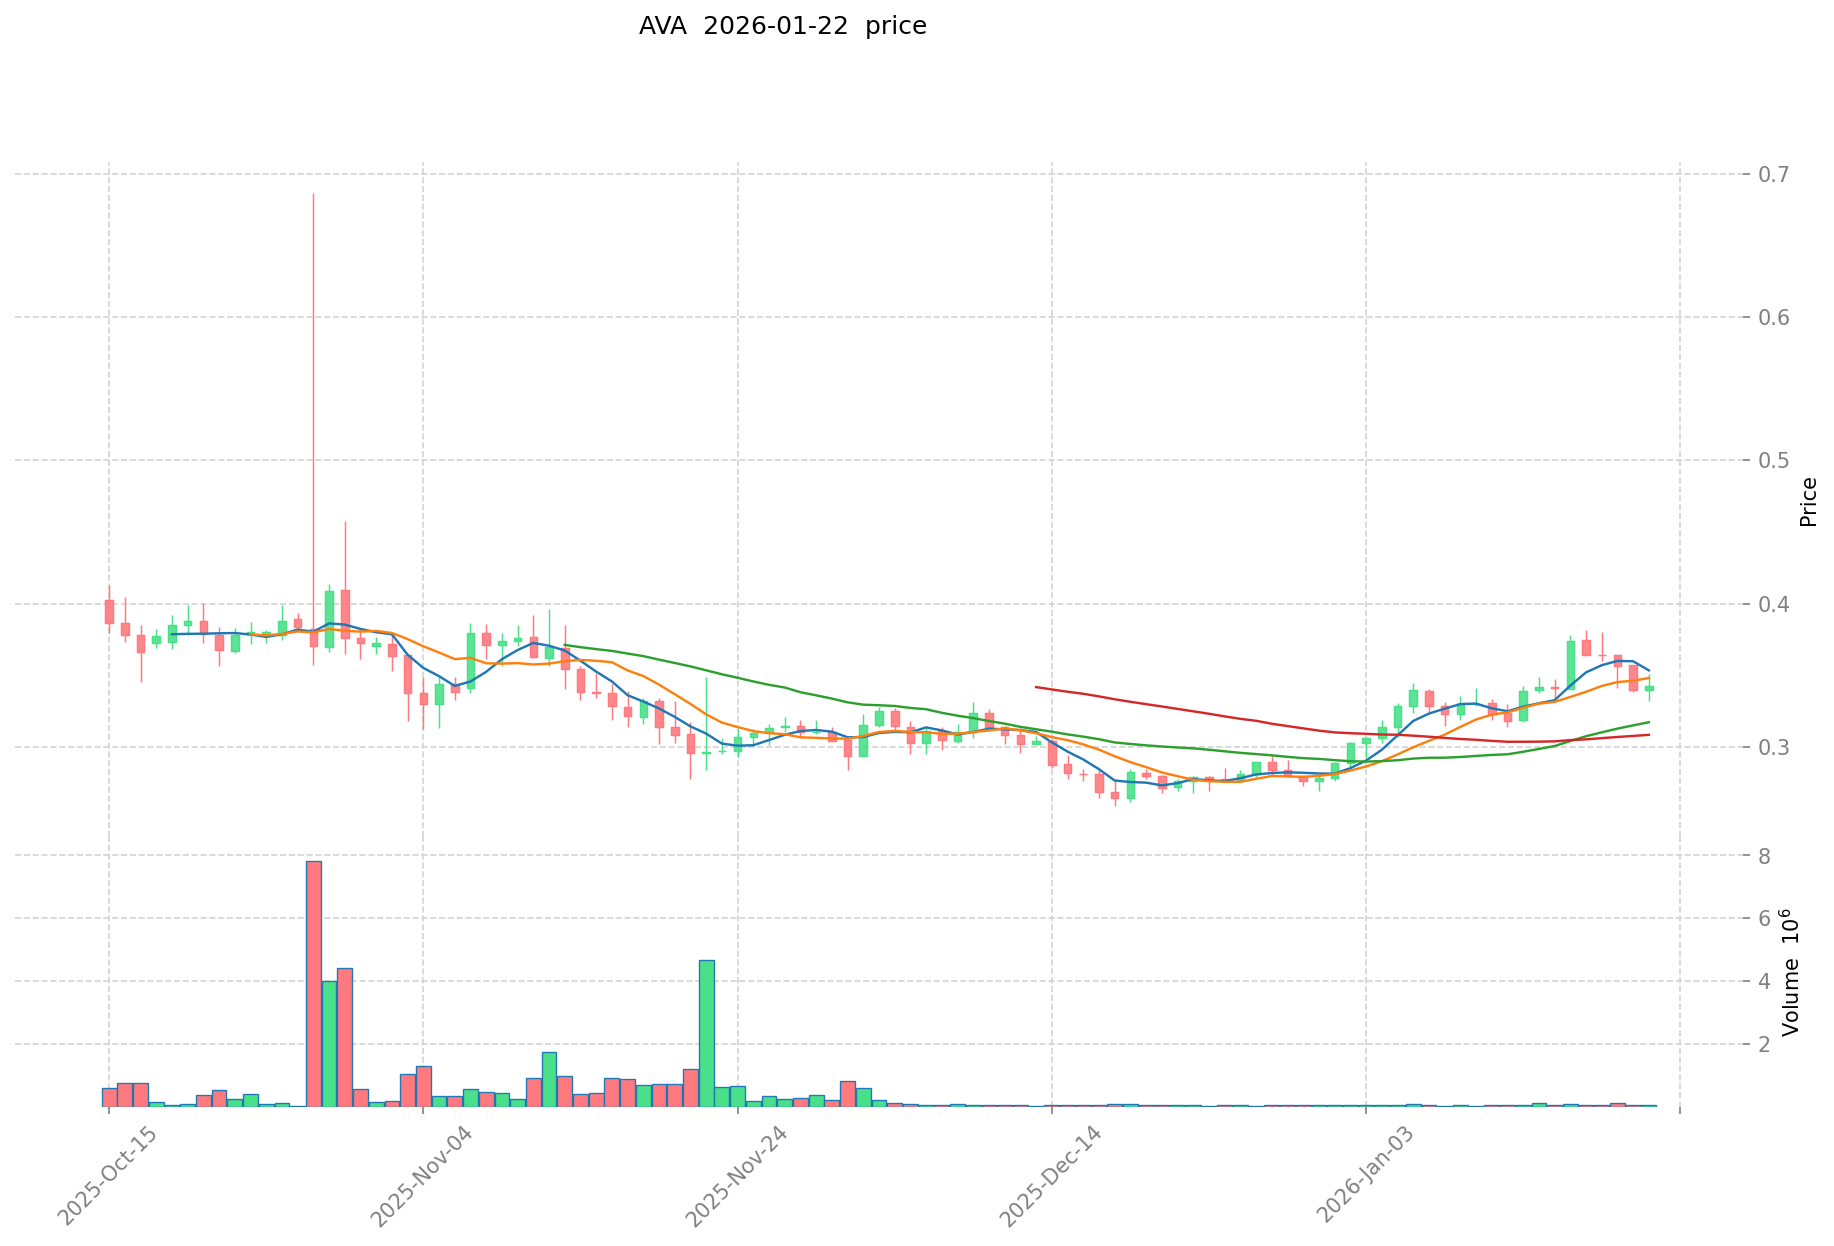
As of January 22, 2026, AVA is trading at $0.3475, with a 24-hour trading volume of $25,662.78. The token demonstrates modest short-term price movement, showing a 0.35% increase over the past hour and a 0.2% gain in the last 24 hours. The 24-hour price range spans from $0.3319 to $0.3512.
Over extended timeframes, AVA exhibits mixed performance. The token has gained 2.21% over the past week and shows a more substantial 25.62% increase over the 30-day period. However, the one-year performance reflects a decline of 63.21%, indicating significant volatility in line with broader cryptocurrency market trends.
AVA currently holds a market capitalization of approximately $24.69 million, ranking #784 among cryptocurrencies with a market dominance of 0.00077%. The circulating supply stands at 71,055,612 AVA tokens, representing 71.06% of the maximum supply of 100,000,000 tokens. The token is listed on 20 exchanges and has approximately 3,092 holders.
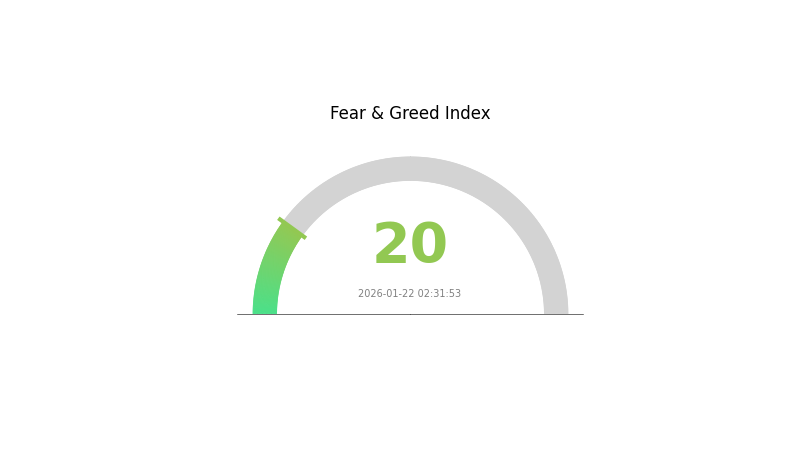
AVA is deployed across multiple blockchain networks, with contract addresses on both Ethereum (0xa6c0c097741d55ecd9a3a7def3a8253fd022ceb9) and Binance Smart Chain (0xd9483EA7214FCfd89B4Fb8f513B544920E315A52). The current market sentiment index registers at 20, indicating "Extreme Fear" conditions in the broader cryptocurrency market environment.
Click to view current AVA market price
AVA Market Sentiment Indicator
2026-01-22 Fear and Greed Index: 20 (Extreme Fear)
Click to view current Fear & Greed Index
The cryptocurrency market is currently experiencing extreme fear, with the Fear and Greed Index dropping to 20. This significant decline reflects heightened market anxiety and risk aversion among investors. During periods of extreme fear, market volatility typically intensifies as traders reassess positions. However, such extreme sentiment often presents opportunities for contrarian investors seeking entry points. Market participants should remain vigilant, conduct thorough analysis, and consider their risk tolerance before making investment decisions during this volatile period.
AVA Token Holding Distribution
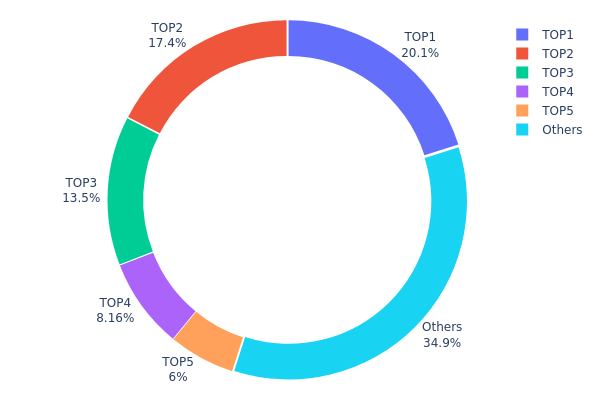
The token holding distribution chart illustrates the concentration of AVA tokens across different wallet addresses, providing insights into the decentralization level and potential market control dynamics. By analyzing the proportion of tokens held by top addresses versus the broader holder base, we can assess the risk of price manipulation and the overall health of the token's distribution structure.
According to the current data, the top five addresses collectively control approximately 65.11% of the total AVA supply, with the largest single address holding 20.09% (14.28 million tokens). The second and third-largest addresses hold 17.43% and 13.45% respectively, while the remaining addresses outside the top five account for only 34.89% of total supply. This distribution pattern reveals a relatively high concentration level, where a small number of entities possess significant market influence.
Such concentrated holding structure presents both opportunities and risks for the AVA ecosystem. On one hand, large holders may represent institutional investors or project treasury wallets that provide stability and long-term commitment to the project. On the other hand, this concentration increases the potential for coordinated market movements, as the top three addresses alone control over 50% of the circulating supply. Any significant selling pressure from these major holders could trigger substantial price volatility, while their accumulation behavior might signal strong confidence in the project's future prospects. This holding pattern suggests that while AVA maintains basic operational functionality, its decentralization level remains moderate, requiring careful monitoring of large address activities to anticipate potential market shifts.
Click to view current AVA Holding Distribution
| Top |
Address |
Holding Qty |
Holding (%) |
| 1 |
0x5a52...70efcb |
14280.00K |
20.09% |
| 2 |
0xf977...41acec |
12388.63K |
17.43% |
| 3 |
0x259a...2de7d4 |
9563.97K |
13.45% |
| 4 |
0x20bc...d3da16 |
5796.13K |
8.15% |
| 5 |
0xd948...315a52 |
4261.10K |
5.99% |
| - |
Others |
24765.79K |
34.89% |
II. Core Factors Affecting AVA's Future Price
Based on the available information, there is currently insufficient data to provide a comprehensive analysis of the core factors that may influence AVA's future price movements. Key areas such as supply mechanisms, institutional holdings, macroeconomic conditions, and technical developments require more detailed information to generate meaningful insights.
Investors interested in AVA should conduct thorough research and monitor official project announcements, market data, and broader cryptocurrency market trends to make informed decisions.
III. 2026-2031 AVA Price Prediction
2026 Outlook
- Conservative Forecast: $0.2955 - $0.3476
- Neutral Forecast: $0.3476
- Optimistic Forecast: $0.3963 (dependent on favorable market conditions and increased adoption)
2027-2029 Outlook
- Market Stage Expectations: The token may experience gradual growth as the project continues to develop its ecosystem and expand its user base. During this period, AVA is anticipated to undergo moderate volatility with potential upward momentum driven by technological advancements and strategic partnerships.
- Price Range Predictions:
- 2027: $0.3199 - $0.4240
- 2028: $0.3224 - $0.5651
- 2029: $0.3226 - $0.5827
- Key Catalysts: The primary drivers for price appreciation during this phase may include platform upgrades, increased network activity, broader market recovery cycles, and enhanced utility features that attract more participants to the ecosystem.
2030-2031 Long-term Outlook
- Baseline Scenario: $0.4000 - $0.5500 (assuming steady project development and moderate market conditions)
- Optimistic Scenario: $0.5500 - $0.7000 (contingent on significant ecosystem expansion and favorable regulatory environment)
- Transformative Scenario: $0.7000 - $0.8063 (under exceptionally favorable conditions including mass adoption and breakthrough technological implementations)
- 2026-01-22: AVA is currently positioned at the initial phase of this forecast period, with potential for progressive value appreciation over the coming years as the project matures and market dynamics evolve.
| Year |
Predicted High Price |
Predicted Average Price |
Predicted Low Price |
Price Change |
| 2026 |
0.39626 |
0.3476 |
0.29546 |
0 |
| 2027 |
0.424 |
0.37193 |
0.31986 |
7 |
| 2028 |
0.56511 |
0.39797 |
0.32235 |
14 |
| 2029 |
0.58266 |
0.48154 |
0.32263 |
38 |
| 2030 |
0.57999 |
0.5321 |
0.27137 |
53 |
| 2031 |
0.80627 |
0.55605 |
0.52268 |
60 |
IV. AVA Professional Investment Strategies and Risk Management
AVA Investment Methodology
(1) Long-term Holding Strategy
- Suitable for: Investors with moderate to high risk tolerance who believe in the future of crypto-friendly travel booking platforms
- Operational Recommendations:
- Accumulate AVA tokens gradually during market dips to reduce average cost
- Monitor Travala.com platform adoption metrics and partnership announcements
- Store tokens securely using Gate Web3 Wallet for convenient access to staking rewards and platform benefits
(2) Active Trading Strategy
- Technical Analysis Tools:
- Moving Averages: Use 50-day and 200-day moving averages to identify trend directions and potential entry/exit points
- Relative Strength Index (RSI): Monitor RSI levels to identify overbought (above 70) or oversold (below 30) conditions
- Swing Trading Key Points:
- Watch for breakouts above resistance levels near the current price range
- Set stop-loss orders to manage downside risk, particularly given the token's historical volatility
AVA Risk Management Framework
(1) Asset Allocation Principles
- Conservative Investors: 1-3% of crypto portfolio
- Aggressive Investors: 5-10% of crypto portfolio
- Professional Investors: Up to 15% of crypto portfolio, with active hedging strategies
(2) Risk Hedging Solutions
- Portfolio Diversification: Combine AVA with other travel and hospitality-related tokens to reduce sector-specific risk
- Stablecoin Pairing: Maintain a portion of portfolio in stablecoins to quickly capitalize on price corrections
(3) Secure Storage Solutions
- Hot Wallet Recommendation: Gate Web3 Wallet for active trading and immediate access to platform features
- Cold Storage Solution: Hardware wallets for long-term holdings exceeding investment thresholds
- Security Precautions: Enable two-factor authentication, never share private keys, and regularly update wallet software to protect against vulnerabilities
V. AVA Potential Risks and Challenges
AVA Market Risks
- Price Volatility: AVA has experienced significant price fluctuations, with a 63.21% decline over the past year, indicating substantial volatility that may continue
- Liquidity Concerns: With a 24-hour trading volume of approximately 25,662 USDT, liquidity may be limited compared to larger-cap tokens, potentially impacting execution prices
- Market Cap Position: Ranked 784 by market capitalization, AVA faces competition from numerous projects and may struggle to gain mainstream attention
AVA Regulatory Risks
- Travel Industry Regulations: Changes in travel booking regulations or restrictions on crypto payments in key markets could negatively impact Travala.com's business model
- Cryptocurrency Payment Compliance: Increasing regulatory scrutiny on crypto payment systems may require additional compliance measures that could affect operational costs
- Cross-border Transaction Oversight: International travel transactions using cryptocurrency may face varying regulatory treatment across different jurisdictions
AVA Technical Risks
- Multi-chain Dependency: AVA operates on both Ethereum and BSC chains, exposing it to potential vulnerabilities or network disruptions on either platform
- Smart Contract Vulnerabilities: As with all token projects, undiscovered bugs or security flaws in smart contracts could lead to potential exploits
- Platform Integration Risks: The token's utility is closely tied to Travala.com's platform performance; technical issues or service disruptions could affect token demand
VI. Conclusion and Action Recommendations
AVA Investment Value Assessment
AVA represents a niche investment opportunity within the crypto-friendly travel booking sector. The token's utility on Travala.com provides real-world use cases including payment discounts and membership rewards. However, investors should note the significant price decline of 63.21% over the past year and relatively modest market capitalization. The recent 30-day performance showing 25.62% growth suggests renewed interest, but this must be weighed against long-term downtrends. The token's value proposition is closely tied to Travala.com's ability to compete in the traditional travel booking market while maintaining its crypto-payment advantages. With a circulating supply of 71.06% of max supply, tokenomics appear reasonably controlled.
AVA Investment Recommendations
✅ Beginners: Start with small allocations (1-2% of crypto portfolio) and focus on understanding the Travala.com platform's value proposition before increasing exposure
✅ Experienced Investors: Consider AVA as a speculative position within a diversified crypto portfolio, monitoring platform growth metrics and travel industry trends closely
✅ Institutional Investors: Evaluate AVA within the context of travel sector tokenization opportunities, conducting thorough due diligence on Travala.com's competitive positioning and user adoption rates
AVA Trading Participation Methods
- Spot Trading: Purchase AVA directly on Gate.com and other supported exchanges for immediate ownership and platform utility
- Dollar-Cost Averaging: Implement systematic purchase schedules to reduce timing risk and accumulate positions gradually
- Staking and Platform Rewards: Utilize AVA tokens on Travala.com to access membership benefits, earning potential rewards while maintaining exposure
Cryptocurrency investment carries extremely high risks. This article does not constitute investment advice. Investors should make prudent decisions based on their own risk tolerance and are advised to consult professional financial advisors. Never invest more than you can afford to lose.
FAQ
What is AVA token and what are its main uses?
AVA is a utility token that powers the Avalanche ecosystem, enabling network participation, staking rewards, and governance voting. It facilitates smart contract execution and transaction fees while providing holders with network security incentives and platform governance rights.
What will be the AVA price prediction for 2024? What factors will influence the price?
AVA is expected to reach $8-12 in 2024, driven by network adoption, transaction volume growth, ecosystem partnerships, and broader cryptocurrency market conditions. Developer activity and regulatory developments are key influencing factors.
What are AVA's advantages compared to other Layer 1 blockchain tokens like SOL and MATIC?
AVA offers superior scalability with higher transaction throughput, lower fees, and faster finality. Its innovative consensus mechanism enables efficient cross-chain interoperability while maintaining strong security, positioning it as a next-generation Layer 1 solution.
How to predict AVA price trends through technical analysis?
Analyze AVA's price charts using indicators like moving averages, RSI, and MACD. Monitor trading volume trends, support and resistance levels, and candlestick patterns. Track on-chain metrics and market sentiment to identify potential price movements and trend reversals.
What risks should I pay attention to when investing in AVA tokens?
AVA token investments carry market volatility, liquidity risks, and regulatory uncertainties. Price fluctuations can be significant. Research project fundamentals, diversify holdings, and only invest capital you can afford to lose.
AVA has shown strong volatility typical of emerging crypto assets. Historically, AVA experienced significant price appreciation during bull market periods, with notable rallies driven by network adoption and ecosystem development. Price corrections occurred during broader market downturns. The asset demonstrates cyclical patterns aligned with crypto market sentiment and fundamental milestone announcements.
* The information is not intended to be and does not constitute financial advice or any other recommendation of any sort offered or endorsed by Gate.