This comprehensive analysis examines B2 Network's price trajectory from 2026 to 2031, providing expert forecasts and investment strategies for Bitcoin's next-generation Layer-2 scaling solution. Currently trading at $0.8179 with a $38.35M market cap, B2 demonstrates 46.60% year-over-year growth despite market volatility. The article evaluates B2's market position, historical price evolution, and holding distribution patterns while projecting conservative ($0.51-$0.82), neutral ($0.82), and optimistic ($0.90) scenarios for 2026. Long-term outlooks span from $0.89-$1.71 baseline through $2.11 transformational scenarios by 2031. Professional investment methodologies, risk management frameworks, and trading strategies on Gate are detailed, alongside technical analysis tools and security recommendations. The analysis addresses regulatory, technical, and market risks while offering tailored recommendations for beginners, experienced traders, and institutional investors navigating B2's modular blockchain infrastruct
Introduction: B2's Market Position and Investment Value
BSquared Network (B2), as a modular Bitcoin scaling solution, has been making strides in the blockchain ecosystem since its launch in 2025. As of January 20, 2026, B2 has achieved a market capitalization of approximately $38.35 million, with a circulating supply of around 46.89 million tokens, and the price maintaining at approximately $0.8179. This asset, recognized as an innovative Bitcoin Layer-2 solution, is playing an increasingly vital role in enhancing Bitcoin's scalability and functionality through its zero-knowledge proof-based rollup technology and data availability layer.
This article will comprehensively analyze B2's price trends from 2026 to 2031, combining historical patterns, market supply and demand dynamics, ecosystem development, and macroeconomic environment factors to provide investors with professional price forecasts and practical investment strategies.
I. B2 Price History Review and Current Market Status
Historical Price Evolution of B2
- 2025: B2 token experienced significant volatility throughout the year, with price reaching a notable level of $2.2184 in October 2025, followed by a correction phase in the subsequent months
- 2025: The token recorded its lowest price point at $0.3154 in June 2025, reflecting early-stage market uncertainty and initial trading dynamics
- 2025-2026: Market performance showed recovery momentum, with the token price demonstrating an upward trajectory of approximately 46.60% over the past year period
Current Market Dynamics of B2
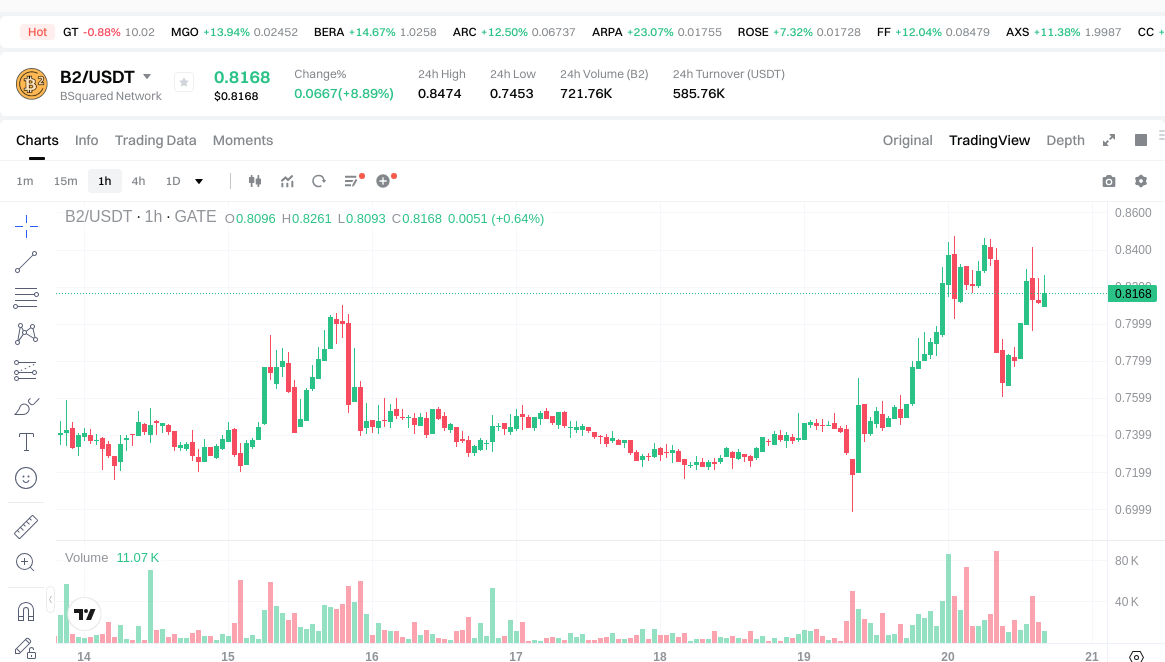
As of January 20, 2026, B2 is trading at $0.8179, representing a 7.71% increase over the past 24 hours. The token has demonstrated positive short-term momentum, with a 7-day price appreciation of 8.79%. However, the 30-day performance indicates a decline of 7.09%, suggesting some recent consolidation in market activity.
The 24-hour trading volume stands at approximately $587,093, with the token reaching an intraday high of $0.8474 and a low of $0.7453. B2's current market capitalization is approximately $38.35 million, with a circulating supply of 46.89 million tokens out of a maximum supply of 210 million tokens, resulting in a circulation ratio of 22.33%.
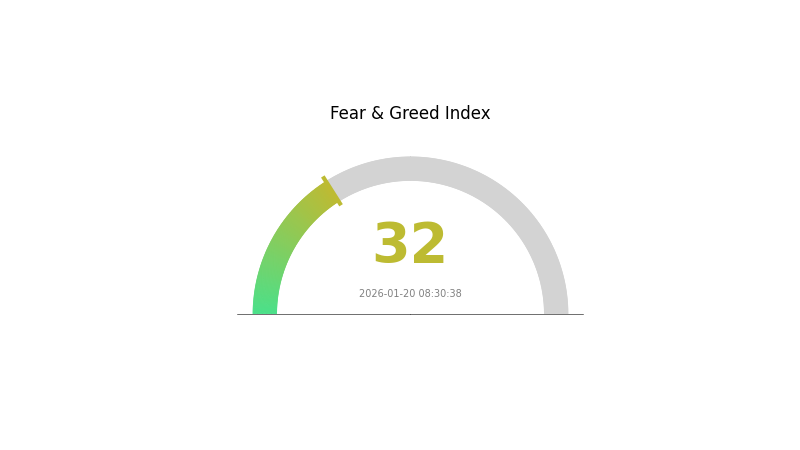
The fully diluted market cap is estimated at $171.76 million, and the token maintains a market dominance of 0.0053%. B2 currently ranks #618 in the cryptocurrency market by market capitalization. The project has attracted 29,978 token holders and is listed on 18 exchanges. According to the current market sentiment index, the fear and greed index stands at 32, indicating a "Fear" sentiment in the broader market.
Click to view the current B2 market price
B2 Market Sentiment Indicator
2026-01-20 Fear and Greed Index: 32 (Fear)
Click to view current Fear & Greed Index
The cryptocurrency market is currently experiencing a fear sentiment with an index reading of 32. This indicates heightened market anxiety and risk aversion among investors. During periods of fear, market volatility tends to increase as participants become more cautious about their positions. Savvy traders often view such sentiment extremes as potential opportunities, as excessive fear can sometimes precede market reversals. However, it's important to maintain a disciplined approach and conduct thorough analysis before making trading decisions. Monitor key support and resistance levels closely during this uncertain phase.
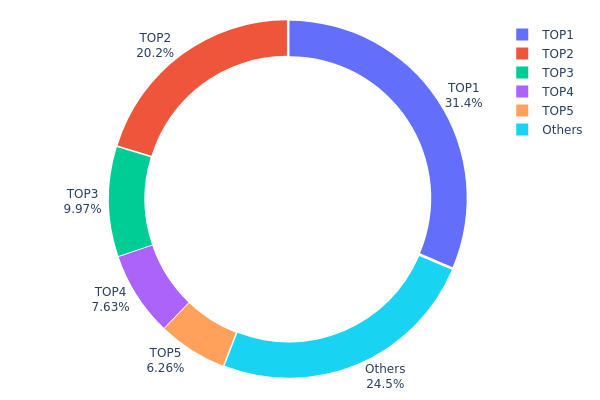
B2 Holding Distribution
The holding distribution chart reveals the allocation of B2 tokens across different wallet addresses, serving as a critical indicator of decentralization and market structure. According to the latest on-chain data, the top address holds 65,099.76K B2 tokens, representing 31.38% of the total supply, while the second-largest holder controls 42,000.00K tokens (20.24%). The top five addresses collectively account for 75.48% of the circulating supply, indicating a relatively high degree of concentration. This distribution pattern suggests that B2's token allocation remains dominated by a small number of large holders, which may pose challenges to its decentralization goals.
The current concentration level presents both structural risks and potential advantages for B2's market dynamics. On one hand, the significant holdings by top addresses could provide stability during market volatility, as these large holders typically have long-term investment horizons and are less likely to engage in panic selling. On the other hand, such concentration creates vulnerability to price manipulation and increases the risk of sudden liquidity shocks if major holders decide to liquidate their positions. The relatively small "Others" category at 24.52% suggests limited retail participation, which could affect price discovery mechanisms and overall market depth.
From a market structure perspective, this distribution pattern reflects B2's current stage of development and adoption. The presence of large institutional or early-stage investors controlling substantial portions of the supply is common in emerging blockchain projects, but it warrants careful monitoring as the ecosystem matures. Moving forward, a gradual dispersion of holdings toward a broader base of participants would be favorable for enhancing market resilience and reducing centralization risks.
Click to view current B2 Holding Distribution
| Top |
Address |
Holding Qty |
Holding (%) |
| 1 |
0xa8fa...307120 |
65099.76K |
31.38% |
| 2 |
0xa8ca...6fc67c |
42000.00K |
20.24% |
| 3 |
0x1488...27c95f |
20685.00K |
9.97% |
| 4 |
0x69c2...2dc3ce |
15834.00K |
7.63% |
| 5 |
0xc882...84f071 |
12987.00K |
6.26% |
| - |
Others |
50838.83K |
24.52% |
II. Core Factors Influencing B2's Future Price
Based on the currently available information, there is insufficient data to provide a comprehensive analysis of the core factors that may influence B2's future price. The reference materials do not contain specific details regarding supply mechanisms, institutional holdings, macroeconomic conditions, or technical developments related to B2.
A thorough price analysis would typically require information on tokenomics, major stakeholder activities, regulatory developments, and ecosystem growth metrics. Without access to this fundamental data, it would be inappropriate to make speculative claims about potential price drivers.
For accurate and actionable insights into B2's price outlook, readers are encouraged to monitor official project announcements, verified on-chain data, and market sentiment indicators as they become available.
III. 2026-2031 B2 Price Forecast
2026 Outlook
- Conservative forecast: $0.51 - $0.82
- Neutral forecast: $0.82 (average estimate)
- Optimistic forecast: $0.90 (contingent on favorable market conditions and increased adoption)
2027-2029 Outlook
- Market stage expectation: The token may enter a gradual growth phase as the broader crypto market matures and ecosystem developments gain traction.
- Price range forecast:
- 2027: $0.67 - $1.05
- 2028: $0.76 - $1.12
- 2029: $0.93 - $1.53
- Key catalysts: Potential technological upgrades, expanded utility within the ecosystem, and broader market recovery cycles could serve as primary drivers for price appreciation.
2030-2031 Long-term Outlook
- Baseline scenario: $0.89 - $1.71 (assuming steady ecosystem growth and stable market conditions)
- Optimistic scenario: $1.29 - $2.11 (contingent on accelerated adoption, strategic partnerships, and favorable regulatory developments)
- Transformational scenario: Potential to approach $2.11 by 2031 (under exceptionally favorable conditions including mass adoption and significant technological breakthroughs)
- 2026-01-20: B2 shows potential for long-term appreciation based on current forecast models
| Year |
Predicted High Price |
Predicted Average Price |
Predicted Low Price |
Price Change |
| 2026 |
0.89749 |
0.8159 |
0.51402 |
0 |
| 2027 |
1.04517 |
0.8567 |
0.66822 |
4 |
| 2028 |
1.1221 |
0.95093 |
0.76075 |
16 |
| 2029 |
1.53404 |
1.03652 |
0.93286 |
26 |
| 2030 |
1.70942 |
1.28528 |
0.88684 |
57 |
| 2031 |
2.11126 |
1.49735 |
1.39254 |
83 |
IV. B2 Professional Investment Strategies and Risk Management
B2 Investment Methodology
(1) Long-term Holding Strategy
- Target Investors: Investors with moderate to high risk tolerance who believe in Bitcoin Layer-2 scaling solutions and modular blockchain infrastructure
- Operational Recommendations:
- Consider accumulating B2 tokens during market corrections, as the token has demonstrated resilience with a 46.60% gain over the past year
- Monitor the project's development milestones, particularly updates to B² Rollup and B² Hub infrastructure
- Storage Solution: Use Gate Web3 Wallet for secure custody, which supports BEP-20 tokens and provides enhanced security features for long-term storage
(2) Active Trading Strategy
- Technical Analysis Tools:
- Volume Analysis: Current 24-hour trading volume of $587,093.85 indicates moderate liquidity; traders should monitor volume spikes that may signal trend changes
- Support and Resistance Levels: Recent 24-hour range between $0.7453 (low) and $0.8474 (high) provides reference points for short-term trading decisions
- Swing Trading Key Points:
- The token has shown positive momentum with 7.71% gain in 24 hours and 8.79% gain over 7 days, suggesting potential short-term trading opportunities
- Set stop-loss orders to manage downside risk, particularly given the 30-day decline of 7.09%
B2 Risk Management Framework
(1) Asset Allocation Principles
- Conservative Investors: 1-3% of crypto portfolio
- Aggressive Investors: 5-10% of crypto portfolio
- Professional Investors: Up to 15% of crypto portfolio, with active hedging strategies
(2) Risk Hedging Solutions
- Portfolio Diversification: Balance B2 holdings with established cryptocurrencies and other Layer-2 solutions to reduce concentration risk
- Position Sizing: Implement dollar-cost averaging strategy to mitigate entry timing risk, particularly given the token's volatility
(3) Secure Storage Solutions
- Hot Wallet Recommendation: Gate Web3 Wallet for convenient trading and staking access while maintaining security standards
- Cold Storage Solution: For large holdings intended for long-term storage, consider hardware wallet solutions with BEP-20 compatibility
- Security Precautions: Enable two-factor authentication, regularly update wallet software, never share private keys, and verify contract addresses (0x783c3f003f172c6ac5ac700218a357d2d66ee2a2 on BSC) before transactions
V. B2 Potential Risks and Challenges
B2 Market Risks
- Price Volatility: B2 has experienced significant price fluctuations, with historical high of $2.2184 (October 2025) and low of $0.3154 (June 2025), representing substantial volatility that may result in rapid capital loss
- Liquidity Constraints: With a circulating market cap of approximately $38.35 million and presence on 18 exchanges, liquidity may be limited compared to major cryptocurrencies, potentially causing slippage during large trades
- Limited Circulation: Only 22.33% of total supply is currently circulating (46.89 million out of 210 million tokens), which creates uncertainty regarding future token releases and potential dilution effects
B2 Regulatory Risks
- Bitcoin Layer-2 Regulatory Uncertainty: As Bitcoin scaling solutions evolve, regulatory frameworks may develop differently across jurisdictions, potentially affecting B2 Network's operations and token utility
- Securities Classification Risk: Depending on jurisdictional interpretations, B2 tokens could face scrutiny regarding their classification, which may impact trading availability and compliance requirements
- Cross-border Transaction Compliance: As a modular Bitcoin scaling solution, B2 Network's cross-chain operations may face evolving regulatory requirements in different markets
B2 Technical Risks
- Smart Contract Vulnerabilities: As a BEP-20 token operating on Binance Smart Chain with zero-knowledge proof technology, potential smart contract bugs or exploits could compromise user funds or network functionality
- Adoption Risk: B2 Network's success depends on widespread adoption of its Rollup technology and Data Availability layer; slower than anticipated adoption could negatively impact token value
- Competitive Pressure: The Bitcoin Layer-2 ecosystem is rapidly evolving with multiple competing solutions, which may affect B2 Network's market position and growth trajectory
VI. Conclusion and Action Recommendations
B2 Investment Value Assessment
B2 Network represents an innovative approach to Bitcoin scalability through its modular architecture combining zero-knowledge proof Rollup technology, Data Availability layer, and mining pool integration. The project addresses genuine infrastructure needs within the Bitcoin ecosystem. However, investors should recognize the early-stage nature of the project, with only 22.33% token circulation and a relatively modest market capitalization of $38.35 million. While the 46.60% year-over-year price increase demonstrates market interest, the recent 30-day decline of 7.09% and historical volatility (ranging from $0.3154 to $2.2184) underscore the significant risks involved. Long-term value proposition depends on successful technology adoption and ecosystem development, while short-term price action may remain volatile.
B2 Investment Recommendations
✅ Beginners: Start with minimal allocation (1-2% of crypto portfolio) and focus on education about Bitcoin Layer-2 solutions before increasing exposure; use Gate Web3 Wallet for secure storage and consider dollar-cost averaging to reduce timing risk
✅ Experienced Investors: Allocate 3-7% of crypto portfolio based on conviction in Bitcoin scaling infrastructure; actively monitor project development milestones and adjust positions based on technical and fundamental developments
✅ Institutional Investors: Conduct comprehensive due diligence on technology architecture and team credentials; consider strategic allocation of 5-10% within Layer-2 sector exposure, with appropriate hedging strategies and compliance frameworks
B2 Trading Participation Methods
- Spot Trading: B2 is available on Gate.com and 17 other exchanges, providing multiple venues for spot trading with varying liquidity profiles
- Gate.com Platform: Access comprehensive trading pairs, advanced charting tools, and competitive fee structures through Gate.com's user-friendly interface
- Web3 Integration: Utilize Gate Web3 Wallet for seamless interaction with B2 Network's ecosystem and participate in potential staking or governance opportunities as they become available
Cryptocurrency investment carries extremely high risks, and this article does not constitute investment advice. Investors should make cautious decisions based on their own risk tolerance and are advised to consult professional financial advisors. Never invest more than you can afford to lose.
FAQ
What are the main factors influencing B2 price predictions?
B2 price predictions are primarily influenced by market demand and transaction volume, network development progress, overall cryptocurrency market sentiment, Bitcoin price trends, and regulatory changes in the Web3 sector.
How to use technical analysis to predict B2 price trends?
Analyze B2's candlestick patterns, moving averages, and RSI indicators. Monitor trading volume and support/resistance levels. Use trend lines and MACD for momentum confirmation. Cross-reference multiple timeframes for stronger signals.
B2 has shown volatile growth since launch, with significant rallies during bull markets and corrections during downturns. Price typically correlates with network adoption and transaction volume growth. Long-term trend remains bullish with higher lows, suggesting sustained ecosystem development momentum.
What are professional institutions' predictions for B2's future price?
Major crypto analysts project B2 could reach $50-100 range by 2027, driven by increased adoption of decentralized infrastructure and growing market demand. However, predictions vary based on market conditions and ecosystem development.
What are common risks and misconceptions in B2 price predictions?
Common risks include over-relying on historical data, ignoring market volatility and black swan events, emotional trading decisions, and misinterpreting technical indicators. Misconceptions involve believing predictions guarantee profits, underestimating macro factors, and neglecting fundamental analysis of B2 ecosystem developments.
How does B2 price prediction difficulty compare to similar assets?
B2 demonstrates moderate prediction difficulty among comparable assets. Its price movements are influenced by market sentiment, trading volume, and protocol developments. Strong liquidity and consistent adoption patterns make B2 relatively more predictable than emerging tokens, though macro conditions remain a key variable.
What time period for B2 price prediction is more reliable, short-term or long-term?
Long-term B2 price predictions tend to be more reliable. Short-term predictions are heavily influenced by market volatility and sentiment swings, making accuracy difficult. Long-term forecasts benefit from fundamental analysis of B2's ecosystem development, adoption trends, and market maturation, providing better predictive stability and more dependable insights for investors.
* The information is not intended to be and does not constitute financial advice or any other recommendation of any sort offered or endorsed by Gate.