Balancer (BAL) token analysis provides comprehensive price forecasting and investment strategy for 2026-2031. This guide examines BAL's market position as a pioneering automated market maker protocol, currently trading near $0.50 with $32.17 million market capitalization. The article reviews historical price evolution from $74.45 peak in 2021 to current extreme fear market sentiment (Fear & Greed Index: 24). Detailed predictions span from conservative 2026 outlook ($0.35-$0.50) through optimistic 2031 scenarios reaching $1.05. Core analysis covers market dynamics, tokenomics, holding distribution, and competitive positioning. Professional investment strategies address long-term holding and active trading approaches via Gate exchange, while comprehensive risk management framework guides asset allocation from 1-8% based on investor profile. Risk assessment includes market volatility, liquidity concerns, regulatory uncertainties, and technical vulnerabilities. Actionable recommendations suit beginners through in
Introduction: BAL's Market Position and Investment Value
Balancer (BAL), as a pioneering automated market maker protocol with self-balancing properties, has established itself as an innovative force in decentralized finance since its launch in 2020. The protocol revolutionizes the traditional index fund concept by enabling users to create weighted portfolios while earning fees from traders who rebalance through arbitrage opportunities. As of 2026, BAL maintains a market capitalization of approximately $32.17 million, with a circulating supply of around 64.58 million tokens, and the current price hovering near $0.50. This asset, recognized as a foundational protocol in the DeFi liquidity infrastructure, continues to play an increasingly vital role in facilitating decentralized trading and portfolio management.
This article will comprehensively analyze BAL's price trajectory from 2026 to 2031, combining historical patterns, market supply and demand dynamics, ecosystem development, and macroeconomic conditions to provide investors with professional price forecasts and practical investment strategies.
I. BAL Price History Review and Market Status
BAL Historical Price Evolution Trajectory
- 2021: Balancer reached a significant milestone with BAL price hitting $74.45 on May 4, marking its all-time high during the DeFi summer boom period
- 2022-2025: The token experienced substantial volatility aligned with broader crypto market cycles, gradually declining from previous peaks
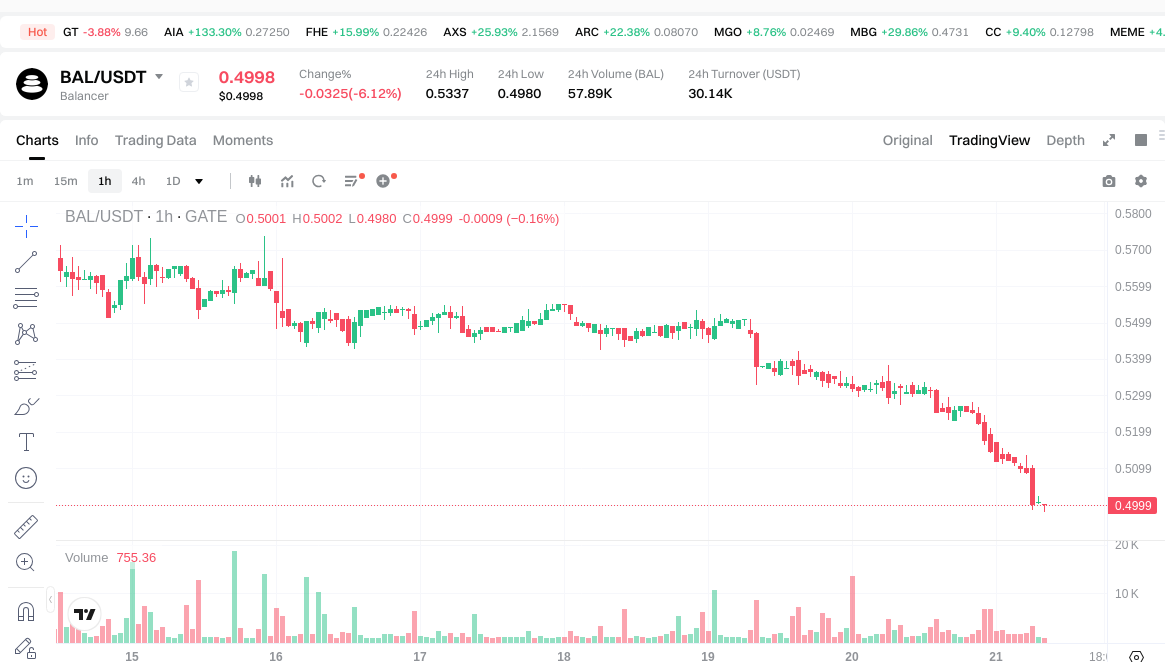
- 2026: On January 21, BAL approached its all-time low at approximately $0.499712, representing a decline of over 99% from its historical peak
BAL Current Market Situation
As of January 21, 2026, BAL is trading at $0.4982, showing a 24-hour decrease of 6.44%. The token has experienced downward pressure across multiple timeframes, with a 1-hour decline of 0.38%, a 7-day decrease of 11.74%, and a 30-day drop of 20.64%. Over the past year, BAL has declined by 81.53%.
The 24-hour trading range shows BAL fluctuating between $0.498 and $0.5337, with a total trading volume of $30,171.20. The current market capitalization stands at approximately $32.17 million, representing a market dominance of 0.0011%.
Balancer's circulating supply is 64,580,537 BAL tokens, accounting for 67.17% of the total supply of 71,290,016 tokens. The maximum supply is capped at 96,150,704 BAL. The market cap to fully diluted valuation ratio stands at 67.17%, with the fully diluted market cap at approximately $35.52 million.
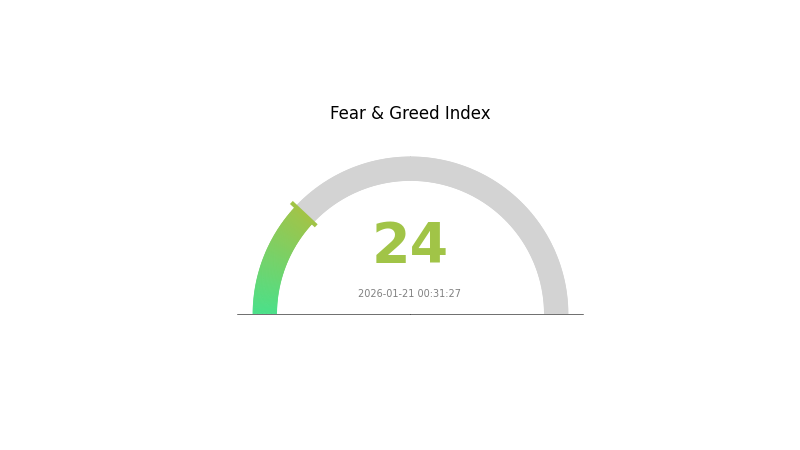
The token is held by 48,563 addresses and is available for trading on 16 exchanges. Current market sentiment indicators show a Fear & Greed Index of 24, reflecting "Extreme Fear" conditions in the cryptocurrency market.
BAL operates as an ERC-20 token on the Ethereum blockchain, with its contract address being 0xba100000625a3754423978a60c9317c58a424e3D. The project serves as the governance and utility token for the Balancer Protocol, an automated market maker that enables self-balancing weighted portfolios and price sensors.
Click to view current BAL market price
BAL Market Sentiment Index
2026-01-21 Fear and Greed Index: 24 (Extreme Fear)
Click to view current Fear & Greed Index
The crypto market is currently experiencing extreme fear, with the Fear and Greed Index standing at 24. This indicates significant market anxiety and pessimistic sentiment among investors. During periods of extreme fear, opportunities often emerge for contrarian traders. However, exercise caution and conduct thorough research before making investment decisions. Market volatility remains elevated, and risk management is essential. Monitor market developments closely and consider your risk tolerance when positioning your portfolio.
BAL 持仓分布
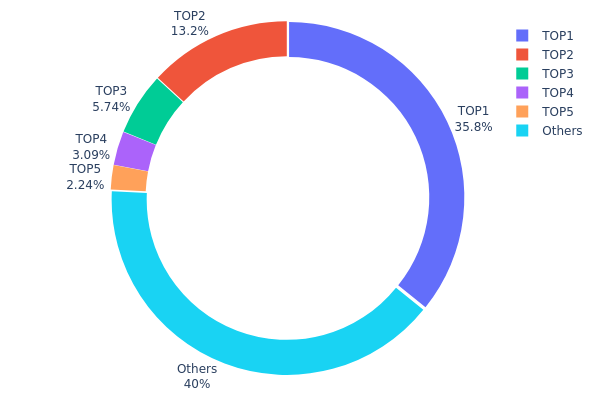
The address holding distribution chart illustrates the allocation of BAL tokens across different wallet addresses, providing crucial insights into the token's decentralization level and market structure. This metric serves as a key indicator for assessing potential concentration risks and the overall health of the token's on-chain ecosystem.
Based on the current data, BAL exhibits a moderately concentrated holding pattern. The top address controls 35.79% of the total supply (25.52 million tokens), while the second-largest holder accounts for 13.16% (9.38 million tokens). Combined, the top five addresses hold approximately 60.02% of the circulating supply, leaving 39.98% distributed among smaller holders. This concentration level suggests that a significant portion of BAL's supply remains under the control of major stakeholders, which could include the protocol treasury, liquidity pools, or institutional investors.
Such distribution characteristics present both opportunities and risks for market participants. On one hand, the dominance of large holders may indicate strong institutional confidence and long-term commitment to the protocol's development. On the other hand, this concentration creates potential vulnerability to large-scale sell pressure if major holders decide to liquidate positions. The relatively substantial portion held by "Others" (39.98%) does provide some cushion against extreme centralization, suggesting a reasonably active community of smaller holders that could help stabilize market dynamics during volatile periods.
Click to view current BAL Holdings Distribution
| Top |
Address |
Holding Qty |
Holding (%) |
| 1 |
0xba12...6bf2c8 |
25521.41K |
35.79% |
| 2 |
0x2516...436fb8 |
9382.84K |
13.16% |
| 3 |
0x0ec5...17faa8 |
4094.58K |
5.74% |
| 4 |
0x0efc...32fc89 |
2206.28K |
3.09% |
| 5 |
0xb129...3b20eb |
1599.05K |
2.24% |
| - |
Others |
28485.64K |
39.98% |
II. Core Factors Influencing BAL's Future Price
Based on the available information, there is insufficient data to provide a comprehensive analysis of the core factors that may influence BAL's future price. The reference materials do not contain specific information regarding supply mechanisms, institutional holdings, macroeconomic correlations, or technical developments for this asset.
For accurate price analysis and forecasting, detailed information about tokenomics, market dynamics, technological roadmap, and ecosystem development would be necessary. Investors are advised to conduct thorough research and consult multiple verified sources before making investment decisions.
You can track BAL's real-time price movements and trading activity on Gate.com to stay updated with market developments.
III. 2026-2031 BAL Price Prediction
2026 Outlook
- Conservative Prediction: $0.35365 - $0.4981
- Neutral Prediction: $0.4981
- Optimistic Prediction: $0.5778 (requiring favorable market conditions and increased DeFi adoption)
2027-2029 Outlook
- Market Stage Expectation: The market may enter a gradual recovery phase with increasing institutional interest in DeFi protocols and liquidity solutions
- Price Range Prediction:
- 2027: $0.44112 - $0.55947
- 2028: $0.36763 - $0.74624
- 2029: $0.5633 - $0.87409
- Key Catalysts: Expansion of liquidity pool mechanisms, potential protocol upgrades, and broader acceptance of decentralized exchange infrastructure
2030-2031 Long-term Outlook
- Baseline Scenario: $0.59341 - $1.05749 (assuming steady growth in DeFi market share and protocol adoption)
- Optimistic Scenario: $0.76078 - $0.98187 (with enhanced protocol features and increased trading volume)
- Transformative Scenario: Up to $1.05749 (under conditions of widespread DeFi integration and significant ecosystem expansion)
- 2026-01-21: BAL trading within the predicted range of $0.35365 - $0.5778 (reflecting current market positioning)
| Year |
Predicted High Price |
Predicted Average Price |
Predicted Low Price |
Price Change |
| 2026 |
0.5778 |
0.4981 |
0.35365 |
0 |
| 2027 |
0.55947 |
0.53795 |
0.44112 |
7 |
| 2028 |
0.74624 |
0.54871 |
0.36763 |
10 |
| 2029 |
0.87409 |
0.64747 |
0.5633 |
29 |
| 2030 |
1.05749 |
0.76078 |
0.59341 |
52 |
| 2031 |
0.98187 |
0.90913 |
0.61821 |
82 |
IV. BAL Professional Investment Strategy and Risk Management
BAL Investment Methodology
(I) Long-term Holding Strategy
- Target Audience: DeFi-focused investors seeking exposure to automated market maker protocols and liquidity provision models
- Operational Recommendations:
- Consider dollar-cost averaging given BAL's significant year-over-year decline of 81.53% and proximity to its all-time low of $0.499712
- Monitor Balancer protocol development updates and governance proposals that may impact token utility
- Storage Solution: Gate Web3 Wallet provides secure custody options for BAL tokens with multi-signature support and hardware wallet integration capabilities
(II) Active Trading Strategy
- Technical Analysis Tools:
- Volume Analysis: Current 24-hour trading volume of $30,171 suggests relatively low liquidity, requiring careful position sizing
- Support/Resistance Levels: Recent 24-hour range between $0.498-$0.5337 establishes near-term technical boundaries
- Swing Trading Considerations:
- Monitor volatility during periods of increased protocol activity or governance events
- Set stop-loss orders given the token's recent downward momentum (7-day decline of 11.74%)
BAL Risk Management Framework
(I) Asset Allocation Principles
- Conservative Investors: 1-3% portfolio allocation to DeFi governance tokens
- Aggressive Investors: 5-8% allocation within speculative crypto holdings
- Professional Investors: Position sizing based on protocol fundamentals and market conditions assessment
(II) Risk Hedging Solutions
- Portfolio Diversification: Balance BAL exposure with other DeFi protocol tokens and layer-1 assets
- Position Monitoring: Establish alert systems for significant price movements given recent volatility patterns
(III) Secure Storage Solutions
- Hot Wallet Recommendation: Gate Web3 Wallet for active trading and liquidity provision activities
- Cold Storage Option: Hardware wallet solutions for long-term holdings exceeding trading allocations
- Security Precautions: Enable two-factor authentication, verify contract addresses (0xba100000625a3754423978a60c9317c58a424e3D on Ethereum), and regularly review transaction histories
V. BAL Potential Risks and Challenges
BAL Market Risks
- Price Volatility: BAL experienced an 81.53% decline over the past year, recently approaching its all-time low
- Liquidity Concerns: Trading volume of $30,171 over 24 hours indicates potential slippage risks for larger transactions
- Market Capitalization: Relatively small market cap of approximately $32.17 million may result in increased price sensitivity
BAL Regulatory Risks
- DeFi Protocol Scrutiny: Automated market makers and liquidity pools face evolving regulatory frameworks across jurisdictions
- Governance Token Classification: Regulatory treatment of governance tokens remains uncertain in many markets
- Compliance Requirements: Potential future regulations may impact protocol operations and token utility
BAL Technical Risks
- Smart Contract Dependencies: Protocol relies on complex smart contract interactions on Ethereum mainnet
- Protocol Competition: Balancer faces competition from established and emerging automated market maker platforms
- Integration Risks: Changes to underlying blockchain infrastructure or connected protocols may affect functionality
VI. Conclusion and Action Recommendations
BAL Investment Value Assessment
BAL represents exposure to the automated market maker segment of DeFi infrastructure. The token's significant year-over-year decline and proximity to all-time lows suggest a challenging market environment. While Balancer's weighted pool mechanism offers differentiation, investors should carefully evaluate the protocol's competitive positioning and development trajectory. Short-term risks include continued price pressure and low trading volumes, while long-term considerations depend on protocol adoption trends and governance effectiveness.
BAL Investment Recommendations
✅ Beginners: Start with minimal allocation to understand DeFi protocol dynamics; focus on education before significant capital commitment
✅ Experienced Investors: Consider position sizing based on DeFi portfolio allocation strategy; monitor protocol metrics and governance developments
✅ Institutional Investors: Evaluate protocol fundamentals, tokenomics structure (circulating supply: 64.58M BAL, max supply: 96.15M BAL), and competitive landscape before establishing positions
BAL Trading Participation Methods
- Spot Trading: Direct BAL token acquisition through Gate.com with existing trading pairs
- Liquidity Provision: Participate in Balancer protocol pools to earn trading fees and potential BAL incentives
- Governance Participation: Engage with Balancer governance forums and proposals to influence protocol development
Cryptocurrency investment carries extremely high risks, and this article does not constitute investment advice. Investors should make prudent decisions based on their own risk tolerance and are advised to consult professional financial advisors. Never invest more than you can afford to lose.
FAQ
What is the historical price trend of BAL tokens?
BAL tokens launched in 2020 with significant volatility. The token experienced peak prices in 2021 during the bull market, reaching over $60, then corrected substantially in 2022. From 2023 onwards, BAL has shown gradual recovery with increasing adoption in decentralized finance protocols, demonstrating resilience in the crypto market.
What are the main factors affecting BAL price?
BAL price is primarily influenced by Balancer protocol adoption, liquidity pool volumes, governance decisions, market sentiment, DeFi ecosystem trends, and overall cryptocurrency market conditions. Token utility and staking rewards also significantly impact its valuation.
What is the basis for BAL future price predictions?
BAL price predictions are based on analyzing trading volume, market capitalization trends, ecosystem development, governance participation, liquidity pool performance, and overall DeFi market conditions affecting Balancer protocol adoption.
How to predict BAL price trends through technical analysis?
Analyze BAL's price charts using support and resistance levels, moving averages, and RSI indicators. Monitor trading volume trends and identify chart patterns like breakouts. Track whale movements and market sentiment to gauge momentum shifts for price direction prediction.
What advantages does BAL have compared to other DeFi tokens?
BAL offers superior liquidity through its automated market maker protocol, lower slippage on trades, and innovative yield farming rewards. Its governance token structure empowers community participation while maintaining capital efficiency advantages over competing DeFi platforms.
What are the main risks of investing in BAL?
BAL investment risks include market volatility, liquidity fluctuations, regulatory changes, smart contract vulnerabilities, and governance uncertainties. Token price can fluctuate significantly based on market conditions and protocol developments.
Balancer协议的发展前景对BAL价格有什么影响?
Balancer协议的发展前景对BAL价格具有正面影响。协议创新、流动性池扩展、交易额增长和生态应用拓展都会提升BAL的需求与价值。长期看,Balancer在DeFi中的地位加强将直接驱动BAL价格上升。
* The information is not intended to be and does not constitute financial advice or any other recommendation of any sort offered or endorsed by Gate.