This comprehensive guide analyzes BLAST, the innovative Ethereum Layer 2 solution generating native yield for ETH and stablecoins, currently trading at $0.0008003 with a $43.22 million market cap. The article examines BLAST's price trajectory from its June 2024 launch through 2031, incorporating historical patterns, supply dynamics, and ecosystem development. It projects BLAST price could range from $0.00075 to $0.00127 by 2031, reflecting approximately 48% growth potential. The analysis covers critical factors including token unlock schedules, institutional adoption, macroeconomic conditions, and technical innovations like native staking yields. Professional investment strategies address long-term holding, active trading approaches, and risk management frameworks across different investor profiles. Comprehensive risk assessment covers market volatility, regulatory challenges, and technical vulnerabilities. Detailed recommendations guide beginners through institutional investors on BLAST participation through
Introduction: BLAST's Market Position and Investment Value
BLAST (BLAST), as the first Ethereum Layer 2 solution providing native yield for ETH and stablecoins, has been gaining attention in the blockchain ecosystem since its launch in 2024. As of January 20, 2026, BLAST has achieved a market capitalization of approximately $43.22 million, with a circulating supply of about 54 billion tokens, and the price maintaining around $0.0008003. This asset, known as a "yield-generating L2 solution," is playing an increasingly important role in the decentralized finance sector by automatically passing returns from ETH staking and RWA protocols back to users.
This article will comprehensively analyze BLAST's price trends from 2026 to 2031, combining historical patterns, market supply and demand dynamics, ecosystem development, and macroeconomic environment to provide investors with professional price predictions and practical investment strategies.
I. BLAST Price History Review and Market Status
BLAST Historical Price Evolution Trajectory
- 2024: Token launched on June 25, with an initial listing price of $0.02, experiencing significant market activity in its early trading phase
- 2024: Reached all-time high of $0.02817 on June 27, shortly after launch, demonstrating strong initial market interest
- 2024-2025: Price experienced substantial downward pressure, declining from peak levels to test lower support zones
- 2025: Marked all-time low of $0.0006661 on December 18, representing a significant correction from historical highs
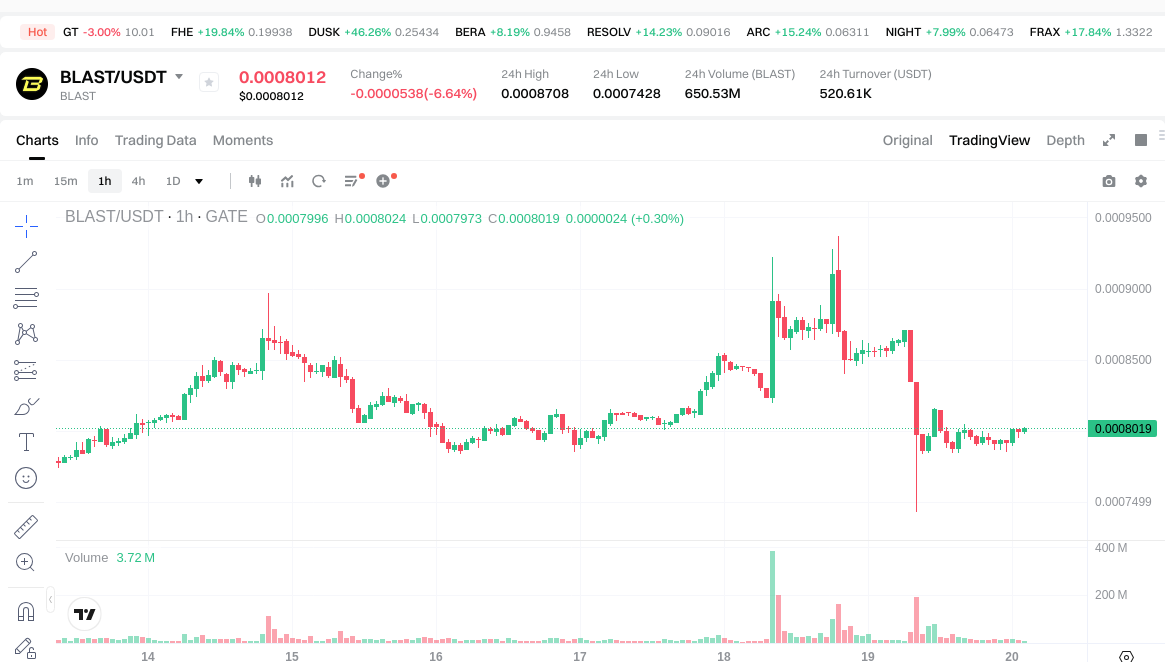
BLAST Current Market Status
As of January 20, 2026, BLAST is trading at $0.0008003, with a 24-hour trading range between $0.0007428 and $0.0008708. The token has demonstrated a 24-hour decline of 6.05%, while showing positive momentum over the 7-day period with a gain of 3.66% and a 30-day increase of 7.51%.
The project maintains a market capitalization of approximately $43.22 million, with a circulating supply of 54.00 billion tokens out of a maximum supply of 100 billion tokens, representing a circulation ratio of 54%. The fully diluted market cap stands at $80.03 million, with the current market cap representing 54% of the fully diluted valuation.
BLAST's 24-hour trading volume reached $520,483.88, and the token is listed on 31 exchanges. The project has attracted 280,494 token holders, indicating a growing community base. The current market dominance stands at 0.0024% of the total cryptocurrency market.
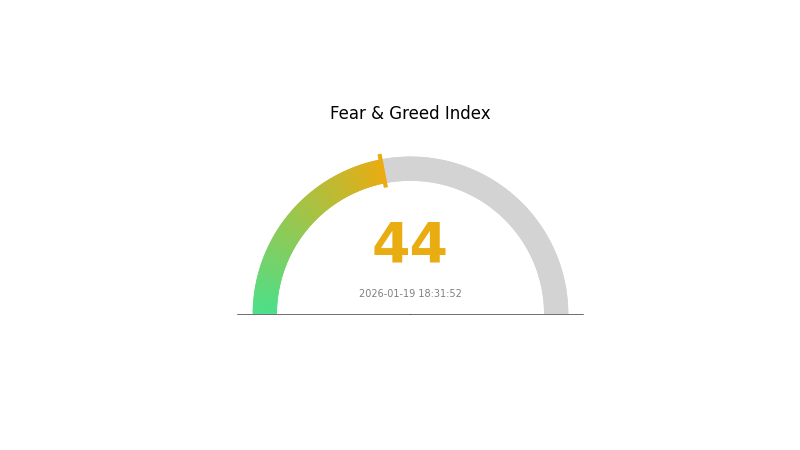
The Crypto Fear & Greed Index currently registers at 44, indicating a "Fear" sentiment in the broader market environment, which may be influencing short-term price movements.
Click to view current BLAST market price
BLAST Market Sentiment Index
2026-01-19 Fear and Greed Index: 44 (Fear)
Click to view current Fear & Greed Index
The BLAST market is currently experiencing a fear sentiment phase, with the Fear and Greed Index standing at 44. This reading indicates moderate market anxiety, suggesting investors are exercising caution. During such periods, market volatility tends to increase as participants reassess their positions. This fear-driven environment often presents opportunities for long-term investors to accumulate assets at potentially more attractive valuations. However, traders should remain vigilant and implement proper risk management strategies. Monitor key support levels and market developments closely as sentiment may shift with new catalysts or regulatory announcements.
BLAST Holding Distribution
The holding distribution chart illustrates the percentage of BLAST tokens held by major wallet addresses, serving as a critical metric for assessing market concentration and decentralization levels. This indicator reveals how token supply is allocated across different holders, which directly impacts market stability and price volatility patterns.
Current data shows significant concentration among the top holders. The largest address controls 23.83% of total supply (23,829,435.84K tokens), followed closely by the second-largest holder with 21.06% (21,059,069.14K tokens). The top three addresses collectively hold 61.25% of circulating supply, while the top five control approximately 71.92%. This concentration structure indicates a highly centralized token distribution, where a small number of entities possess substantial market influence. Such concentration levels typically correlate with elevated risks of price manipulation and increased volatility, as large holders possess the capacity to significantly impact market dynamics through coordinated trading activities.
The remaining 28.08% held by other addresses suggests limited distribution across the broader market participant base. This asymmetric holding pattern raises concerns about market structure resilience, particularly during periods of high volatility when concentrated holders may execute large-scale transactions. From a market microstructure perspective, this distribution profile indicates that BLAST operates with relatively weak decentralization characteristics, potentially exposing smaller investors to amplified risks stemming from whale movements and coordinated selling pressure.
Click to view current BLAST Holding Distribution
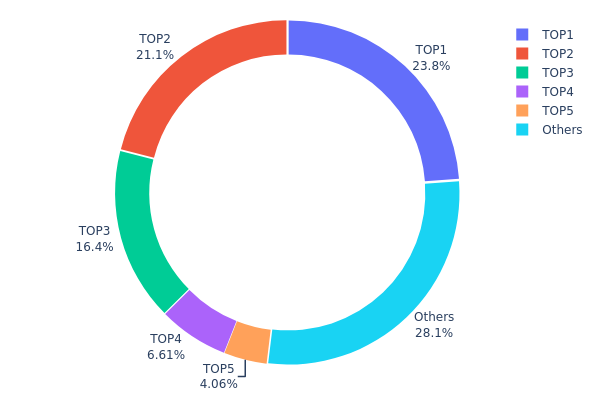
| Top |
Address |
Holding Qty |
Holding (%) |
| 1 |
0xCB4A...8892DE |
23829435.84K |
23.83% |
| 2 |
0x59A9...f15448 |
21059069.14K |
21.06% |
| 3 |
0xeC1f...8B68Da |
16358533.36K |
16.36% |
| 4 |
0x4bC3...d65AB1 |
6609171.80K |
6.61% |
| 5 |
0x87a8...cC5183 |
4058908.81K |
4.06% |
| - |
Others |
28084881.05K |
28.08% |
II. Core Factors Affecting BLAST's Future Price
Supply Mechanism
- Token Unlock Schedule: BLAST faces significant token unlock pressure, with reference materials indicating that large-scale unlocks and early investor selling have driven sustained selling pressure in similar Layer 2 projects. The token economics design directly impacts market supply-demand dynamics.
- Historical Pattern: According to market observations, new tokens typically experience volatility during initial listing phases. BLAST's price has shown fluctuations around $0.025 in secondary markets following its launch.
- Current Impact: The project distributed 17 billion tokens through airdrops, with pre-mining futures prices showing a 170% premium over issuance prices, suggesting strong early market interest despite potential unlock-related selling pressure.
Institutional and Whale Activity
- Project Backing: BLAST is developed by the team behind Blur, with founder Pacman having established credibility in the NFT marketplace sector. The project attracted substantial attention by achieving $1.2 billion in TVL within its first week of mainnet launch.
- Ecosystem Adoption: The platform has integrated with major DeFi protocols, though specific enterprise partnerships were not detailed in available materials.
- Regulatory Environment: The broader cryptocurrency industry is experiencing gradual legislative progress and increasing social acceptance, which may positively influence regulatory frameworks for Layer 2 solutions.
Macroeconomic Environment
- ETH Price Correlation: BLAST's performance is closely tied to Ethereum's trajectory, as the Layer 2 ecosystem benefits from strong liquidity in ETH-based decentralized exchanges. Market analysis suggests ETH's sustained growth remains a critical factor for BLAST's valuation.
- Market Sentiment Shifts: The Layer 2 narrative's market reception has shown variability, with investor confidence playing a significant role in determining price movements across the sector.
- Valuation Context: Initial market trading analysis from the Aevo platform estimated BLAST's value around $3 billion, with projected fluctuation ranges between $3 billion and $10 billion.
Technical Development and Ecosystem Building
- Native Yield Innovation: BLAST pioneered a yield-generating Layer 2 model where staked ETH automatically earns approximately 4.5% annual returns, differentiating it from traditional scaling solutions.
- TVL Growth: The platform demonstrated rapid adoption with TVL surging past $1.2 billion shortly after mainnet deployment, indicating strong user interest in its yield mechanisms.
- Competitive Positioning: BLAST must continue advancing in technical innovation, user experience, and ecosystem development to stand out among Layer 2 competitors. The market's recognition and acceptance of Layer 2 tokens will directly influence BLAST's market performance and long-term prospects.
III. 2026-2031 BLAST Price Prediction
2026 Outlook
- Conservative Prediction: $0.00075 - $0.0008
- Neutral Prediction: Around $0.0008
- Optimistic Prediction: Up to $0.00106 (requires favorable market conditions and increased adoption)
2027-2029 Outlook
- Market Stage Expectation: BLAST may enter a gradual accumulation phase with moderate price fluctuations as the project continues to develop its ecosystem and expand its user base.
- Price Range Predictions:
- 2027: $0.00048 - $0.00096
- 2028: $0.00076 - $0.00116
- 2029: $0.00086 - $0.00108
- Key Catalysts: Technical upgrades, strategic partnerships, and broader market sentiment recovery could serve as primary drivers for price appreciation during this period.
2030-2031 Long-term Outlook
- Base Scenario: $0.00058 - $0.0013 (assuming steady ecosystem growth and stable market conditions)
- Optimistic Scenario: $0.00079 - $0.00127 (contingent upon significant protocol improvements and increased institutional interest)
- Transformative Scenario: Approaching $0.00119 or higher (requires breakthrough developments in blockchain scalability and widespread mainstream adoption)
- 2031-01-20: BLAST demonstrates potential price growth of approximately 48% compared to 2026 baseline, reflecting cumulative progress over the five-year period.
| Year |
Predicted High Price |
Predicted Average Price |
Predicted Low Price |
Price Change |
| 2026 |
0.00106 |
0.0008 |
0.00075 |
0 |
| 2027 |
0.00096 |
0.00093 |
0.00048 |
16 |
| 2028 |
0.00116 |
0.00094 |
0.00076 |
17 |
| 2029 |
0.00108 |
0.00105 |
0.00086 |
31 |
| 2030 |
0.0013 |
0.00107 |
0.00058 |
33 |
| 2031 |
0.00127 |
0.00119 |
0.00079 |
48 |
IV. BLAST Professional Investment Strategy and Risk Management
BLAST Investment Methodology
(1) Long-term Holding Strategy
- Suitable for: Investors with moderate risk tolerance seeking exposure to Ethereum Layer 2 ecosystem and yield-generating mechanisms
- Operational Recommendations:
- Consider accumulating positions during periods of market consolidation, particularly when BLAST trades near established support levels
- Monitor the project's development progress regarding ETH staking yield (currently 3.4%) and stablecoin yield (currently 8%) sustainability
- Storage Solution: Utilize Gate Web3 Wallet for secure custody with built-in DeFi integration capabilities
(2) Active Trading Strategy
- Technical Analysis Tools:
- Moving Average Convergence Divergence (MACD): Helps identify momentum shifts and potential entry/exit points during BLAST's price movements
- Relative Strength Index (RSI): Useful for detecting overbought conditions above 70 or oversold conditions below 30
- Swing Trading Key Points:
- Monitor 24-hour trading volume (currently $520,483.88) for liquidity assessment before executing larger positions
- Pay attention to the 24-hour high ($0.0008708) and low ($0.0007428) ranges to establish daily trading boundaries
BLAST Risk Management Framework
(1) Asset Allocation Principles
- Conservative Investors: 1-3% of total crypto portfolio
- Aggressive Investors: 5-8% of total crypto portfolio
- Professional Investors: 10-15% with active hedging strategies
(2) Risk Hedging Solutions
- Diversification Strategy: Allocate across multiple Layer 2 projects to reduce concentration risk
- Position Sizing: Implement dollar-cost averaging to mitigate timing risk given BLAST's historical volatility
(3) Security Storage Solutions
- Hot Wallet Recommendation: Gate Web3 Wallet for active trading and yield participation with multi-layer security features
- Cold Storage Option: Consider hardware wallet solutions for long-term holdings exceeding trading needs
- Safety Precautions: Never share private keys, enable two-factor authentication, and verify contract addresses (0xb1a5700fA2358173Fe465e6eA4Ff52E36e88E2ad) before transactions
V. BLAST Potential Risks and Challenges
BLAST Market Risks
- Volatility Risk: BLAST has experienced significant price fluctuations, declining 90.45% over the past year from its high of $0.02817
- Liquidity Risk: With a 24-hour trading volume of approximately $520,000 and market cap of $43.22 million, larger trades may experience slippage
- Competition Risk: As one of many Ethereum Layer 2 solutions, BLAST faces intense competition in the scaling ecosystem
BLAST Regulatory Risks
- Yield Classification: Regulatory authorities may scrutinize the 3.4% ETH and 8% stablecoin yields offered, potentially classifying them as securities
- Cross-border Compliance: Layer 2 solutions operating across jurisdictions may face varying regulatory frameworks affecting user access
- Staking Regulation: Evolving regulations around staking mechanisms could impact BLAST's core value proposition
BLAST Technical Risks
- Smart Contract Vulnerabilities: As with all blockchain protocols, potential bugs or exploits in smart contracts could affect user funds
- Bridge Security: Layer 2 solutions rely on bridges to Ethereum mainnet, which have historically been targets for attacks
- Network Dependency: BLAST's performance is tied to Ethereum's underlying infrastructure and any mainnet issues could cascade
VI. Conclusion and Action Recommendations
BLAST Investment Value Assessment
BLAST presents a unique value proposition as an Ethereum Layer 2 with native yield generation for ETH and stablecoins. The project's yield mechanisms, derived from ETH staking and RWA protocols, offer potential passive income streams. However, investors should consider the significant price decline of 90.45% over the past year and current market capitalization of approximately $43.22 million. With 54% of total supply in circulation and listing on 31 exchanges, BLAST demonstrates reasonable distribution and accessibility. The project's long-term viability depends on sustained adoption, yield sustainability, and competitive positioning within the crowded Layer 2 landscape.
BLAST Investment Recommendations
✅ Beginners: Start with minimal exposure (1-2% of crypto portfolio) to understand yield mechanisms and Layer 2 functionality before increasing position size
✅ Experienced Investors: Consider strategic accumulation during market dips while maintaining strict position limits (3-5%) and monitoring yield sustainability metrics
✅ Institutional Investors: Conduct thorough due diligence on smart contract audits and yield sources before deploying capital, with enhanced focus on regulatory compliance
BLAST Trading Participation Methods
- Spot Trading: Purchase BLAST directly on Gate.com with support for the BLASTETH contract address for immediate exposure
- Dollar-Cost Averaging: Implement systematic purchasing at regular intervals to reduce timing risk given historical volatility
- Yield Participation: Explore native yield opportunities on the Blast network for ETH and stablecoin holdings to enhance returns
Cryptocurrency investment carries extremely high risk, and this article does not constitute investment advice. Investors should make prudent decisions based on their own risk tolerance and are advised to consult professional financial advisors. Never invest more than you can afford to lose.
FAQ
What is the current price of BLAST token? What are its all-time high and all-time low prices?
BLAST's all-time high price reached US$0.02918, while its all-time low was US$0.0006677. Current price fluctuates based on market conditions and requires real-time data verification.
What are the main factors affecting BLAST price?
BLAST price is mainly influenced by supply mechanisms, institutional adoption, and Ethereum L2 technology innovation. These factors determine market demand and technical prospects.
What is BLAST project's technology and roadmap? How does this affect the price?
BLAST focuses on Layer 2 optimization with enhanced cost efficiency and faster transaction processing. These technical improvements reduce fees and increase network utility, positively driving market valuation and price appreciation through improved fundamentals.
What are professional analysts' price predictions for BLAST in the future?
Professional analysts project BLAST could reach a maximum of $0.039667 by 2030, with a minimum expected price around $0.000442. The trend indicates potential upward trajectory for BLAST.
BLAST的市值、流通量和总供应量分别是多少?
BLAST's market cap is $47.03 million. Circulating supply is 53.9 billion BLAST, representing 54% of the total supply of 100 billion BLAST tokens.
What are the main risks of investing in BLAST?
Main risks include market volatility, regulatory uncertainty, and technology vulnerabilities. These factors could impact BLAST's value and usability. Consider your risk tolerance before investing.
* The information is not intended to be and does not constitute financial advice or any other recommendation of any sort offered or endorsed by Gate.