This comprehensive analysis explores BMT (Bubblemaps) price forecasts from 2026 to 2031, combining historical data, market dynamics, and ecosystem development. The article examines BMT's current market position with a $5.71 million capitalization and 256.18 million circulating tokens trading at $0.0223. It presents layered price predictions: conservative to optimistic 2026 ranges ($0.01944-$0.03239), gradual growth through 2029, and potential long-term appreciation to $0.04941 by 2031. The guide provides actionable investment strategies including long-term holding and active trading approaches, comprehensive risk management frameworks for different investor profiles, and critical risk assessments covering market volatility, regulatory challenges, and technical vulnerabilities. Ideal for both beginner and experienced crypto investors seeking DeFi infrastructure exposure.
Introduction: BMT's Market Position and Investment Value
Bubblemaps (BMT), as the first supply auditing tool for DeFi tokens and NFTs, has established its presence in the blockchain transparency and security sector since its inception. As of 2026, BMT maintains a market capitalization of approximately $5.71 million, with a circulating supply of about 256.18 million tokens, and the price hovering around $0.0223. This asset, designed to enhance transparency in decentralized finance ecosystems, is playing an increasingly important role in the DeFi security and auditing space.
This article will comprehensively analyze BMT's price trajectory from 2026 to 2031, combining historical patterns, market supply and demand dynamics, ecosystem development, and macroeconomic conditions to provide investors with professional price forecasts and practical investment strategies.
I. BMT Price History Review and Market Status
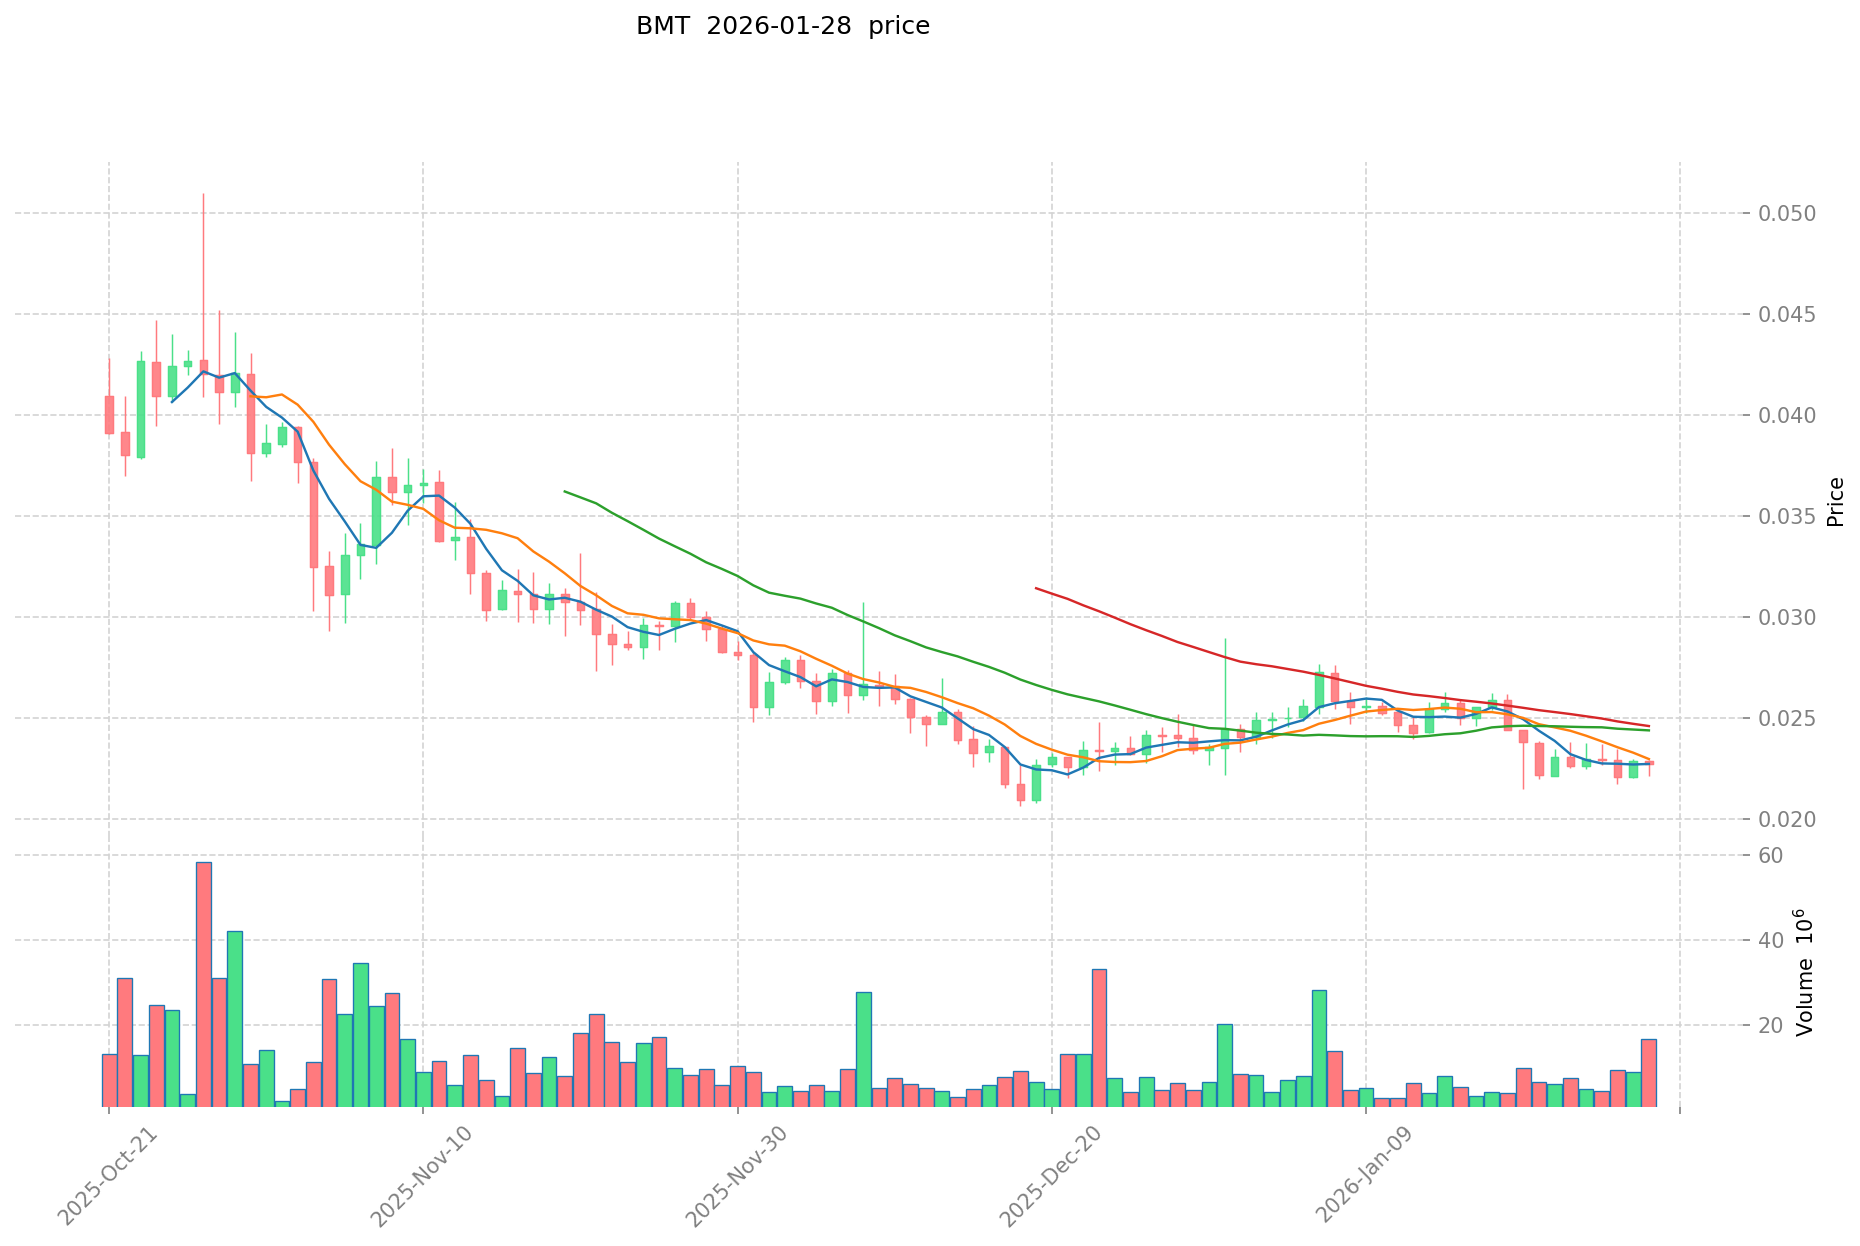
BMT Historical Price Evolution Trajectory
- 2025: BMT experienced significant price volatility throughout the year, with the price reaching a peak of $0.3262 in March 2025, followed by a subsequent decline to a low of $0.01687 in October 2025.
BMT Current Market Situation
As of January 28, 2026, BMT is trading at $0.0223, showing a modest increase of 0.13% over the past 24 hours. The token has experienced a slight downward pressure over recent periods, with a 0.98% decline over the past 7 days and a 5.26% decrease over the past 30 days. Over the past year, BMT has seen a substantial price adjustment of 76.28%.
The current 24-hour trading volume stands at $322,867.42, with the price fluctuating between a high of $0.02286 and a low of $0.02214 within the day. BMT's market capitalization is approximately $5.71 million, with a circulating supply of 256,180,900 tokens, representing 25.7% of the maximum supply of 1 billion tokens. The fully diluted market cap is estimated at $22.3 million.
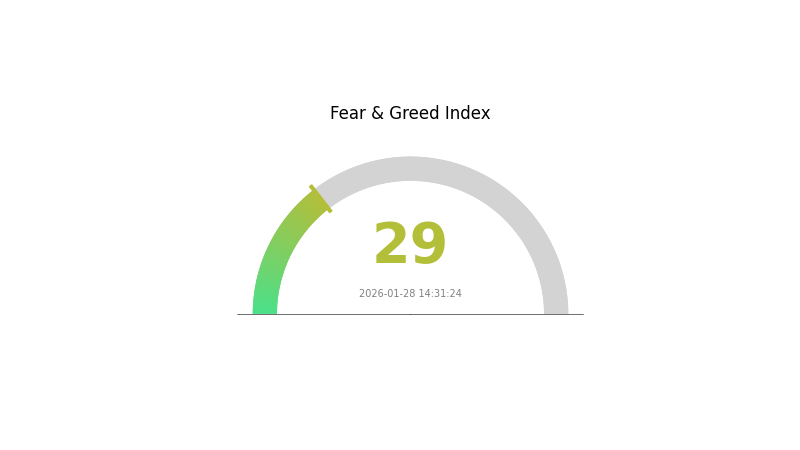
BMT currently ranks #1463 in the cryptocurrency market, with a market dominance of 0.00070%. The token is listed on 27 exchanges and has approximately 27,701 holders. The current market sentiment index stands at 29, indicating a "Fear" sentiment in the broader market.
Click to view the current BMT market price
BMT Market Sentiment Index
2026-01-28 Fear and Greed Index: 29 (Fear)
Click to view current Fear & Greed Index
The cryptocurrency market is currently in a fear state with an index reading of 29. This low score indicates heightened market anxiety and risk aversion among investors. When fear dominates, it typically reflects concerns about market volatility, regulatory uncertainty, or macroeconomic headwinds. Such conditions often present opportunities for long-term investors to accumulate quality assets at lower valuations. However, caution is warranted, and investors should conduct thorough research before making investment decisions during periods of elevated fear sentiment.
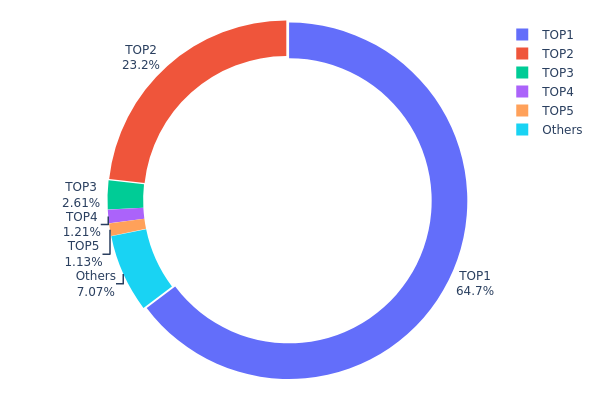
BMT Holding Distribution
The holding distribution chart reflects the concentration of token holdings across different on-chain addresses, revealing the degree of decentralization and potential market control dynamics. According to the current data, the top 5 addresses collectively hold approximately 92.9% of the total BMT supply, with the remaining 7.1% distributed among other addresses. This indicates an extremely high concentration level, where the top holder alone controls 64.73% of the circulating supply, and the second-largest holder accounts for 23.24%.
This highly centralized holding structure presents significant implications for market dynamics. The dominance of the top two addresses, which together control nearly 88% of the supply, suggests potential vulnerabilities in price stability and market manipulation risks. Such concentration typically reduces market liquidity and increases susceptibility to large-scale price movements if major holders decide to liquidate or redistribute their positions. Furthermore, the limited distribution beyond the top 5 addresses indicates a relatively narrow investor base, which may constrain organic price discovery mechanisms and community-driven development initiatives.
From a structural perspective, this distribution pattern reflects a market still in its early development phase or one heavily influenced by institutional or founding team holdings. While concentrated holdings can sometimes provide stability during market downturns, they simultaneously pose governance and transparency concerns regarding token utility and long-term sustainability. The minimal percentage held by smaller addresses (7.1%) suggests limited retail participation and restricted decentralization, factors that may influence both short-term volatility patterns and long-term adoption trajectories.
Click to view current BMT Holding Distribution
| Top |
Address |
Holding Qty |
Holding (%) |
| 1 |
0xeaed...6a6b8d |
319286.41K |
64.73% |
| 2 |
0xf977...41acec |
114667.73K |
23.24% |
| 3 |
0x09f9...917fc5 |
12872.91K |
2.60% |
| 4 |
0x0d07...b492fe |
5965.79K |
1.20% |
| 5 |
0x5d36...f67bf0 |
5581.19K |
1.13% |
| - |
Others |
34856.65K |
7.1% |
II. Core Factors Affecting BMT's Future Price
Supply Mechanism
- Airdrop Distribution: Early supporters claiming airdrops may intensify selling pressure in the market.
- Historical Pattern: Token supply releases through airdrops typically create short-term volatility as recipients liquidate their holdings.
- Current Impact: Short-term fluctuations are primarily driven by airdrop claims and overall market sentiment, while the token's practical utility and cross-chain liquidity help maintain stable trading volumes.
Market Sentiment and Investor Confidence
- Investor Sentiment: Market emotions and confidence levels have a direct impact on BMT's price movements. Positive news regarding widespread adoption or technological breakthroughs tends to drive price appreciation.
- Exchange Listing Effect: Listing on major cryptocurrency exchanges enhances market visibility and liquidity, attracting both institutional and retail investors to participate in trading activities.
Token Utility and Ecosystem Development
- Practical Applications: The token's real-world use cases within the BubbleMaps ecosystem contribute to sustained trading activity and price stability.
- Cross-chain Liquidity: Enhanced interoperability across different blockchain networks supports consistent trading volumes and broader market accessibility.
III. 2026-2031 BMT Price Forecast
2026 Outlook
- Conservative Forecast: $0.01944 - $0.02234
- Neutral Forecast: Around $0.02234
- Optimistic Forecast: Up to $0.03239 (requires favorable market conditions and increased adoption)
2027-2029 Outlook
- Market Stage Expectation: BMT is anticipated to enter a gradual growth phase, with potential market consolidation and increased investor interest driving steady appreciation.
- Price Range Forecast:
- 2027: $0.01779 - $0.03229, with an average around $0.02737 (approximately 22% growth)
- 2028: $0.01999 - $0.04027, with an average around $0.02983 (approximately 33% cumulative growth)
- 2029: $0.02839 - $0.04101, with an average around $0.03505 (approximately 57% cumulative growth)
- Key Catalysts: Expanding ecosystem partnerships, technological upgrades, broader market adoption, and favorable regulatory developments could serve as primary drivers for price appreciation during this period.
2030-2031 Long-term Outlook
- Baseline Scenario: $0.02244 - $0.04297 in 2030, with an average around $0.03803 (assuming steady market growth and sustained project development)
- Optimistic Scenario: $0.03524 - $0.04941 in 2031, with an average around $0.04050 (assuming accelerated adoption and positive market sentiment, representing approximately 81% cumulative growth)
- Transformative Scenario: Prices could potentially exceed $0.04941 by 2031 (under conditions of significant technological breakthroughs, mass adoption, or exceptional market conditions)
- January 28, 2026: BMT baseline price stands at approximately $0.02234 (current neutral forecast level)
| Year |
Predicted High Price |
Predicted Average Price |
Predicted Low Price |
Price Change |
| 2026 |
0.03239 |
0.02234 |
0.01944 |
0 |
| 2027 |
0.03229 |
0.02737 |
0.01779 |
22 |
| 2028 |
0.04027 |
0.02983 |
0.01999 |
33 |
| 2029 |
0.04101 |
0.03505 |
0.02839 |
57 |
| 2030 |
0.04297 |
0.03803 |
0.02244 |
70 |
| 2031 |
0.04941 |
0.0405 |
0.03524 |
81 |
IV. BMT Professional Investment Strategy and Risk Management
BMT Investment Methodology
(1) Long-term Holding Strategy
- Suitable for: Investors interested in DeFi infrastructure tools and blockchain data analytics solutions
- Operational recommendations:
- Consider accumulating positions during market corrections while monitoring project development milestones
- Evaluate the platform's adoption rate among DeFi projects and NFT communities as key performance indicators
- Storage solution: Use Gate Web3 Wallet for secure multi-chain asset management, supporting both BSC and Solana networks
(2) Active Trading Strategy
- Technical analysis tools:
- Volume analysis: Monitor the 24-hour trading volume of approximately $322,867 to identify liquidity patterns
- Support and resistance levels: Current 24-hour range between $0.02214 and $0.02286 provides reference points for entry and exit
- Swing trading considerations:
- Consider the token's moderate volatility with recent 7-day change of -0.98%
- Monitor market sentiment indicators and holder count changes (currently 27,701 holders)
BMT Risk Management Framework
(1) Asset Allocation Principles
- Conservative investors: 1-2% of crypto portfolio
- Moderate investors: 3-5% of crypto portfolio
- Aggressive investors: 5-10% of crypto portfolio (with active monitoring)
(2) Risk Hedging Approaches
- Diversification strategy: Combine BMT with established DeFi blue-chip tokens to balance sector exposure
- Position sizing: Implement gradual accumulation rather than single large purchases given the token's market cap of approximately $5.71 million
(3) Secure Storage Solutions
- Multi-chain wallet recommendation: Gate Web3 Wallet supports both BSC (0x7d814b9ed370ec0a502edc3267393bf62d891b62) and Solana (FQgtfugBdpFN7PZ6NdPrZpVLDBrPGxXesi4gVu3vErhY) contract addresses
- Hardware wallet option: Consider for larger holdings to minimize online exposure
- Security precautions: Verify contract addresses through official sources, enable two-factor authentication, and never share private keys
V. BMT Potential Risks and Challenges
BMT Market Risks
- High volatility exposure: The token experienced a 76.28% decline over one year, indicating significant price fluctuation potential
- Liquidity constraints: With a circulating market cap of approximately $5.71 million and 27 exchange listings, liquidity may be limited during high volatility periods
- Market sentiment dependency: As a utility token for blockchain analytics, demand correlates with overall DeFi market activity and investor interest in transparency tools
BMT Regulatory Risks
- DeFi tool classification: Evolving regulations around blockchain analytics platforms may impact token utility and adoption
- Multi-jurisdictional compliance: Operating across multiple blockchains (Solana and BSC) requires adherence to varying regulatory frameworks
- Data privacy considerations: Supply auditing tools may face scrutiny regarding data collection and transparency standards in different regions
BMT Technical Risks
- Smart contract vulnerabilities: Dual-chain deployment (BSC and Solana) increases potential attack surfaces requiring ongoing security audits
- Platform dependency: Token value relies on continued adoption and functionality of the Bubblemaps auditing platform
- Blockchain congestion: Performance may be affected by network conditions on underlying chains, particularly during high-activity periods
VI. Conclusion and Action Recommendations
BMT Investment Value Assessment
Bubblemaps (BMT) represents a specialized investment in the blockchain transparency and auditing sector, addressing the growing demand for DeFi supply verification tools. With a current circulation of 25.7% of total supply and presence on 27 exchanges, the project demonstrates early-stage market establishment. However, the token's year-over-year performance and relatively small market cap indicate higher risk characteristics. Long-term value proposition depends on continued adoption by DeFi projects and NFT communities seeking enhanced transparency.
BMT Investment Recommendations
✅ Beginners: Start with small exploratory positions (0.5-1% of crypto portfolio) and focus on understanding the platform's utility before increasing exposure
✅ Experienced investors: Consider BMT as a tactical allocation within a diversified DeFi infrastructure portfolio, monitoring adoption metrics and partnership announcements
✅ Institutional investors: Conduct thorough due diligence on platform traction, evaluate competitive landscape, and assess long-term demand for supply auditing solutions
BMT Trading Participation Methods
- Spot trading: Available on Gate.com and 26 other exchanges with current pricing around $0.0223
- Dollar-cost averaging: Implement systematic accumulation to mitigate timing risk given recent price volatility
- Research-based approach: Monitor platform development updates through official channels (https://bubblemaps.io/ and https://wiki.bubblemaps.io/) before making investment decisions
Cryptocurrency investments carry extreme risk, and this article does not constitute investment advice. Investors should make prudent decisions based on their own risk tolerance and are advised to consult professional financial advisors. Never invest more than you can afford to lose.
FAQ
What is BMT? What are its practical uses?
BMT is a blockchain-based utility token designed for decentralized ecosystem management and governance. It enables users to participate in protocol decisions, access exclusive features, and earn rewards through staking and network participation.
How to predict BMT price? What are the analysis methods?
Analyze BMT price through technical analysis by observing support and resistance levels, monitor trading volume and liquidity changes, assess market sentiment and blockchain metrics, track correlation with Bitcoin trends, and evaluate project fundamentals and adoption growth for comprehensive price predictions.
What are the main risk factors for BMT price prediction?
The main risk factors for BMT price prediction are continuous selling pressure from daily unlocks of 787k BMT tokens and slight bearish imbalance in trading volume, which increase price volatility.
BMT与其他类似代币相比有什么优势和劣势?
BMT优势:实现跨链价值互通,支持多链协作,具备创新的协议设计。劣势:可扩展性受限,跨链效率需优化。总体而言,BMT在区块链互联中占据独特位置,未来有广阔发展空间。
What are professional institutions' predictions for BMT's future price?
Professional institutions predict BMT will experience moderate price appreciation driven by ongoing urban development initiatives and infrastructure improvements. Forecasts are based on current economic fundamentals and project expansion momentum, though specific price targets remain undisclosed.
* The information is not intended to be and does not constitute financial advice or any other recommendation of any sort offered or endorsed by Gate.