This comprehensive analysis explores BMT (Bubblemaps) price predictions from 2026-2031, examining the DeFi auditing token currently trading at $0.02217 with a $5.68 million market cap. The article evaluates BMT's market position, historical price evolution showing a 76.50% annual decline, and supply-demand dynamics affecting future valuations. Core sections include fundamental analysis of ecosystem development, technical price forecasts ranging from $0.02224 to $0.076 by 2031, and multi-tiered investment strategies for different investor profiles. The guide provides actionable recommendations for long-term holding and active trading, detailed risk management frameworks, and secure storage solutions via Gate Web3 Wallet for both Solana and BSC networks. Investors gain insights into market sentiment indicators, holding concentration risks, and practical hedging approaches for navigating BMT's volatile landscape.
Introduction: BMT's Market Position and Investment Value
Bubblemaps (BMT), positioned as the first supply auditing tool for DeFi tokens and NFTs, has established itself in the blockchain analytics sector since its inception. As of January 2026, BMT maintains a market capitalization of approximately $5.68 million, with a circulating supply of around 256.18 million tokens, and the price hovering around $0.02217. This asset, recognized as an innovative transparency solution in the decentralized finance ecosystem, is playing an increasingly significant role in providing on-chain data visualization and wallet cluster analysis.
Despite recent market challenges, including a 76.50% decline over the past year and a current price significantly below its historical high of $0.3262 recorded in March 2025, BMT continues to serve over 27,700 holders across multiple blockchain networks. The token operates on both Solana and BSC (BEP-20) standards, demonstrating its multi-chain infrastructure approach. With a fully diluted valuation of $22.17 million and a circulating supply representing 25.7% of the total supply, BMT presents a unique case study in the blockchain analytics sector.
This article will comprehensively analyze BMT's price trends from 2026 to 2031, combining historical patterns, market supply-demand dynamics, ecosystem development, and macroeconomic conditions to provide investors with professional price forecasts and practical investment strategies.
I. BMT Price History Review and Market Status
BMT Historical Price Evolution Trajectory
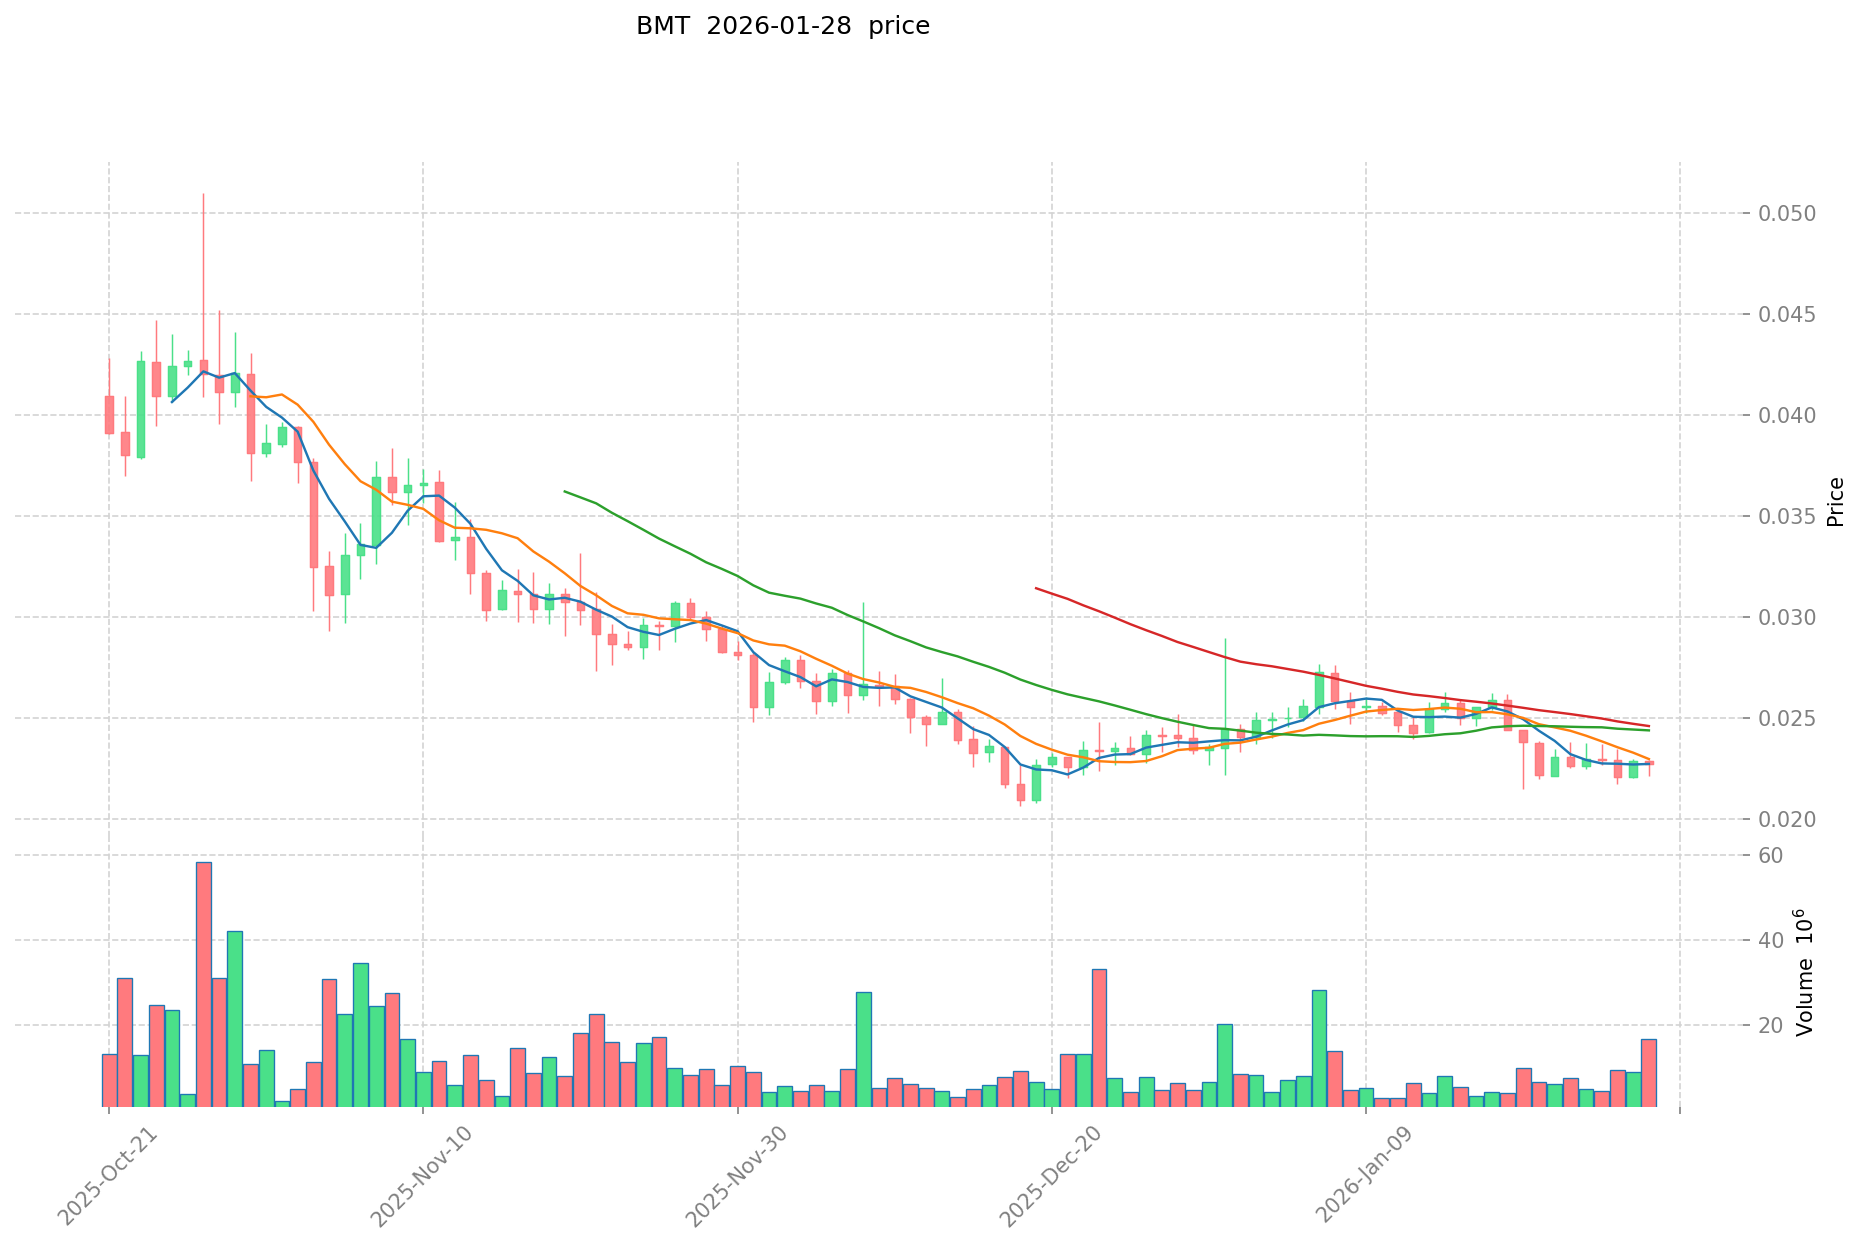
- 2025: BMT launched in March with initial trading activity, reaching a notable level of $0.3262 on March 18, representing a significant early valuation milestone
- 2025: Market experienced substantial adjustment pressure through mid-year, with price declining to $0.01687 by October 10, reflecting broader market dynamics and project maturation phases
- 2025-2026: Price stabilization period emerged, with BMT trading around $0.02217 level as of late January 2026, showing reduced volatility compared to earlier periods
BMT Current Market Landscape
As of January 29, 2026, BMT is trading at $0.02217, with a 24-hour trading volume of $285,044.56. The token has experienced a modest decline of 1.64% over the past 24 hours, with recent price movements ranging between $0.02217 and $0.02286.
From a longer-term perspective, BMT has shown varied performance across different timeframes. The token has declined 4.44% over the past week and 5.26% over the past 30 days, while the one-year performance indicates a significant correction of 76.50% from earlier price levels.
The current market capitalization stands at approximately $5.68 million, with 256.18 million BMT tokens in circulation out of a maximum supply of 1 billion tokens, representing a circulating supply ratio of 25.7%. The fully diluted market capitalization is calculated at $22.17 million. BMT maintains a market dominance of 0.00070% within the broader cryptocurrency ecosystem.
The token is currently listed on 27 exchanges and has attracted 27,701 token holders. BMT maintains contract deployments on both Solana and BSC networks, with verified contract addresses available on respective blockchain explorers.
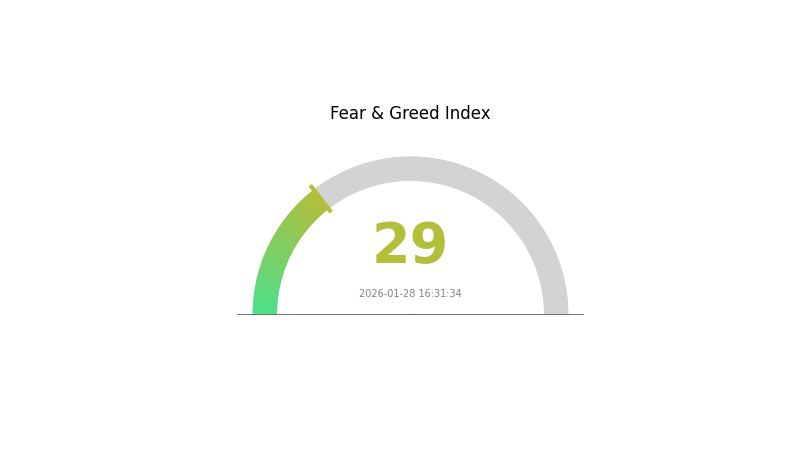
According to market sentiment indicators, the current crypto market fear and greed index stands at 29, suggesting a "Fear" sentiment environment as of January 28, 2026, which may influence broader market dynamics and trading patterns.
Click to view current BMT market price
BMT 市场情绪指标
2026-01-28 Fear and Greed Index: 29 (Fear)
Click to view the current Fear & Greed Index
The cryptocurrency market is currently experiencing a fear sentiment with an index reading of 29. This indicates elevated market anxiety and risk aversion among investors. When the Fear and Greed Index falls below 30, it typically signals strong bearish pressure and increased volatility. Market participants are showing cautious behavior, with reduced buying enthusiasm and heightened uncertainty. This fear-driven environment may present contrarian opportunities for long-term investors, though short-term traders should remain vigilant about potential downside risks. Monitoring this sentiment indicator can help guide investment decisions during volatile market conditions.
BMT Holding Distribution
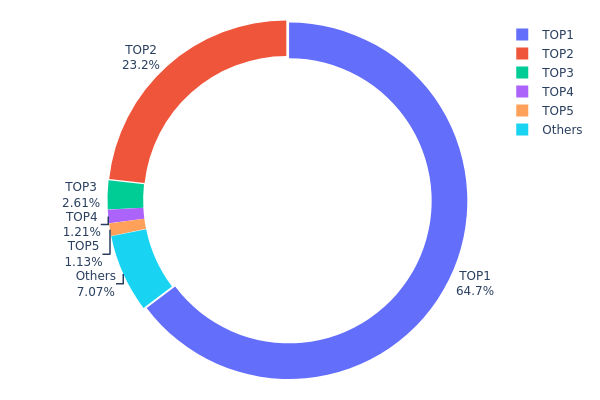
The holding distribution chart illustrates the percentage of total token supply held by different wallet addresses, ranked by holding size. This metric serves as a crucial indicator of token decentralization and potential market manipulation risks. A highly concentrated distribution suggests that a small number of addresses control a significant portion of the circulating supply, which may lead to increased price volatility and liquidity concerns.
Based on the current data, BMT exhibits a notably concentrated holding structure. The top address (0xeaed...6a6b8d) holds approximately 319.29 million tokens, representing 64.73% of the total supply. The second-largest holder (0xf977...41acec) controls 114.67 million tokens or 23.24% of the supply. Combined, these two addresses account for nearly 88% of all BMT tokens, indicating an extremely centralized distribution pattern. The remaining top five addresses collectively hold an additional 4.93% of the supply, while all other addresses combined only control 7.1% of the total circulation.
This highly concentrated holding structure presents several implications for BMT's market dynamics. The dominance of the top two addresses creates significant downside risks, as large-scale sell-offs by these major holders could trigger substantial price fluctuations and market panic. Additionally, such concentration reduces market liquidity depth and increases the potential for price manipulation. From a decentralization perspective, BMT's current distribution deviates considerably from the ideal distributed ownership model typically associated with cryptocurrency projects, suggesting a centralized control structure that may impact long-term market confidence and adoption.
Click to view current BMT Holding Distribution
| Top |
Address |
Holding Qty |
Holding (%) |
| 1 |
0xeaed...6a6b8d |
319286.41K |
64.73% |
| 2 |
0xf977...41acec |
114667.73K |
23.24% |
| 3 |
0x09f9...917fc5 |
12872.91K |
2.60% |
| 4 |
0x0d07...b492fe |
5965.79K |
1.20% |
| 5 |
0x5d36...f67bf0 |
5581.19K |
1.13% |
| - |
Others |
34856.65K |
7.1% |
II. Core Factors Influencing BMT's Future Price
Supply Mechanism
- Airdrop Distribution: Part of the token supply is distributed through airdrops to early supporters, which may lead to increased selling pressure as recipients claim and potentially liquidate their holdings.
- Current Impact: Short-term price volatility is primarily driven by airdrop claim activities and overall market sentiment, while the token's practical utility and cross-chain liquidity help maintain stable trading volumes.
Market Sentiment and Investor Confidence
- Exchange Listing Effect: The listing on major cryptocurrency exchanges enhances market visibility and liquidity, attracting both institutional and retail investors to participate in BMT trading.
- Adoption News: Positive developments regarding widespread adoption or significant technological breakthroughs directly influence investor sentiment and confidence, creating immediate impact on price movements.
- HODLer Behavior: Long-term holder activities and their commitment to the token play a role in stabilizing price fluctuations during periods of market uncertainty.
Token Utility and Ecosystem Development
- Practical Applications: The actual use cases of the token within its ecosystem contribute to sustained trading activity and help establish fundamental value beyond speculative trading.
- Cross-chain Liquidity: The token's ability to operate across multiple blockchain networks enhances accessibility and trading opportunities, supporting price stability through diversified market participation.
- Governance Function: BMT serves governance purposes within the BubbleMaps platform, giving token holders decision-making power that adds intrinsic value to the asset.
III. 2026-2031 BMT Price Prediction
2026 Outlook
- Conservative Forecast: $0.01957 - $0.02224
- Neutral Forecast: $0.02224
- Optimistic Forecast: $0.03203 (requires favorable market conditions)
2027-2029 Medium-Term Outlook
- Market Stage Expectation: BMT is anticipated to enter a gradual growth phase, with price volatility decreasing as the project matures and adoption potentially expands.
- Price Range Forecast:
- 2027: $0.02116 - $0.03527 (approximately 22% increase from 2026)
- 2028: $0.02059 - $0.04524 (approximately 40% increase from 2026)
- 2029: $0.02943 - $0.05275 (approximately 72% increase from 2026)
- Key Catalysts: Potential drivers include increased platform adoption, ecosystem development, strategic partnerships, and broader cryptocurrency market trends.
2030-2031 Long-Term Outlook
- Baseline Scenario: $0.02502 - $0.06232 (assuming steady market conditions and moderate project development)
- Optimistic Scenario: $0.04549 - $0.076 (assuming accelerated adoption and favorable regulatory environment)
- Transformative Scenario: Exceeding $0.076 (requires exceptional market conditions, widespread adoption, and significant technological breakthroughs)
- 2026-01-29: BMT trading at baseline levels with potential for long-term appreciation based on project fundamentals and market dynamics
| Year |
Predicted High Price |
Predicted Average Price |
Predicted Low Price |
Price Change |
| 2026 |
0.03203 |
0.02224 |
0.01957 |
0 |
| 2027 |
0.03527 |
0.02713 |
0.02116 |
22 |
| 2028 |
0.04524 |
0.0312 |
0.02059 |
40 |
| 2029 |
0.05275 |
0.03822 |
0.02943 |
72 |
| 2030 |
0.06232 |
0.04549 |
0.02502 |
105 |
| 2031 |
0.076 |
0.0539 |
0.04743 |
143 |
IV. BMT Professional Investment Strategy and Risk Management
BMT Investment Methodology
(1) Long-term Holding Strategy
- Suitable for: Investors interested in DeFi auditing tool ecosystem development and seeking long-term value appreciation
- Operational Recommendations:
- Consider accumulating BMT positions during market pullbacks, with current price around $0.02217 showing considerable distance from its historical high of $0.3262
- Monitor project development milestones and adoption rate of Bubblemaps' supply auditing tools in the DeFi and NFT sectors
- Storage Solution: Utilize Gate Web3 Wallet for secure storage of BMT tokens, supporting both Solana and BSC (BEP-20) networks
(2) Active Trading Strategy
- Technical Analysis Tools:
- Moving Averages: Track short-term (7-day) and medium-term (30-day) trends, noting recent downward pressure with -4.44% and -5.26% changes respectively
- Volume Analysis: Monitor daily trading volume of approximately $285,044 to identify potential trend reversals or continuation patterns
- Swing Trading Key Points:
- Establish position sizing based on 24-hour price range between $0.02217 and $0.02286
- Set stop-loss orders considering recent volatility patterns and historical low at $0.01687
BMT Risk Management Framework
(1) Asset Allocation Principles
- Conservative Investors: 1-2% of crypto portfolio allocation
- Aggressive Investors: 3-5% of crypto portfolio allocation
- Professional Investors: Up to 8-10% with active monitoring and rebalancing
(2) Risk Hedging Solutions
- Diversification Approach: Balance BMT holdings with established DeFi infrastructure tokens and stablecoins
- Position Scaling: Implement dollar-cost averaging strategy to mitigate timing risk in volatile markets
(3) Secure Storage Solutions
- Multi-chain Wallet Recommendation: Gate Web3 Wallet supports both Solana and BSC networks for BMT storage
- Cold Storage Option: Consider hardware wallet solutions for larger BMT holdings exceeding trading needs
- Security Precautions: Never share private keys, enable two-factor authentication, verify contract addresses (BSC: 0x7d814b9ed370ec0a502edc3267393bf62d891b62; SOL: FQgtfugBdpFN7PZ6NdPrZpVLDBrPGxXesi4gVu3vErhY) before transactions
V. BMT Potential Risks and Challenges
BMT Market Risks
- Price Volatility: BMT has experienced significant price fluctuations with a 76.50% decline over the past year, indicating substantial market risk
- Liquidity Constraints: Daily trading volume of $285,044 may present challenges for larger position entries or exits without significant price impact
- Market Cap Concentration: With only 25.7% of total supply in circulation (256.18M out of 1B tokens), future token unlocks could create selling pressure
BMT Regulatory Risks
- DeFi Auditing Tool Classification: Evolving regulatory frameworks for blockchain analytics and auditing tools may impact project operations
- Multi-chain Compliance: Operating on both Solana and BSC requires adherence to varying jurisdictional requirements across different blockchain ecosystems
- Data Privacy Considerations: Supply auditing functionality may face scrutiny under emerging cryptocurrency transparency and privacy regulations
BMT Technical Risks
- Smart Contract Vulnerabilities: As an auditing tool deployed across multiple chains, BMT's smart contracts require continuous security monitoring
- Network Dependencies: Reliance on Solana and BSC infrastructure means network outages or congestion could affect token accessibility
- Competition Risk: The DeFi analytics sector faces increasing competition from alternative auditing and transparency solutions
VI. Conclusion and Action Recommendations
BMT Investment Value Assessment
BMT presents a specialized investment opportunity in the DeFi auditing and transparency sector. The project addresses a genuine market need for supply auditing of DeFi tokens and NFTs. However, the token has experienced considerable price depreciation from its March 2025 high of $0.3262, currently trading around $0.02217. With relatively modest market capitalization of approximately $5.68 million and limited circulation (25.7%), BMT carries substantial volatility risk. The project's long-term value proposition depends on continued adoption of Bubblemaps' auditing tools and expansion of its user base, currently at 27,701 holders across 27 exchanges.
BMT Investment Recommendations
✅ Beginners: Start with minimal allocation (under 1% of crypto portfolio), focus on understanding DeFi auditing use cases, and utilize Gate Web3 Wallet for secure storage. Consider educational resources before committing significant capital.
✅ Experienced Investors: May consider 2-5% allocation as part of diversified DeFi infrastructure portfolio, actively monitor project development and adoption metrics, implement dollar-cost averaging during accumulation phases.
✅ Institutional Investors: Conduct thorough due diligence on Bubblemaps' technology stack and competitive positioning, assess liquidity requirements against available trading volume, consider direct engagement with project team for strategic insights.
BMT Trading Participation Methods
- Spot Trading: Purchase BMT directly on Gate.com and other supporting exchanges with immediate settlement
- Multi-chain Acquisition: Acquire BMT on preferred blockchain (Solana or BSC) based on transaction cost preferences and existing wallet infrastructure
- Portfolio Integration: Incorporate BMT as part of broader DeFi tools and infrastructure investment thesis alongside complementary projects
Cryptocurrency investment carries extreme risk, and this article does not constitute investment advice. Investors should make prudent decisions based on their own risk tolerance and are advised to consult professional financial advisors. Never invest more than you can afford to lose.
FAQ
What is the current price of BMT token? What are the all-time high and low prices?
BMT's current price fluctuates based on market conditions. The all-time high is US$0.3173, while the all-time low is US$0.02082. Check real-time prices on major crypto platforms for the most up-to-date information.
What are the main factors affecting BMT price?
BMT price is primarily driven by supply and demand dynamics. Key developments such as block reward halving, protocol upgrades, and hard forks significantly impact its value. External market factors and trading volume also play crucial roles in price fluctuations.
How to predict BMT price? What are the analysis methods?
BMT price prediction uses technical analysis including MACD, RSI, and Bollinger Bands indicators. Fundamental analysis examines project developments and market sentiment. On-chain metrics track transaction volume and holder behavior. These methods help identify trends and price movements for informed forecasting.
What are the differences between BMT and other similar tokens?
BMT distinguishes itself through innovative blockchain technology applications, offering superior scalability and security compared to other tokens. Its unique features and potential use cases provide competitive advantages in the digital asset market.
What are the risks of investing in BMT? How should I mitigate them?
BMT investment carries market volatility risk. Mitigate by implementing stop-loss orders, proper position sizing, and risk management strategies. Maintain exposure within your risk tolerance level.
What is BMT's market liquidity and trading volume?
BMT maintains strong market liquidity with 24-hour trading volume reaching 115 million USD. At the current price level of 0.089 USD, the token demonstrates robust demand and trading activity, reflecting healthy market interest and accessibility for traders seeking exposure to BMT.
* The information is not intended to be and does not constitute financial advice or any other recommendation of any sort offered or endorsed by Gate.