This comprehensive guide analyzes BOBA Network's price dynamics from 2026 to 2031, combining historical performance, market sentiment, and ecosystem development. Currently trading at $0.03982 with a $19.66 million market cap, BOBA operates as a Layer 2 Ethereum scaling solution. The article provides tiered price forecasts ranging from conservative to optimistic scenarios, helping investors understand potential value trajectories. It addresses both long-term holding and active trading strategies while detailing risk management frameworks suitable for different investor profiles. Key sections cover token distribution analysis, technical and regulatory risks, and secure storage solutions on Gate.com. Practical investment recommendations are tailored for beginners, experienced traders, and institutional investors seeking Layer 2 exposure within the evolving DeFi landscape.
Introduction: BOBA's Market Position and Investment Value
Boba Network (BOBA), as a Layer 2 Ethereum scaling and enhancement solution, has been making significant strides in the blockchain ecosystem since its launch in 2021. As of January 2026, BOBA maintains a market capitalization of approximately $19.66 million, with a circulating supply of around 493.60 million tokens, and its price hovering around $0.03982. This asset, recognized as an innovative Optimistic Rollup scaling solution, is playing an increasingly important role in reducing gas fees, improving transaction throughput, and expanding smart contract capabilities within the Ethereum ecosystem.
This article will comprehensively analyze BOBA's price trends from 2026 to 2031, combining historical patterns, market supply and demand dynamics, ecosystem development, and macroeconomic conditions to provide investors with professional price forecasts and practical investment strategies.
I. BOBA Price History Review and Current Market Status
BOBA Historical Price Evolution Trajectory
- 2021: BOBA reached a notable price level of $7.93 on November 26, marking a significant milestone in its early trading history
- 2022-2025: The token experienced a substantial correction period, with price declining significantly from previous levels
- 2026: On January 22, BOBA recorded a price of $0.03839995, representing a notable low point in its trading history
BOBA Current Market Situation
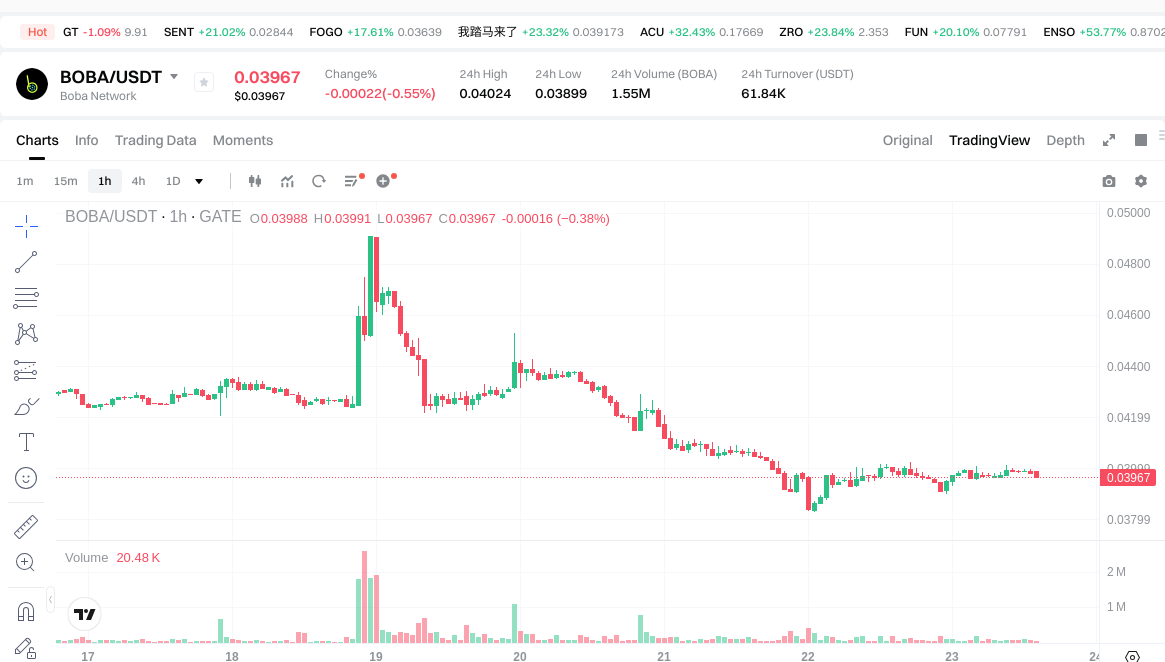
As of January 23, 2026, BOBA is trading at $0.03982, showing a modest 24-hour increase of 0.15%. The token's 24-hour trading range has been between $0.03899 and $0.04024, with a total trading volume of $63,374.05.
BOBA currently holds the 892nd position in the cryptocurrency market rankings, with a circulating market capitalization of approximately $19.66 million. The token has 493,599,306 coins in circulation, representing 98.72% of its maximum supply of 500,000,000 tokens. The fully diluted market capitalization stands at $19.91 million, with a market share of 0.00062%.
Over different time horizons, BOBA has demonstrated varied performance: a decline of 0.22% in the past hour, a decrease of 6.68% over the past week, a gain of 2.29% over the past month, and a decline of 78.96% over the past year. The token is currently held by 11,979 addresses and is listed on 12 exchanges.
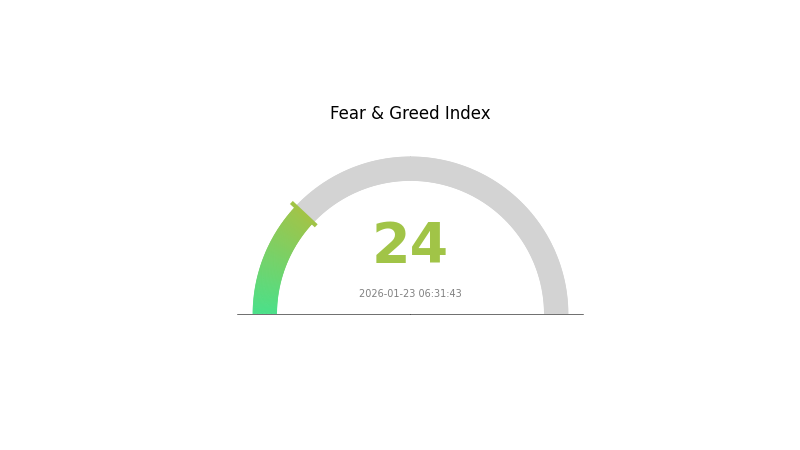
The current market sentiment index stands at 24, indicating an "Extreme Fear" condition in the broader market environment.
Click to view current BOBA market price
BOBA Market Sentiment Indicator
2026-01-23 Fear and Greed Index: 24 (Extreme Fear)
Click to view the current Fear & Greed Index
The cryptocurrency market is experiencing extreme fear, with the Fear and Greed Index at 24. This indicates significant market pessimism and heightened risk aversion among investors. Such extreme conditions often present contrarian opportunities for long-term investors. Market participants should exercise caution while remaining alert to potential entry points. Monitor key support levels and maintain disciplined risk management strategies during this volatile period on Gate.com.
BOBA Holdings Distribution
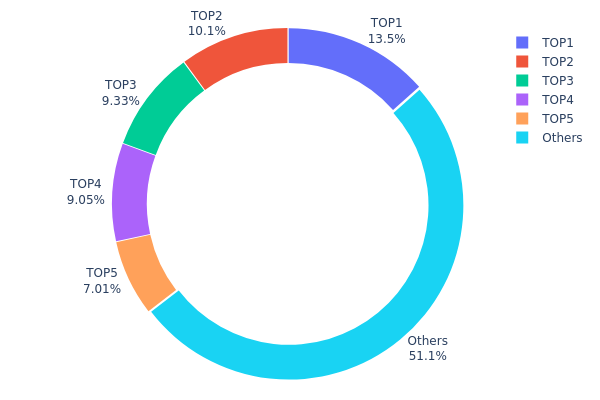
The holdings distribution chart represents the concentration of token ownership across different wallet addresses, providing insights into the decentralization level and potential market control dynamics. By analyzing the percentage of total supply held by top addresses versus smaller holders, researchers can assess the risk of price manipulation and the overall health of token distribution.
Based on the current data, BOBA exhibits a moderately concentrated distribution pattern. The top five addresses collectively control approximately 48.88% of the total supply, with the largest holder commanding 13.45% (67.30M tokens), followed by 10.07%, 9.32%, 9.04%, and 7.00% respectively. The remaining 51.12% is distributed among other addresses, indicating a relatively balanced structure compared to highly centralized projects where top holders may control 70-80% or more.
This distribution level suggests moderate centralization that warrants careful monitoring. While the top holder's 13.45% stake is significant, the absence of a single dominant whale controlling over 20-30% of supply reduces the immediate risk of unilateral market manipulation. However, the collective influence of the top five addresses at nearly 49% means coordinated selling could trigger substantial price volatility. The "Others" category holding 51.12% demonstrates reasonable decentralization at the broader level, which typically contributes to more organic price discovery and reduces vulnerability to single-point failures in market liquidity.
Click to view current BOBA Holdings Distribution
| Top |
Address |
Holding Qty |
Holding (%) |
| 1 |
0x1279...876bde |
67297.97K |
13.45% |
| 2 |
0x62cd...fec4cf |
50364.60K |
10.07% |
| 3 |
0x001f...1cc068 |
46645.08K |
9.32% |
| 4 |
0x48f3...dce070 |
45246.39K |
9.04% |
| 5 |
0x3727...866be8 |
35033.93K |
7.00% |
| - |
Others |
255412.02K |
51.12% |
II. Core Factors Influencing BOBA's Future Price
Based on the currently available information, there is insufficient data to provide a comprehensive analysis of the core factors that may influence BOBA's future price. The specific details regarding supply mechanisms, institutional dynamics, macroeconomic environment impacts, and technical developments are not available in the provided materials.
As market conditions evolve and more information becomes available, these factors may be analyzed to better understand potential price influences on BOBA.
III. 2026-2031 BOBA Price Prediction
2026 Outlook
- Conservative prediction: $0.03729 - $0.03967
- Neutral prediction: approximately $0.03967
- Optimistic prediction: up to $0.04562 (requires favorable market conditions)
2027-2029 Outlook
- Market stage expectation: transitional phase with gradual growth momentum
- Price range predictions:
- 2027: $0.02943 - $0.06311
- 2028: $0.02961 - $0.06822
- 2029: $0.05207 - $0.08598
- Key catalysts: ecosystem development, technological improvements, and broader market adoption could drive price appreciation during this period
2030-2031 Long-term Outlook
- Baseline scenario: $0.05568 - $0.07326 (assuming steady ecosystem growth)
- Optimistic scenario: $0.07986 - $0.08645 (with accelerated adoption and network effects)
- Transformative scenario: approaching $0.09343 (under exceptional conditions including breakthrough partnerships and significant protocol upgrades)
- 2026-01-23: BOBA trading within the predicted range (early consolidation phase)
| Year |
Predicted High Price |
Predicted Average Price |
Predicted Low Price |
Price Change |
| 2026 |
0.04562 |
0.03967 |
0.03729 |
0 |
| 2027 |
0.06311 |
0.04265 |
0.02943 |
7 |
| 2028 |
0.06822 |
0.05288 |
0.02961 |
32 |
| 2029 |
0.08598 |
0.06055 |
0.05207 |
52 |
| 2030 |
0.08645 |
0.07326 |
0.05568 |
83 |
| 2031 |
0.09343 |
0.07986 |
0.05909 |
100 |
IV. BOBA Professional Investment Strategy and Risk Management
BOBA Investment Methodology
(1) Long-term Holding Strategy
- Suitable for: Investors believing in Layer 2 scaling solutions and Ethereum ecosystem expansion
- Operational Recommendations:
- Accumulate positions during market corrections when BOBA trades near support levels
- Monitor development progress of Boba Network's Optimistic Rollup technology and ecosystem growth
- Utilize Gate Web3 Wallet for secure storage with multi-signature functionality
(2) Active Trading Strategy
- Technical Analysis Tools:
- Moving Averages: Use 20-day and 50-day MAs to identify trend directions and potential entry/exit points
- Volume Analysis: Monitor 24-hour trading volume (currently $63,374) for breakout confirmations
- Swing Trading Key Points:
- Consider the current 24-hour price range between $0.03899 and $0.04024 for short-term positioning
- Set stop-loss orders 3-5% below entry points to manage downside risk
BOBA Risk Management Framework
(1) Asset Allocation Principles
- Conservative Investors: 1-3% of crypto portfolio
- Aggressive Investors: 5-8% of crypto portfolio
- Professional Investors: Up to 10-15% with hedging strategies
(2) Risk Hedging Solutions
- Diversification: Combine BOBA with other Layer 2 tokens and established assets to reduce concentration risk
- Position Sizing: Scale into positions gradually rather than committing full allocation at once
(3) Secure Storage Solutions
- Hot Wallet Recommendation: Gate Web3 Wallet for active trading and convenient access
- Cold Storage Solution: Hardware wallet solutions for long-term holdings exceeding $10,000
- Security Precautions: Enable two-factor authentication, verify contract addresses (0x42bbfa2e77757c645eeaad1655e0911a7553efbc on Ethereum), and never share private keys
V. BOBA Potential Risks and Challenges
BOBA Market Risks
- High Volatility: BOBA experienced a 78.96% decline over the past year, demonstrating significant price fluctuation potential
- Low Liquidity: With 24-hour trading volume of $63,374 and market cap of approximately $19.66 million, large trades may face slippage
- Limited Exchange Presence: Trading on 12 exchanges, which may restrict accessibility compared to more widely listed assets
BOBA Regulatory Risks
- Layer 2 Classification Uncertainty: Evolving regulatory frameworks may impact how Layer 2 solutions are classified and governed
- Cross-border Compliance: As a network facilitating transactions, Boba Network may face varying regulatory requirements across jurisdictions
- DAO Governance Scrutiny: Regulatory bodies may examine decentralized governance models and token voting mechanisms
BOBA Technical Risks
- Smart Contract Vulnerabilities: Despite audits, complex DeFi protocols and Optimistic Rollup mechanisms may contain undiscovered bugs
- Bridge Security: Fast exit mechanisms relying on liquidity pools introduce potential attack vectors
- Network Dependency: Heavy reliance on Ethereum mainnet means any Ethereum issues could impact Boba Network operations
VI. Conclusion and Action Recommendations
BOBA Investment Value Assessment
BOBA presents a speculative opportunity within the Layer 2 scaling narrative, offering governance rights in an Optimistic Rollup solution focused on reducing gas fees and improving transaction throughput. The project's unique fast-exit mechanism and hybrid compute capabilities distinguish it technically. However, significant price decline of 78.96% year-over-year, combined with relatively low market capitalization of $19.66 million and limited liquidity, indicates substantial risk. Current circulating supply represents 98.72% of maximum supply, minimizing inflation concerns. The token's proximity to its all-time low of $0.03839995 (reached January 22, 2026) may present contrarian opportunities, though requires careful consideration of continued downward pressure. Long-term value depends on Boba Network's ability to compete in the increasingly crowded Layer 2 space and achieve meaningful adoption.
BOBA Investment Recommendations
✅ Beginners: Limit exposure to under 2% of crypto portfolio, focus on education about Layer 2 technology before investing, and start with small test transactions
✅ Experienced Investors: Consider 3-5% allocation as part of a diversified Layer 2 basket, implement dollar-cost averaging during accumulation phases, and actively monitor technical developments
✅ Institutional Investors: Conduct thorough due diligence on Boba Network's competitive positioning, evaluate liquidity requirements carefully given current trading volumes, and consider strategic positions aligned with Layer 2 thesis
BOBA Trading Participation Methods
- Spot Trading: Purchase BOBA directly on Gate.com with USDT or other base pairs for straightforward exposure
- Grid Trading: Utilize automated grid trading strategies to capitalize on BOBA's price fluctuations within defined ranges
- Staking Participation: Hold and stake BOBA tokens to participate in governance voting and earn potential rewards through the Boba DAO
Cryptocurrency investment carries extreme risk, and this article does not constitute investment advice. Investors should make cautious decisions based on their own risk tolerance and are advised to consult professional financial advisors. Never invest more than you can afford to lose.
FAQ
What is the current price of BOBA token? What are its all-time high and all-time low prices?
BOBA's current price fluctuates based on market conditions. All-time high reached approximately $0.60, while all-time low was around $0.02. Check real-time prices for current market data.
What are the main factors influencing BOBA's price?
BOBA's price is primarily influenced by network adoption and ecosystem development, trading volume and market sentiment, Bitcoin and broader crypto market trends, protocol upgrades and technical improvements, and competition from other Layer 2 solutions.
How to conduct technical analysis and price prediction for BOBA tokens?
Analyze BOBA using key indicators: support/resistance levels, moving averages, RSI, and trading volume trends. Monitor network activity, developer updates, and market sentiment. Consider historical price patterns and correlation with major cryptocurrencies for comprehensive forecasting.
How does BOBA's price compare to other Layer 2 solution tokens like ARB and OP?
BOBA typically trades at lower valuations than ARB and OP, reflecting its smaller market cap and ecosystem scale. However, BOBA has shown strong growth potential with increasing adoption on Ethereum's scaling ecosystem, positioning it competitively among Layer 2 tokens.
What are the main risks of investing in BOBA tokens?
BOBA token risks include market volatility, regulatory uncertainty, technology execution risks, liquidity fluctuations, and competition from other Layer 2 solutions. Price can fluctuate significantly based on market sentiment and ecosystem development progress.
What are the development prospects and ecosystem construction progress of Boba Network?
Boba Network demonstrates strong ecosystem growth with expanding DeFi applications, NFT infrastructure, and cross-chain interoperability. Strategic partnerships and layer-2 optimization enhance scalability. Continuous protocol upgrades and developer incentives drive innovation, positioning Boba favorably within the competitive blockchain landscape.
How is the liquidity and trading volume of BOBA tokens? On which exchanges can it be traded?
BOBA maintains strong liquidity with substantial daily trading volume across major platforms. The token is actively traded on leading centralized exchanges, ensuring efficient price discovery and accessible trading for users worldwide.
What are professional analysts' price predictions for BOBA?
Professional analysts project BOBA could reach $0.8-1.2 by end of 2026, driven by ecosystem expansion and increased adoption. Long-term forecasts suggest potential growth to $2-3 levels within 2-3 years based on protocol developments and market recovery trends.
* The information is not intended to be and does not constitute financial advice or any other recommendation of any sort offered or endorsed by Gate.