This comprehensive article provides expert analysis of BOME (Book of Meme), a Solana-based meme token trading at $0.0005994 as of January 2026. It examines BOME's market evolution from its March 2024 launch peak of $0.028312 to current levels, analyzing price history, market sentiment, and token distribution patterns. The article delivers detailed price predictions spanning 2026-2031, with 2026 forecasts ranging from $0.00055 to $0.00069, potentially reaching $0.00139 by 2031. It outlines professional investment strategies for various investor types on Gate, including long-term holding and active trading approaches, while emphasizing critical risk management frameworks and addressing regulatory, liquidity, and volatility challenges. Suitable for speculators seeking BOME market insights and investment guidance.
Introduction: BOME's Market Position and Investment Value
BOOK OF MEME (BOME), as a meme token on the Solana blockchain, has been capturing attention since its launch in 2024. As of 2026, BOME maintains a market capitalization of approximately $41.36 million, with a circulating supply of around 69 billion tokens and a price hovering near $0.0005994. This asset, associated with artist @DarkFarms1 (also known as the Doodle Master), represents a unique intersection of digital art culture and cryptocurrency within the expanding meme coin sector.
This article will comprehensively analyze BOME's price trajectory from 2026 to 2031, examining historical patterns, market supply and demand dynamics, ecosystem development, and macroeconomic conditions to provide investors with professional price forecasts and practical investment strategies.
I. BOME Price History Review and Current Market Status
BOME Historical Price Evolution Trajectory
- March 2024: Token launched on Solana blockchain with initial price of $0.0000588, experiencing significant volatility in early trading phase
- March 16, 2024: Price reached peak level at $0.028312, marking a notable milestone during the project's initial market cycle
- October 10, 2025: Price touched lowest recorded level at $0.0003723, reflecting broader market adjustment patterns
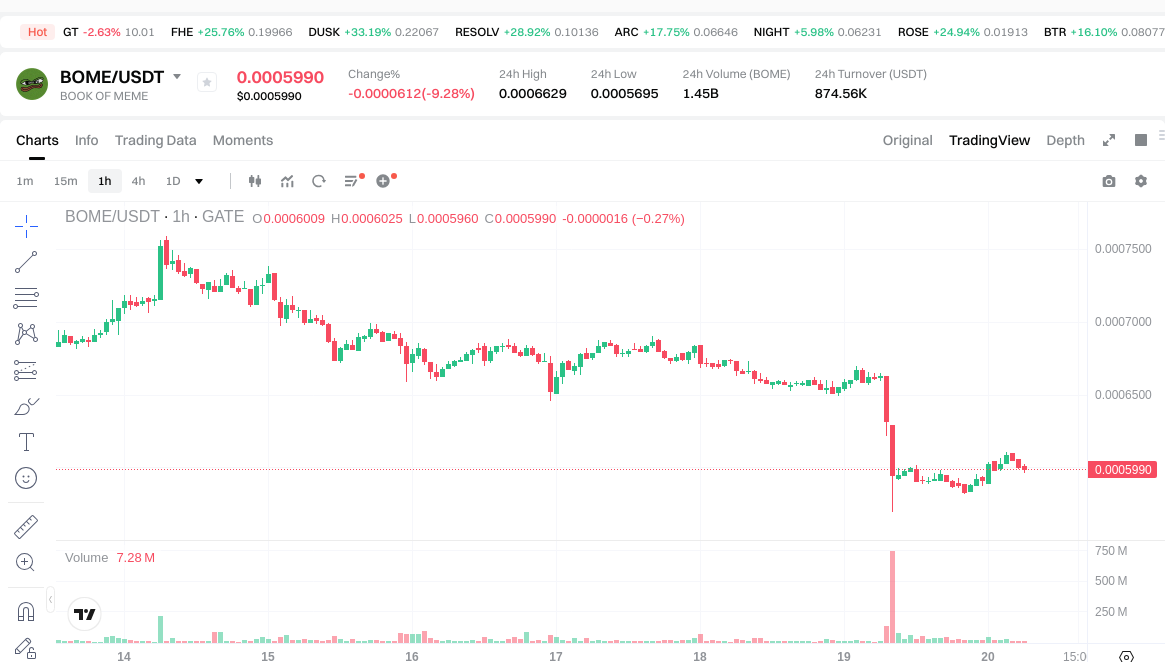
- January 2026: Current trading phase shows price stabilization around $0.0005994 level
BOME Current Market Status
As of January 20, 2026, BOOK OF MEME is trading at $0.0005994, with 24-hour trading volume reaching $873,207.01. The token has shown negative price movement across short-term timeframes, declining 0.32% in the past hour and 9.45% over the past 24 hours. The 7-day performance indicates a 10.97% decrease.
The project maintains a fully circulating supply of 68,999,659,569 BOME tokens, with total market capitalization standing at $41,358,395.95. The market cap to fully diluted valuation ratio remains at 100%, indicating complete token circulation. BOME currently holds market dominance of 0.0012% within the broader cryptocurrency ecosystem.
Over the past 30 days, the token has demonstrated slight positive momentum with a 0.37% increase, though the yearly performance reflects an 89.42% decline from previous levels. The 24-hour price range spans between $0.0005695 and $0.0006629. Market sentiment indicators suggest a fear-level reading of 44 on the volatility index.
The token is listed on 42 cryptocurrency exchanges and holds 88,749 wallet addresses, utilizing the SPL-20 standard on the Solana network. BOME represents a meme token project associated with artist @DarkFarms1, also recognized as the Doodle Master.
Click to view current BOME market price
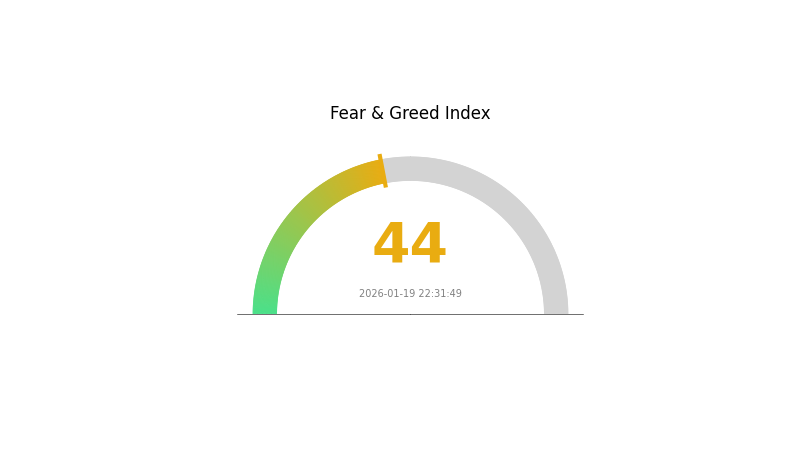
BOME Market Sentiment Indicator
2026-01-19 Fear and Greed Index: 44 (Fear)
Click to view current Fear & Greed Index
The crypto market is currently experiencing a fear sentiment with an index reading of 44. This level indicates heightened market caution and investor anxiety regarding price movements. During fear periods, selling pressure typically increases as traders become risk-averse. However, contrarian investors often view such conditions as potential buying opportunities, as fear can create favorable entry points for long-term holders. Monitor market developments closely and consider your risk tolerance before making trading decisions. Stay informed through Gate.com's comprehensive market data and analysis tools.
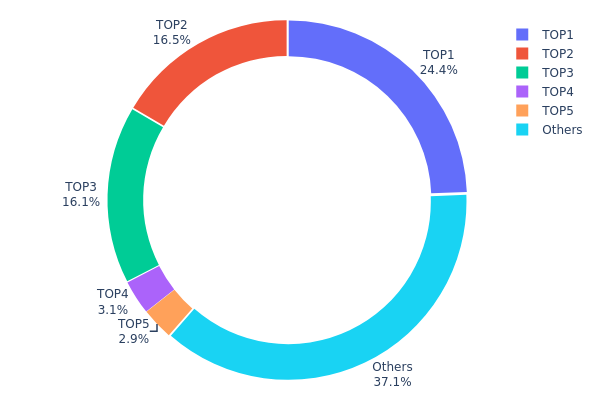
BOME Holding Distribution
The holding distribution chart reflects the concentration of tokens across different wallet addresses on the blockchain, providing critical insights into the degree of decentralization and potential market manipulation risks. By analyzing the proportion of tokens held by top addresses versus the broader holder base, we can assess whether the token supply is controlled by a small group of whales or distributed more evenly across the community.
According to the current data, BOME exhibits a notably high concentration pattern. The top three addresses collectively control approximately 56.93% of the total token supply, with the largest single address holding 24.39% (16.8 billion tokens). Specifically, the first-ranked address holds 16,806,299.05K tokens, followed by the second and third addresses with 11,364,141.38K and 11,061,601.60K tokens respectively. The top five addresses account for 62.92% of total holdings, while the remaining 37.08% is distributed among other holders. This concentration level significantly exceeds typical thresholds for healthy decentralization, where top holders controlling over 50% of supply generally indicates elevated centralization risks.
Such high concentration presents multiple implications for market structure. First, this distribution pattern grants substantial price influence to a limited number of entities, potentially enabling coordinated market movements or triggering sharp volatility through large-scale sell-offs. Second, the dominance of whale addresses may discourage retail participation due to perceived manipulation risks, thereby constraining organic liquidity development. From an on-chain structural perspective, this concentration creates inherent instability, as market sentiment remains vulnerable to the trading decisions of these major holders. The current holding pattern suggests BOME operates with relatively weak decentralization characteristics, maintaining a chain structure heavily dependent on large address behavior rather than demonstrating the robust distributed ownership typically associated with mature cryptocurrency projects.
View current BOME Holding Distribution
| Top |
Address |
Holding Qty |
Holding (%) |
| 1 |
3gd3dq...hCkW2u |
16806299.05K |
24.39% |
| 2 |
5Q544f...pge4j1 |
11364141.38K |
16.49% |
| 3 |
9WzDXw...YtAWWM |
11061601.60K |
16.05% |
| 4 |
5LZkAT...mtboT2 |
2138914.72K |
3.10% |
| 5 |
CBEADk...sebkVG |
1996733.11K |
2.89% |
| - |
Others |
25527613.49K |
37.08% |
II. Core Factors Influencing BOME's Future Price
Based on the available information, specific details regarding BOME's supply mechanism, institutional dynamics, macroeconomic environment impact, and technical development are not currently accessible through the provided materials. As market conditions evolve and more data becomes available, these factors may provide additional insights into BOME's price trajectory.
Investors interested in BOME should monitor official project announcements and conduct thorough research before making investment decisions. Trading cryptocurrencies involves significant risk, and past performance does not guarantee future results.
III. 2026-2031 BOME Price Predictions
2026 Outlook
- Conservative Forecast: $0.00055 - $0.00060
- Neutral Forecast: $0.00060 average trading range
- Optimistic Forecast: Up to $0.00069 (requires sustained market momentum and broader crypto market recovery)
2027-2029 Mid-Term Outlook
- Market Phase Expectation: Gradual accumulation phase with modest volatility, potential consolidation period as the token establishes pricing stability
- Price Range Predictions:
- 2027: $0.00037 - $0.0007 (approximately 7% potential growth)
- 2028: $0.00034 - $0.001 (approximately 12% expansion possibility)
- 2029: $0.00069 - $0.00095 (approximately 39% growth trajectory)
- Key Catalysts: Market adoption rates, ecosystem development progress, overall cryptocurrency market sentiment shifts, and potential technological integrations
2030-2031 Long-Term Outlook
- Baseline Scenario: $0.00054 - $0.00113 range (assuming stable market conditions and continued project development)
- Optimistic Scenario: $0.00089 - $0.00139 (contingent upon increased adoption, favorable regulatory environment, and successful partnerships)
- Transformation Scenario: Potential to reach $0.00139 by 2031 (requires breakthrough developments, significant user base expansion, and exceptional market conditions with approximately 68% cumulative growth)
- 2026-01-20: BOME trading within early-year consolidation range, establishing foundation for potential future growth phases
| Year |
Predicted High Price |
Predicted Average Price |
Predicted Low Price |
Price Change |
| 2026 |
0.00069 |
0.0006 |
0.00055 |
0 |
| 2027 |
0.0007 |
0.00064 |
0.00037 |
7 |
| 2028 |
0.001 |
0.00067 |
0.00034 |
12 |
| 2029 |
0.00095 |
0.00083 |
0.00069 |
39 |
| 2030 |
0.00113 |
0.00089 |
0.00054 |
48 |
| 2031 |
0.00139 |
0.00101 |
0.00096 |
68 |
IV. BOME Professional Investment Strategy and Risk Management
BOME Investment Methodology
(I) Long-term Holding Strategy
- Target Investors: Investors with high risk tolerance who believe in the long-term potential of meme tokens and the Solana ecosystem
- Operational Recommendations:
- Consider accumulating positions during market downturns, particularly when BOME trades near support levels around $0.00057
- Monitor Solana network developments and adoption trends that may positively impact meme tokens
- Implement a secure storage solution using Gate Web3 Wallet or other reputable wallets supporting Solana SPL-20 tokens
(II) Active Trading Strategy
- Technical Analysis Tools:
- Moving Averages: Use 7-day and 30-day moving averages to identify trend reversals, noting BOME's recent 10.97% decline over 7 days versus 0.37% gain over 30 days
- Volume Analysis: Monitor daily trading volume (currently around $873,207) for breakout signals and liquidity assessment
- Swing Trading Considerations:
- Set stop-loss orders given BOME's high volatility, with 24-hour price ranges between $0.0005695 and $0.0006629
- Consider profit-taking strategies as BOME remains 97.88% below its all-time high of $0.028312
BOME Risk Management Framework
(I) Asset Allocation Principles
- Conservative Investors: 1-2% of crypto portfolio allocation
- Aggressive Investors: 3-5% of crypto portfolio allocation
- Professional Investors: Up to 10% with active hedging strategies
(II) Risk Hedging Solutions
- Portfolio Diversification: Balance BOME holdings with established cryptocurrencies and stablecoins to mitigate meme token volatility
- Position Sizing: Avoid overconcentration, considering BOME's 89.42% decline over the past year
(III) Secure Storage Solutions
- Web3 Wallet Recommendation: Gate Web3 Wallet for convenient access and integrated trading features
- Cold Storage Solution: Consider hardware wallet solutions for long-term holdings exceeding $1,000
- Security Precautions: Enable two-factor authentication, verify contract address (ukHH6c7mMyiWCf1b9pnWe25TSpkDDt3H5pQZgZ74J82), and avoid sharing private keys
V. BOME Potential Risks and Challenges
BOME Market Risks
- Extreme Volatility: BOME has experienced significant price fluctuations, declining 9.45% in 24 hours and 89.42% over the past year
- Liquidity Concerns: With a market capitalization of approximately $41.36 million and daily volume around $873,207, large transactions may impact price stability
- Meme Token Dependency: Value is heavily influenced by social media trends and community sentiment rather than fundamental utility
BOME Regulatory Risks
- Classification Uncertainty: Meme tokens face potential scrutiny from regulatory authorities regarding their classification and trading practices
- Exchange Listing Risk: Changes in exchange policies could affect BOME's accessibility across its current 42 listed platforms
- Compliance Evolution: Evolving cryptocurrency regulations may impact meme token trading and taxation
BOME Technical Risks
- Smart Contract Dependency: BOME relies on Solana blockchain infrastructure and SPL-20 token standard security
- Network Congestion: Solana network performance issues could affect transaction speed and costs
- Project Development: Limited information about ongoing technical development or roadmap updates
VI. Conclusion and Action Recommendations
BOME Investment Value Assessment
BOME represents a speculative meme token investment within the Solana ecosystem, associated with artist @DarkFarms1. With 100% of its 68.99 billion token supply in circulation and over 88,749 holders, it demonstrates some community engagement. However, the token has declined significantly from its March 2024 peak of $0.028312 to its current price around $0.0005994, reflecting substantial volatility and risk. The token's value is primarily driven by community sentiment and meme culture rather than fundamental utility, making it suitable only for high-risk speculators. Short-term prospects remain uncertain given recent downward trends, while long-term value depends on sustained community interest and broader meme token market dynamics.
BOME Investment Recommendations
✅ Beginners: Allocate only small amounts you can afford to lose completely (1-2% of total crypto holdings), focus on learning about meme token dynamics before investing significantly
✅ Experienced Investors: Consider BOME as a speculative position within a diversified portfolio, implement strict stop-loss orders, and monitor social media sentiment actively
✅ Institutional Investors: Exercise extreme caution due to limited liquidity and high volatility; if participating, use minimal position sizes for tactical trading opportunities only
BOME Trading Participation Methods
- Spot Trading: Purchase BOME directly on Gate.com and other supported exchanges with immediate settlement
- Dollar-Cost Averaging: Spread purchases over time to mitigate timing risk and reduce exposure to extreme volatility
- Research-Based Approach: Follow artist @DarkFarms1 on social media and monitor community developments before making investment decisions
Cryptocurrency investment carries extremely high risks, and this article does not constitute investment advice. Investors should make cautious decisions based on their own risk tolerance and are advised to consult professional financial advisors. Never invest more than you can afford to lose.
FAQ
What is BOME and what is its purpose in the cryptocurrency market?
BOME is a meme-based cryptocurrency token designed for community engagement and decentralized transactions. It operates on blockchain technology, enabling peer-to-peer transfers with low fees. BOME serves as a utility token within its ecosystem, facilitating trading, staking, and community governance participation.
What factors influence BOME token price movements and predictions?
BOME price is influenced by market sentiment, trading volume, community engagement, tokenomics, broader crypto market trends, and Bitcoin's price movement. Increased adoption and social media activity typically drive bullish predictions, while market volatility and macro factors create downside pressure.
BOME token launched in 2024 with strong initial momentum, reaching peak prices in early trading. The token has demonstrated volatile price swings typical of meme coins, with significant trading activity. Performance varies based on market conditions and community engagement levels.
Monitor BOME trading volume and transaction value patterns, analyze technical indicators like moving averages and RSI, track market sentiment across social channels, and study historical price support/resistance levels to identify trend direction and potential entry points for informed decision-making.
What are the risks associated with BOME price volatility and investment?
BOME price volatility stems from market demand fluctuations, low liquidity periods, and sentiment shifts. Investment risks include potential losses from sudden price swings, reduced market depth during low-volume periods, and exposure to regulatory changes affecting the crypto market broadly.
What are expert price predictions for BOME in the short and long term?
Short-term predictions suggest BOME could reach $0.015-$0.025 by Q2 2026 based on market momentum. Long-term analysts project $0.05-$0.15 by 2028, driven by ecosystem development and adoption growth. Price trajectories depend on market conditions and community engagement.
* The information is not intended to be and does not constitute financial advice or any other recommendation of any sort offered or endorsed by Gate.