This comprehensive guide analyzes BONE token's price trajectory from 2026 to 2031, providing expert forecasts for the governance token of Shibarium Layer-2 network. Currently trading at $0.077 with a market cap of $19.25 million, BONE faces extreme market fear (index: 24) amid a 78.8% annual decline. The article examines historical performance, market sentiment, holding distribution, and predicts potential price ranges: $0.0548-$0.09263 for 2026, escalating to $0.12587-$0.17856 by 2031 under favorable conditions. It offers practical investment strategies including long-term accumulation and active trading approaches, alongside comprehensive risk management frameworks for conservative to aggressive investors. Essential reading for traders seeking professional analysis on Gate exchange and actionable recommendations for BONE's future market positioning.
Introduction: BONE's Market Position and Investment Value
Bone ShibaSwap (BONE) serves as the foundational governance token of the Shibarium Layer-2 network built by the Shib Army. Since its launch in 2021, BONE has established itself as a crucial component of the ShibaSwap ecosystem. As of January 23, 2026, BONE maintains a market capitalization of approximately $19.25 million, with a circulating supply of around 249.89 million tokens, and is currently trading at $0.077. This asset, recognized as the governance backbone of the Shib ecosystem, plays an increasingly vital role in network gas payments, validator voting, and node rewards within the Shibarium network.
This article provides a comprehensive analysis of BONE's price trajectory from 2026 to 2031, examining historical patterns, market supply and demand dynamics, ecosystem development, and macroeconomic factors to deliver professional price forecasts and practical investment strategies for investors.
I. BONE Price History Review and Market Status
BONE Historical Price Evolution Trajectory
- 2021: BONE was launched in July with its initial listing on ShibaSwap, reaching a peak of $15.5 on July 7th during the early meme token enthusiasm wave
- 2021: Following the initial surge, the token experienced significant correction, dropping to $0.075 by August 13th as market sentiment cooled
- 2025-2026: The token has undergone a prolonged bearish cycle, with price declining by 78.8% over the past year, reflecting broader challenges in the meme token sector
BONE Current Market Situation
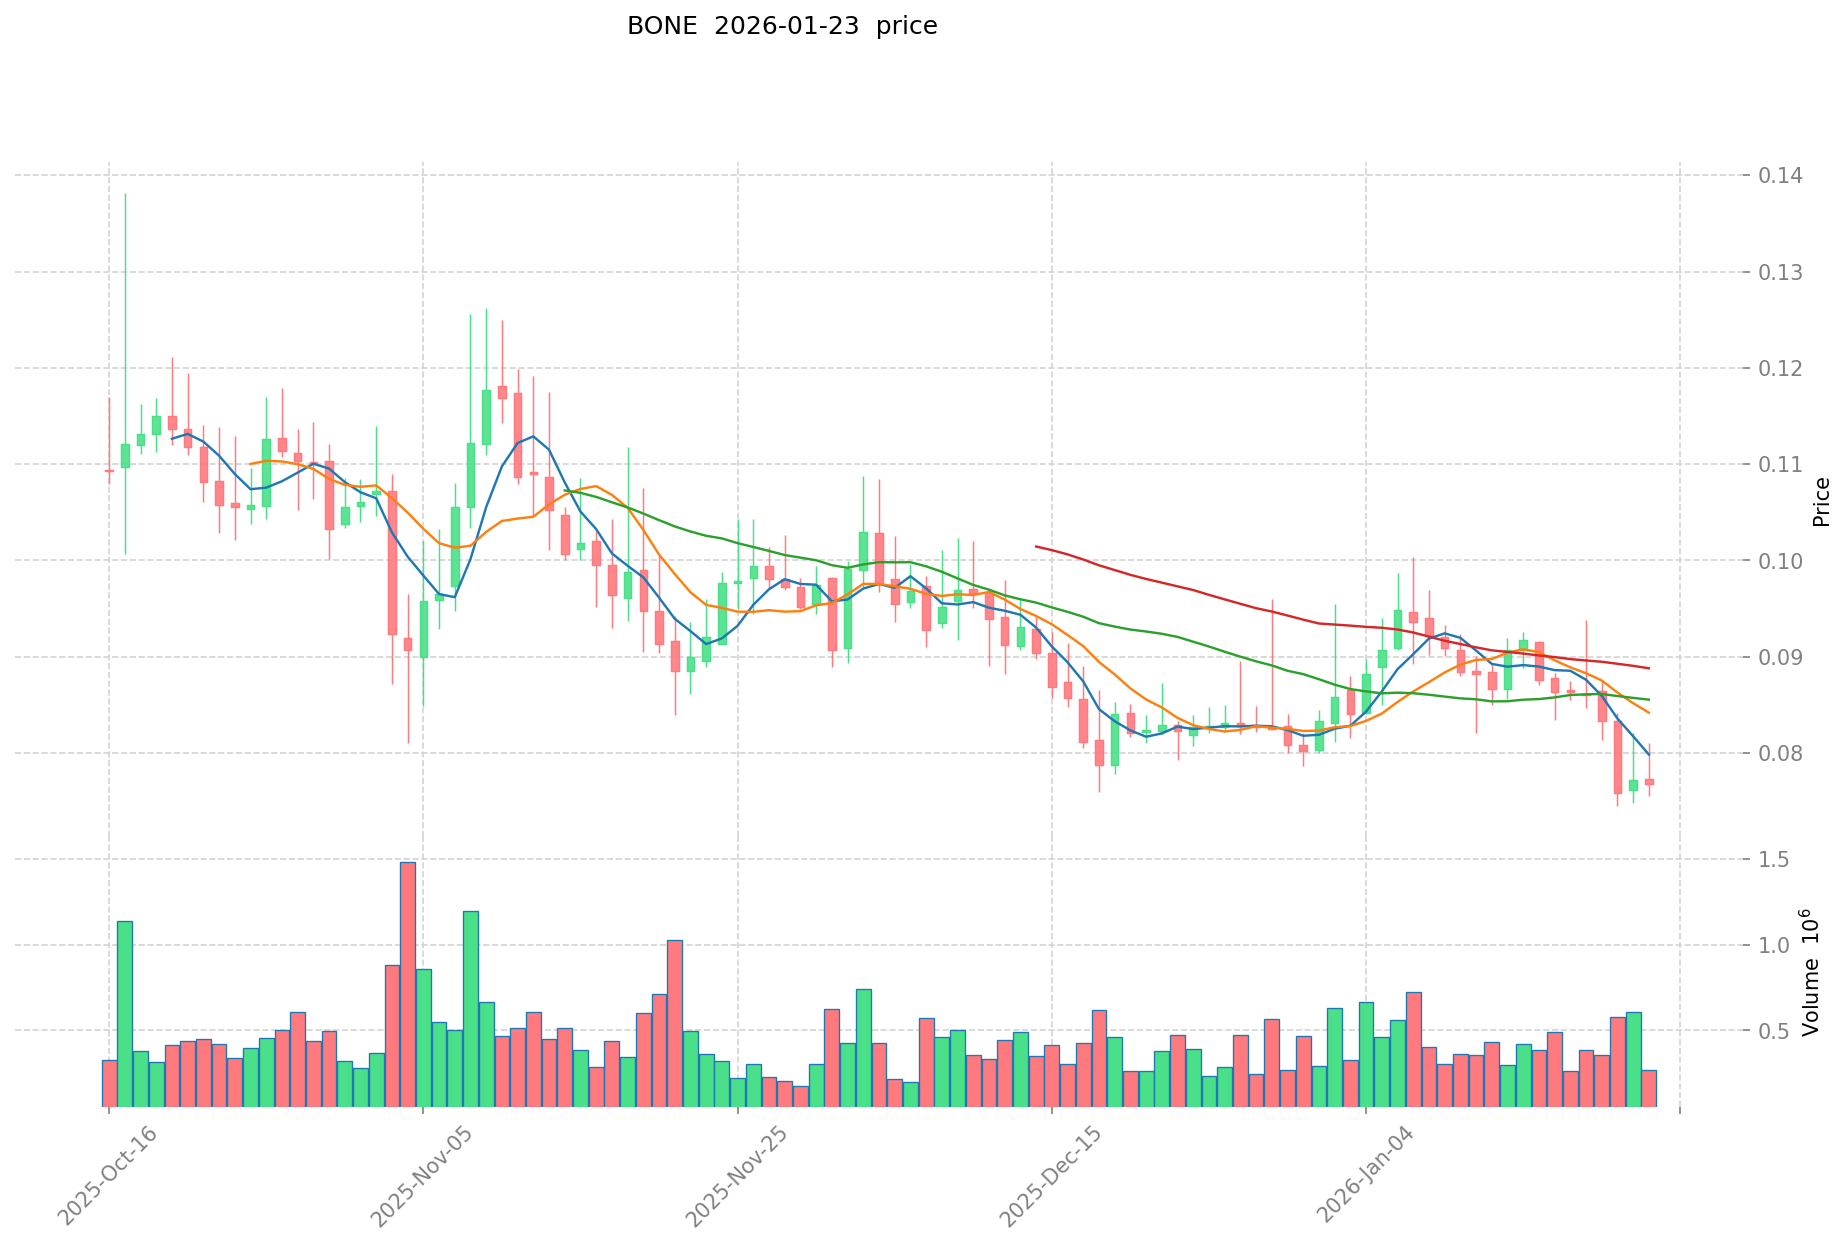
As of January 23, 2026, BONE is trading at $0.07703, showing a slight decline of 0.45% over the past 24 hours. The token's 24-hour trading range spans from $0.07553 to $0.08106, with total trading volume reaching $18,839.53.
The market capitalization stands at approximately $19.25 million, with a circulating supply of 249.89 million tokens representing 99.96% of the maximum supply of 250 million tokens. The market cap to fully diluted valuation ratio of 99.96% indicates minimal additional token dilution risk.
Recent price performance shows continued downward pressure, with the token declining 0.21% in the past hour, 11.89% over the past week, and 6.3% over the past month. BONE currently holds the 900th position in market ranking with a market dominance of 0.00060%.
The token maintains a holder base of approximately 93,513 addresses and is listed on 10 exchanges. According to market sentiment indicators, the current fear and greed index stands at 24, reflecting an "Extreme Fear" environment in the broader market.
Click to view current BONE market price
BONE Market Sentiment Indicator
2026-01-23 Fear and Greed Index: 24 (Extreme Fear)
Click to view current Fear & Greed Index
The BONE market is currently experiencing extreme fear with an index reading of 24. This exceptionally low sentiment level indicates significant market pessimism and investor anxiety. During such periods of extreme fear, experienced traders often view it as a potential contrarian signal, as markets historically tend to recover from overly fearful conditions. However, investors should exercise caution and conduct thorough due diligence. Risk management strategies remain crucial when market sentiment reaches such extreme levels. Consider your investment timeline and risk tolerance before making trading decisions in this volatile environment.

BONE Holding Distribution
The holding distribution chart reflects the allocation of BONE tokens across different addresses on the blockchain, revealing the degree of centralization or decentralization in token ownership. This metric serves as a crucial indicator of market structure health, as excessive concentration among top holders can potentially amplify price volatility and increase susceptibility to market manipulation.
According to the current data, the top 5 addresses collectively hold 30.77% of the total BONE supply, with the largest single address controlling 7.63% (19,095.38K BONE), followed by the second-largest at 7.19% (17,981.37K BONE). While this concentration level indicates a relatively moderate centralization pattern, the remaining 69.23% distributed among other addresses suggests a reasonable degree of decentralization. This distribution structure demonstrates that BONE maintains a balanced ecosystem where no single entity possesses overwhelming control, thereby mitigating the risk of unilateral market manipulation.
The current holding distribution pattern presents both opportunities and considerations for market participants. The moderate concentration among top holders provides sufficient liquidity depth for large transactions while preventing extreme price slippage. However, movements by these major holders could still trigger noticeable price fluctuations, particularly during periods of low trading volume. The substantial percentage held by smaller addresses reflects healthy retail participation and community engagement, which contributes to the token's long-term stability and organic price discovery mechanisms. This distribution structure indicates a maturing market with established institutional presence alongside active retail participation, fostering a more resilient on-chain ecosystem.
Click to view current BONE Holding Distribution

| Top |
Address |
Holding Qty |
Holding (%) |
| 1 |
0xf585...0509a0 |
19095.38K |
7.63% |
| 2 |
0x3cc9...aecf18 |
17981.37K |
7.19% |
| 3 |
0xbab4...225e96 |
16600.00K |
6.64% |
| 4 |
0x885f...32c995 |
11964.31K |
4.78% |
| 5 |
0xefb4...20a477 |
11333.55K |
4.53% |
| - |
Others |
173024.80K |
69.23% |
II. Core Factors Affecting BONE's Future Price
Based on the provided materials, there is insufficient specific information available regarding BONE's supply mechanisms, institutional dynamics, macroeconomic environment impact, or technical development details to complete a comprehensive analysis at this time.
III. 2026-2031 BONE Price Prediction
2026 Outlook
- Conservative Prediction: $0.0548 - $0.07719
- Neutral Prediction: Around $0.07719
- Optimistic Prediction: Up to $0.09263 (requires favorable market conditions)
2027-2029 Outlook
- Market Stage Expectation: BONE may enter a moderate growth phase, with expected year-over-year increases ranging from 10% to 43%
- Price Range Predictions:
- 2027: $0.07302 - $0.10953
- 2028: $0.06514 - $0.12444
- 2029: $0.06982 - $0.12524
- Key Catalysts: Ecosystem development progress, broader crypto market sentiment, and potential technological upgrades within the Shiba Inu ecosystem
2030-2031 Long-term Outlook
- Baseline Scenario: $0.06492 - $0.17469 (assuming steady ecosystem growth)
- Optimistic Scenario: $0.12587 - $0.17856 (with enhanced adoption and favorable market conditions)
- Transformative Scenario: Potential to reach upper ranges near $0.17856 by 2031 (under exceptional conditions including significant ecosystem expansion and widespread adoption)
- 2031-01-23: BONE could potentially see cumulative growth of approximately 90% from 2026 baseline levels (assuming sustained positive momentum)
| Year |
Predicted High Price |
Predicted Average Price |
Predicted Low Price |
Price Change |
| 2026 |
0.09263 |
0.07719 |
0.0548 |
0 |
| 2027 |
0.10953 |
0.08491 |
0.07302 |
10 |
| 2028 |
0.12444 |
0.09722 |
0.06514 |
26 |
| 2029 |
0.12524 |
0.11083 |
0.06982 |
43 |
| 2030 |
0.17469 |
0.11804 |
0.06492 |
53 |
| 2031 |
0.17856 |
0.14636 |
0.12587 |
90 |
IV. BONE Professional Investment Strategy and Risk Management
BONE Investment Methodology
(I) Long-term Holding Strategy
- Suitable for: Investors who believe in the Shiba Inu ecosystem's long-term development and Shibarium network growth
- Operational Recommendations:
- Consider accumulating positions during market corrections when BONE trades near support levels
- Monitor Shibarium network adoption metrics and governance participation rates as key indicators
- Store assets securely using Gate Web3 Wallet for convenient access to DeFi features and governance voting
(II) Active Trading Strategy
- Technical Analysis Tools:
- Support/Resistance Levels: Current key support around $0.075 (near ATL), resistance at $0.081 (24H high)
- Volume Analysis: Monitor 24-hour trading volume trends to identify potential breakout or breakdown scenarios
- Swing Trading Key Points:
- BONE has shown high volatility with 78.8% decline over the past year, offering trading opportunities
- Consider the 7-day performance (-11.89%) and 30-day trends (-6.3%) when planning entry and exit points
BONE Risk Management Framework
(I) Asset Allocation Principles
- Conservative Investors: 1-3% of crypto portfolio
- Aggressive Investors: 5-8% of crypto portfolio
- Professional Investors: May consider up to 10% based on comprehensive risk assessment
(II) Risk Hedging Solutions
- Portfolio Diversification: Balance BONE holdings with other ecosystem tokens and established cryptocurrencies
- Position Sizing: Implement gradual accumulation rather than concentrated purchases to average entry costs
(III) Secure Storage Solutions
- Hot Wallet Recommendation: Gate Web3 Wallet for active trading and governance participation
- Storage Strategy: Regularly monitor wallet security updates and enable multi-factor authentication
- Security Precautions: Never share private keys, verify contract addresses before transactions, and be cautious of phishing attempts
V. BONE Potential Risks and Challenges
BONE Market Risks
- High Volatility: BONE has experienced significant price fluctuations, with a 78.8% decline over the past year
- Low Market Capitalization: With a market cap of approximately $19.25 million and ranking around 900, BONE faces liquidity concerns
- Limited Exchange Availability: Currently listed on 10 exchanges, which may restrict trading volume and price discovery
BONE Regulatory Risks
- Meme Token Classification: Regulatory scrutiny on community-driven tokens may impact future operations
- Governance Token Regulations: Potential classification as a security could affect BONE's utility and distribution
- Compliance Requirements: Evolving regulatory frameworks for DeFi and Layer-2 networks may impose additional obligations
BONE Technical Risks
- Shibarium Network Dependency: BONE's utility is closely tied to Shibarium adoption and network performance
- Smart Contract Vulnerabilities: As with any blockchain project, potential security flaws in underlying infrastructure
- Competition from Other Layer-2 Solutions: Emerging networks may reduce Shibarium's competitive advantage
VI. Conclusion and Action Recommendations
BONE Investment Value Assessment
BONE serves as the governance and gas token for Shibarium, positioning it as a fundamental component of the Shiba Inu ecosystem. While the token offers utility through validator voting and transaction fee payments, investors should consider the significant market risks reflected in its 78.8% annual decline and relatively low market capitalization. The token's value proposition depends heavily on Shibarium network adoption and the broader success of the Shiba Inu ecosystem. Given current market conditions and technical indicators showing downward trends across multiple timeframes, potential investors should approach with caution and maintain realistic expectations.
BONE Investment Recommendations
✅ Beginners: Start with minimal allocation (under 2% of crypto portfolio) and focus on learning about the Shiba Inu ecosystem before increasing exposure
✅ Experienced Investors: Consider BONE as a speculative position with defined risk parameters, monitoring Shibarium network metrics and governance developments
✅ Institutional Investors: Conduct thorough due diligence on Shibarium's technical architecture, ecosystem partnerships, and token economics before considering allocation
BONE Trading Participation Methods
- Spot Trading: Purchase BONE directly through Gate.com for straightforward exposure to price movements
- DeFi Participation: Engage with ShibaSwap for staking and liquidity provision opportunities
- Governance Participation: Hold BONE to vote on ecosystem proposals through Doggy DAO and influence protocol development
Cryptocurrency investment carries extremely high risk, and this article does not constitute investment advice. Investors should make cautious decisions based on their own risk tolerance and are advised to consult professional financial advisors. Never invest more than you can afford to lose.
FAQ
What is BONE token and what is its purpose?
BONE is the governance token of the Shibarium ecosystem, enabling holders to participate in protocol decisions and earn rewards through staking. It facilitates transactions and provides utility within the Shib community network.
BONE has demonstrated notable volatility since its launch. The token experienced significant growth periods with multiple rallies, reaching various price milestones. Historical data shows BONE trading within a dynamic range, influenced by market cycles and ecosystem developments. Long-term trend analysis indicates periods of appreciation alongside typical cryptocurrency market corrections.
What is the BONE price prediction for 2024?
Based on market analysis, BONE was projected to reach $0.15-$0.25 in 2024, driven by increased adoption and ecosystem development. However, actual performance depends on market conditions and project milestones.
What is the difference between BONE and SHIB?
BONE is the governance token of Shibarium Layer 2 blockchain, enabling voting and ecosystem decisions. SHIB is the original meme token with broader utility and larger community. BONE has lower supply and focuses on network participation, while SHIB maintains higher circulation and market liquidity.
What are the circulating supply and total supply of BONE?
BONE has a circulating supply of approximately 389 million tokens and a maximum total supply of 10 billion tokens. The token distribution follows the project roadmap with gradual release mechanisms to ensure long-term ecosystem sustainability and value stability.
What are the risks to pay attention to when investing in BONE?
BONE investment risks include market volatility, liquidity fluctuations, regulatory uncertainty, and smart contract vulnerabilities. Monitor project developments, diversify your portfolio, and only invest capital you can afford to lose.
What impact does Shibarium ecosystem development have on BONE price?
Shibarium's ecosystem growth directly strengthens BONE's utility and demand. Increased dApp adoption, higher transaction volumes, and expanded use cases drive network activity, boosting BONE's value proposition. Enhanced ecosystem development typically correlates with price appreciation.
* The information is not intended to be and does not constitute financial advice or any other recommendation of any sort offered or endorsed by Gate.