This comprehensive guide analyzes Bedrock (BR) price movements from 2026 to 2031, providing expert forecasts for this innovative multi-asset liquid restaking protocol. Currently trading at $0.05638 with a $12.97 million market cap, BR presents both opportunities and risks for DeFi investors. The article examines historical price trajectory, current market sentiment showing extreme fear conditions, and token concentration risks from major holders. Strategic price predictions range from conservative scenarios of $0.0513-$0.0564 in 2026 to optimistic 2031 targets reaching $0.1335. Investment recommendations address three investor profiles with specific allocation guidelines and risk management frameworks. The analysis highlights technical risks including smart contract vulnerabilities and regulatory uncertainties surrounding Bitcoin DeFi protocols. Explore BR trading opportunities on Gate exchange while maintaining disciplined portfolio positioning and understanding the volatile nature of emerging crypto assets.
Introduction: BR's Market Position and Investment Value
Bedrock (BR), as the pioneering multi-asset liquid restaking protocol, has established itself in the DeFi ecosystem since its inception. As of January 2026, BR maintains a market capitalization of approximately $12.97 million, with a circulating supply of 230 million tokens and a current price around $0.05638. This asset, recognized as an innovative solution in the BTCFi 2.0 space, is playing an increasingly vital role in unlocking liquidity and yield opportunities across Bitcoin, Ethereum, and DePIN assets.
This article will comprehensively analyze BR's price trajectory from 2026 to 2031, combining historical patterns, market supply-demand dynamics, ecosystem development, and macroeconomic factors to provide investors with professional price forecasts and practical investment strategies.
I. BR Price History Review and Market Status
BR Historical Price Evolution Trajectory
-
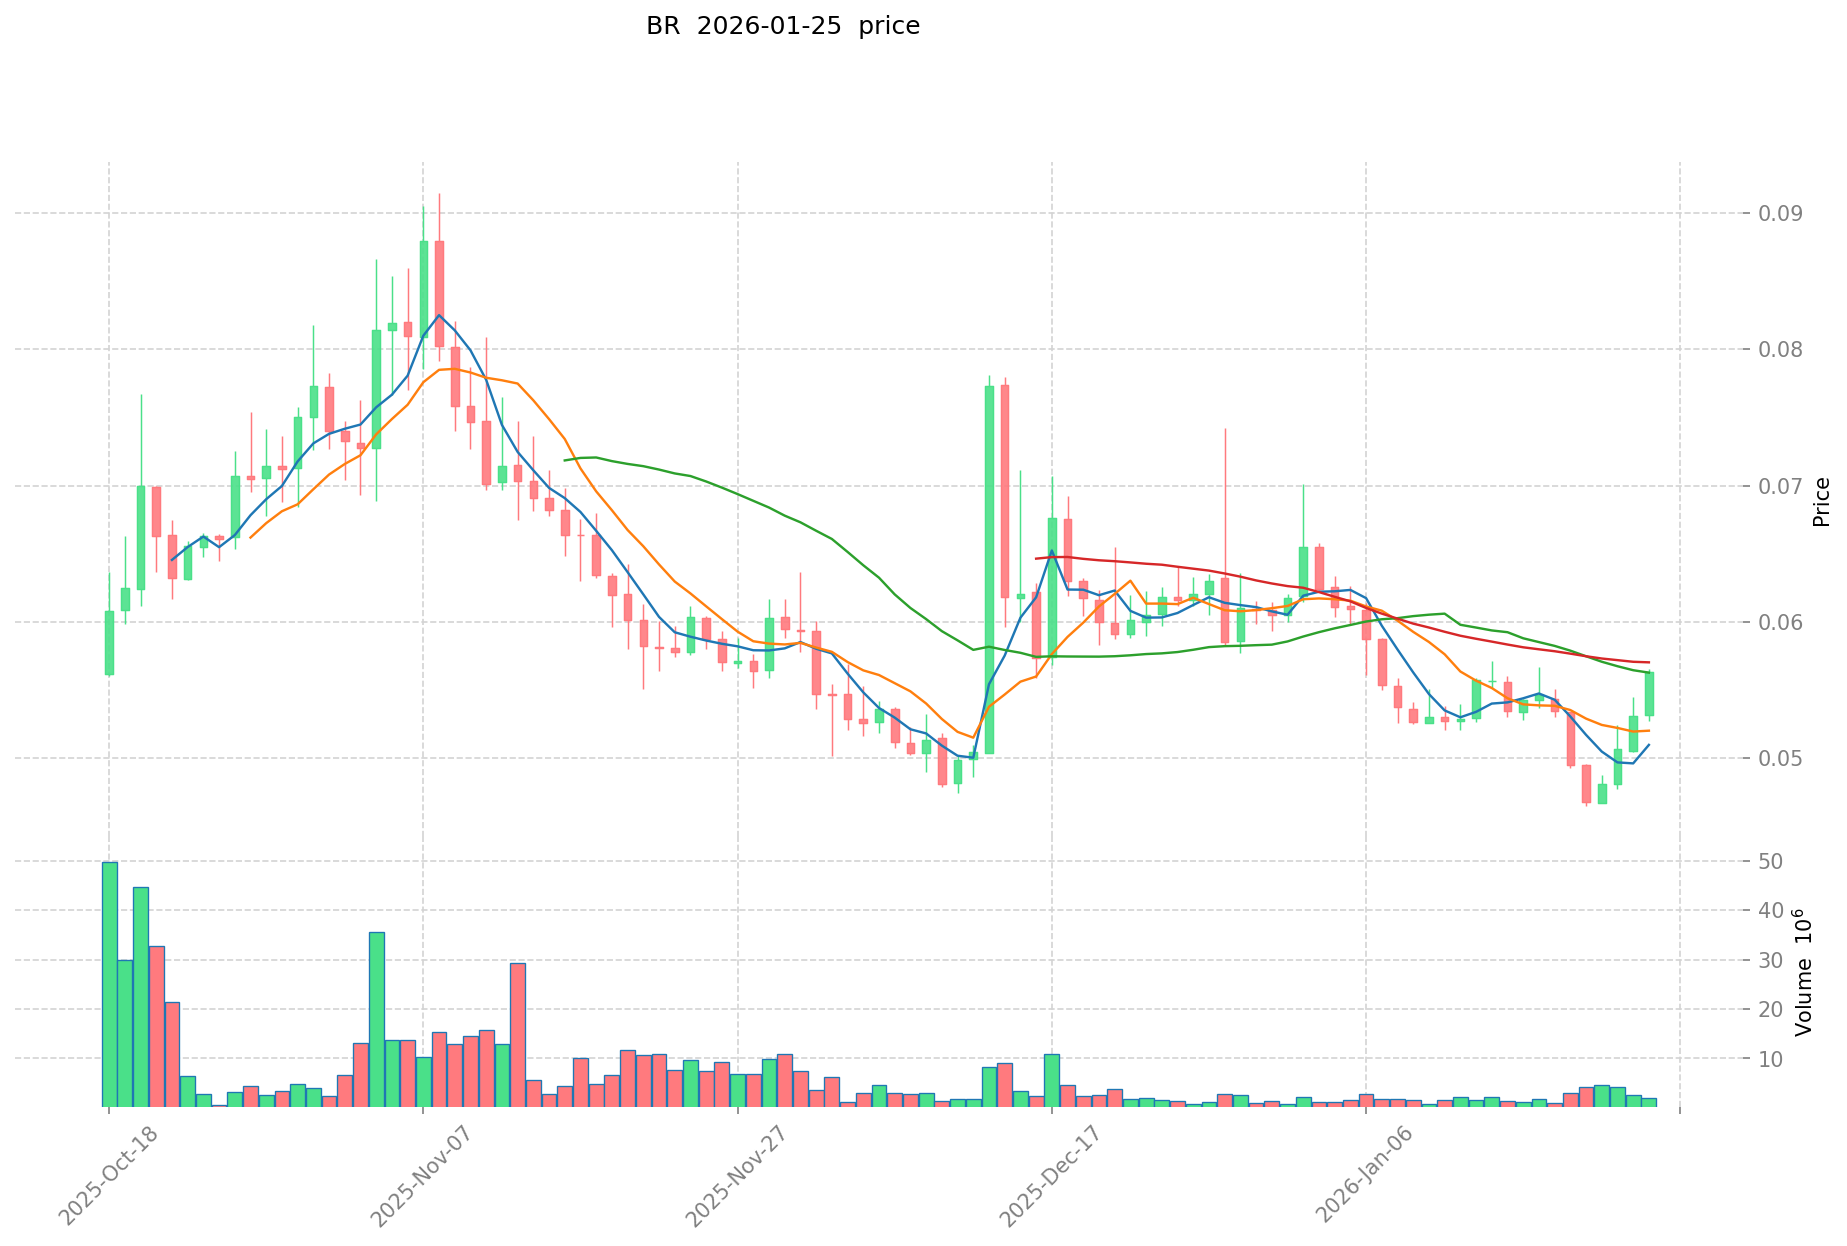
2025: Bedrock launched its Bitcoin staking product uniBTC and the BR token was published on January 20, 2025. The price experienced significant volatility in its early trading period, reaching a peak of $0.2226 on March 24, 2025, before undergoing a correction phase.
-
2025: During the initial market development phase, BR price fluctuated between its all-time high of $0.2226 and all-time low of $0.01 (recorded on March 20, 2025), reflecting the typical price discovery process for newly launched tokens in the DeFi sector.
BR Current Market Situation
As of January 25, 2026, BR is trading at $0.05638, showing positive short-term momentum with a 1-hour increase of 1.31% and a 24-hour gain of 5.77%. The token has demonstrated a 7-day price appreciation of 4.26%, indicating recent market interest. However, the 30-day performance shows a decline of 7.96%, and the 1-year return stands at -61.57%, reflecting the broader market adjustment from its March 2025 peak.
The current market capitalization of BR stands at approximately $12.97 million, with a circulating supply of 230 million tokens representing 23% of the total supply of 1 billion tokens. The 24-hour trading volume registers at $118,787.18. The fully diluted market cap is calculated at $56.38 million. BR is currently available on 14 exchanges and holds approximately 80,605 holders. The token operates on the BSC chain using the BEP-20 standard.
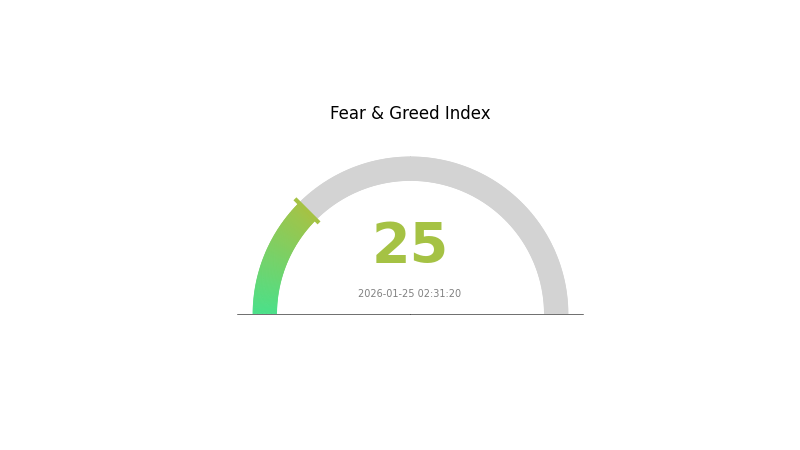
The 24-hour trading range spans from $0.05345 to $0.05666. Market sentiment indicators show the cryptocurrency market is in an "Extreme Fear" phase with a VIX reading of 25, which may influence BR's price movements alongside broader market conditions.
Click to view the current BR market price
BR Market Sentiment Index
2026-01-25 Fear and Greed Index: 25 (Extreme Fear)
Click to view current Fear & Greed Index
The crypto market is currently experiencing extreme fear, with the Fear and Greed Index reaching 25. This level indicates heightened investor anxiety and risk aversion across the market. During periods of extreme fear, opportunities often emerge for contrarian investors, as assets may be undervalued. However, caution remains essential as market volatility typically increases. Traders should monitor key support levels and maintain disciplined risk management strategies. This sentiment shift often precedes significant market recoveries or further downturns, making careful analysis crucial for positioning.
BR Holdings Distribution
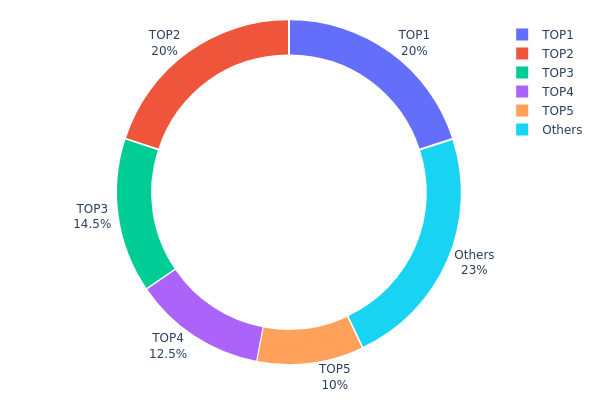
The holdings distribution chart reflects the proportion of BR tokens held by different addresses on the blockchain. By analyzing this data, we can assess the degree of token concentration and evaluate its potential impact on market dynamics and price stability.
Based on the current data, BR exhibits a relatively high concentration level. The top five addresses collectively hold 770,000K BR tokens, representing 77% of the total supply. Specifically, the two largest addresses each hold 200,000K tokens (20% each), while the third, fourth, and fifth addresses hold 145,000K (14.5%), 125,000K (12.5%), and 100,000K (10%) respectively. The remaining 23% is distributed among other addresses. This distribution pattern indicates significant centralization, which may introduce considerable risks to market structure and price movements.
Such high concentration could lead to increased price volatility, as large holders possess substantial market influence. If major holders decide to sell or transfer significant portions of their holdings, it could trigger sharp price fluctuations or even market panic. Additionally, this concentration structure may expose the market to potential manipulation risks, as a small number of addresses could theoretically coordinate to influence trading activities and price discovery. From a decentralization perspective, BR's current on-chain structure demonstrates relatively weak decentralization characteristics, which may affect long-term market confidence and ecosystem stability.
Click to view current BR Holdings Distribution
| Top |
Address |
Holding Qty |
Holding (%) |
| 1 |
0xd7cd...ad6a62 |
200000.00K |
20.00% |
| 2 |
0x3af2...70290d |
200000.00K |
20.00% |
| 3 |
0xc22a...ec13f2 |
145000.00K |
14.50% |
| 4 |
0x3f36...afba4c |
125000.00K |
12.50% |
| 5 |
0xccdb...24b508 |
100000.00K |
10.00% |
| - |
Others |
230000.00K |
23% |
II. Core Factors Affecting BR's Future Price
Due to the lack of available data in the provided materials regarding BR's supply mechanisms, institutional dynamics, macroeconomic influences, and technical developments, a comprehensive analysis of the core factors affecting BR's future price cannot be completed at this time. Readers are encouraged to refer to official project announcements and reliable market data sources for the most current information.
III. 2026-2031 BR Price Prediction
2026 Outlook
- Conservative prediction: $0.0513 - $0.0564
- Neutral prediction: $0.0564
- Optimistic prediction: $0.0716 (requires favorable market conditions and increased adoption)
2027-2029 Outlook
- Market stage expectation: BR is anticipated to enter a gradual growth phase, with price volatility reflecting broader market sentiment and project development milestones
- Price range predictions:
- 2027: $0.0352 - $0.0934
- 2028: $0.0519 - $0.0842
- 2029: $0.0725 - $0.1059
- Key catalysts: Sustained project development progress, expanding ecosystem partnerships, and improving market liquidity could serve as primary drivers for price appreciation during this period
2030-2031 Long-term Outlook
- Baseline scenario: $0.0768 - $0.0937 (assuming steady project execution and moderate market conditions)
- Optimistic scenario: $0.0937 - $0.1199 (assuming accelerated adoption and favorable regulatory environment)
- Transformational scenario: $0.1004 - $0.1335 (contingent upon breakthrough technological implementations and significant market expansion)
- 2026-01-25: BR shows initial positioning with predicted average price around $0.0564, establishing a foundation for potential multi-year growth trajectory
| Year |
Predicted High Price |
Predicted Average Price |
Predicted Low Price |
Price Change |
| 2026 |
0.07158 |
0.05636 |
0.05129 |
0 |
| 2027 |
0.09339 |
0.06397 |
0.03518 |
13 |
| 2028 |
0.08419 |
0.07868 |
0.05193 |
39 |
| 2029 |
0.10587 |
0.08144 |
0.07248 |
44 |
| 2030 |
0.11987 |
0.09365 |
0.07679 |
66 |
| 2031 |
0.13345 |
0.10676 |
0.10036 |
89 |
IV. BR Professional Investment Strategy and Risk Management
BR Investment Methodology
(1) Long-term Holding Strategy
- Suitable for: Investors seeking exposure to Bitcoin DeFi innovation and multi-asset liquid restaking opportunities
- Operational Recommendations:
- Consider accumulating BR during market corrections while monitoring the development progress of Bedrock's BTCFi 2.0 ecosystem
- Evaluate the growth trajectory of uniBTC adoption across the 12+ supported blockchains as a key performance indicator
- Storage Solution: Utilize Gate Web3 Wallet for secure BR token custody with built-in multi-chain support
(2) Active Trading Strategy
- Technical Analysis Tools:
- Volume Analysis: Monitor the 24-hour trading volume (currently $118,787) relative to market cap ($12.97M) to identify liquidity trends
- Price Action Patterns: Track BR's performance against key support levels, noting recent volatility with 24H high of $0.05666 and low of $0.05345
- Swing Trading Considerations:
- Consider the token's current circulating supply ratio of 23% when assessing potential dilution risks
- Monitor BR's correlation with broader BTC liquid staking narratives and DeFi sector momentum
BR Risk Management Framework
(1) Asset Allocation Principles
- Conservative Investors: 1-3% portfolio allocation
- Aggressive Investors: 3-8% portfolio allocation
- Professional Investors: 5-15% portfolio allocation with active hedging strategies
(2) Risk Hedging Approaches
- Diversification Strategy: Balance BR exposure with established liquid staking tokens and BTC spot holdings
- Position Sizing: Implement scaling strategies based on Bedrock's milestone achievements in expanding cross-chain liquidity
(3) Secure Storage Solutions
- Primary Recommendation: Gate Web3 Wallet for seamless integration with Gate.com trading platform and multi-chain asset management
- Multi-signature Setup: Consider implementing additional security layers for holdings exceeding moderate thresholds
- Security Precautions: Never share private keys, enable two-factor authentication, and regularly verify contract addresses when interacting with Bedrock protocols
V. BR Potential Risks and Challenges
BR Market Risks
- Volatility Exposure: BR has demonstrated significant price fluctuations, with a 1-year decline of 61.57% from historical peaks
- Liquidity Constraints: With a relatively modest 24-hour trading volume compared to market cap, sudden market movements may experience slippage
- Market Cap Position: Ranked #1085 with 0.0017% market dominance, positioning BR as a smaller-cap asset subject to higher volatility
BR Regulatory Risks
- Bitcoin DeFi Scrutiny: Liquid staking protocols involving Bitcoin may face evolving regulatory frameworks as authorities develop crypto asset policies
- Cross-chain Compliance: Operating across 12+ blockchains introduces multi-jurisdictional regulatory complexity
- Token Classification Uncertainty: Potential changes in how liquid staking tokens are classified could impact BR's operational environment
BR Technical Risks
- Smart Contract Vulnerabilities: Multi-asset restaking protocols involve complex smart contract interactions that may contain undiscovered vulnerabilities
- Cross-chain Bridge Dependencies: Bedrock's multi-chain architecture relies on bridge security, which has historically been a target for exploits in the DeFi space
- Protocol Maturity: As an emerging BTCFi 2.0 protocol, Bedrock's long-term technical stability remains under ongoing market validation
VI. Conclusion and Action Recommendations
BR Investment Value Assessment
Bedrock presents an innovative approach to Bitcoin liquid staking through its uniBTC product and multi-asset restaking capabilities. The protocol's expansion across 12+ blockchains demonstrates technical ambition, though the project operates in a competitive and rapidly evolving DeFi landscape. With 80,605 holders and 23% of total supply circulating, BR represents an early-stage opportunity with corresponding risk-reward dynamics. The significant year-over-year decline highlights the importance of careful timing and risk management when considering exposure.
BR Investment Recommendations
✅ Beginners: Start with minimal allocation (under 2% of crypto portfolio) and focus on understanding liquid staking mechanics before increasing exposure
✅ Experienced Investors: Consider strategic accumulation during favorable technical setups while maintaining strict stop-loss disciplines, given the token's volatility profile
✅ Institutional Investors: Conduct thorough due diligence on Bedrock's smart contract audits and cross-chain security architecture before deploying capital
BR Trading Participation Methods
- Spot Trading: Access BR through Gate.com with real-time market execution and competitive trading fees
- Staking Participation: Explore uniBTC and Bedrock's native staking mechanisms to generate yield while holding BR
- Portfolio Integration: Use Gate.com's portfolio management tools to track BR performance alongside other liquid staking assets
Cryptocurrency investment carries extreme risks, and this article does not constitute investment advice. Investors should make prudent decisions based on their own risk tolerance and are advised to consult professional financial advisors. Never invest more than you can afford to lose.
FAQ
What are the main factors affecting BR (Brazilian Real) price predictions?
BR price is influenced by Brazil's economic indicators, central bank monetary policy, inflation rates, interest rate differentials, geopolitical events, commodity prices, and global risk sentiment. Currency strength correlates with economic growth expectations and capital flows into emerging markets.
How to use technical analysis methods to predict BR/USD exchange rate trends?
Analyze BR/USD using key technical indicators: moving averages for trend direction, RSI for overbought/oversold conditions, MACD for momentum, and Bollinger Bands for volatility. Monitor trading volume patterns and support/resistance levels. Combine multiple indicators for stronger signals.
What is the impact of Brazilian economic data (such as GDP and inflation rate) on the Real exchange rate?
Brazilian economic data directly influences Real exchange rates. Strong GDP growth and low inflation strengthen the Real, while weak growth and high inflation weaken it. Central bank policy responses to inflation data also drive significant currency movements.
Common BR price prediction tools include technical analysis indicators like Moving Averages, RSI, MACD, and Bollinger Bands. Traders also monitor trading volume, market sentiment, on-chain metrics, and correlation with Bitcoin trends to forecast price movements.
What is the recent BR exchange rate trend forecast, and what risks should be noted?
BR is expected to show moderate upward momentum in the near term, driven by increasing transaction volume and growing market adoption. Monitor volatility carefully as market sentiment shifts.
* The information is not intended to be and does not constitute financial advice or any other recommendation of any sort offered or endorsed by Gate.