This comprehensive CARAT price analysis examines the Alaska Gold Rush gaming token's market dynamics from 2026 through 2031. The article reviews historical price evolution, current market status showing a 97.68% decline from launch, and identifies key valuation drivers including supply mechanisms, market demand shifts, and ecosystem development. Price predictions range from $0.00022-$0.00034 in 2026, with potential appreciation to $0.00041-$0.00048 by 2031 under favorable conditions. The guide provides professional investment strategies tailored for beginners, experienced traders, and institutional investors, emphasizing risk management through dollar-cost averaging and portfolio diversification on Gate exchange. Essential for Web3 gaming investors seeking data-driven forecasts and practical trading methodology amid current extreme market fear conditions.
Introduction: CARAT's Market Position and Investment Value
Alaska Gold Rush (CARAT), positioned as a revolutionary FPP web3 gaming project combining elements of survival, battle royale, and role-playing with an innovative Win2Earn economic model, has been operating in the crypto gaming space since its launch in 2023. As of 2026, CARAT maintains a market capitalization of approximately $205,860, with a circulating supply of around 886.95 million tokens, and the price hovering at $0.0002321. This gaming-focused digital asset is playing an increasingly important role in the web3 gaming ecosystem and blockchain-based entertainment sector.
This article will comprehensively analyze CARAT's price trends from 2026 to 2031, combining historical patterns, market supply and demand dynamics, ecosystem development, and macroeconomic factors to provide investors with professional price forecasts and practical investment strategies.
I. CARAT Price History Review and Market Status
CARAT Historical Price Evolution Trajectory
- April 2023: Token launched at $0.01, price reached $0.03147683 on April 21, 2023
- 2023-2024: Price experienced significant volatility, declining from the peak established in April 2023
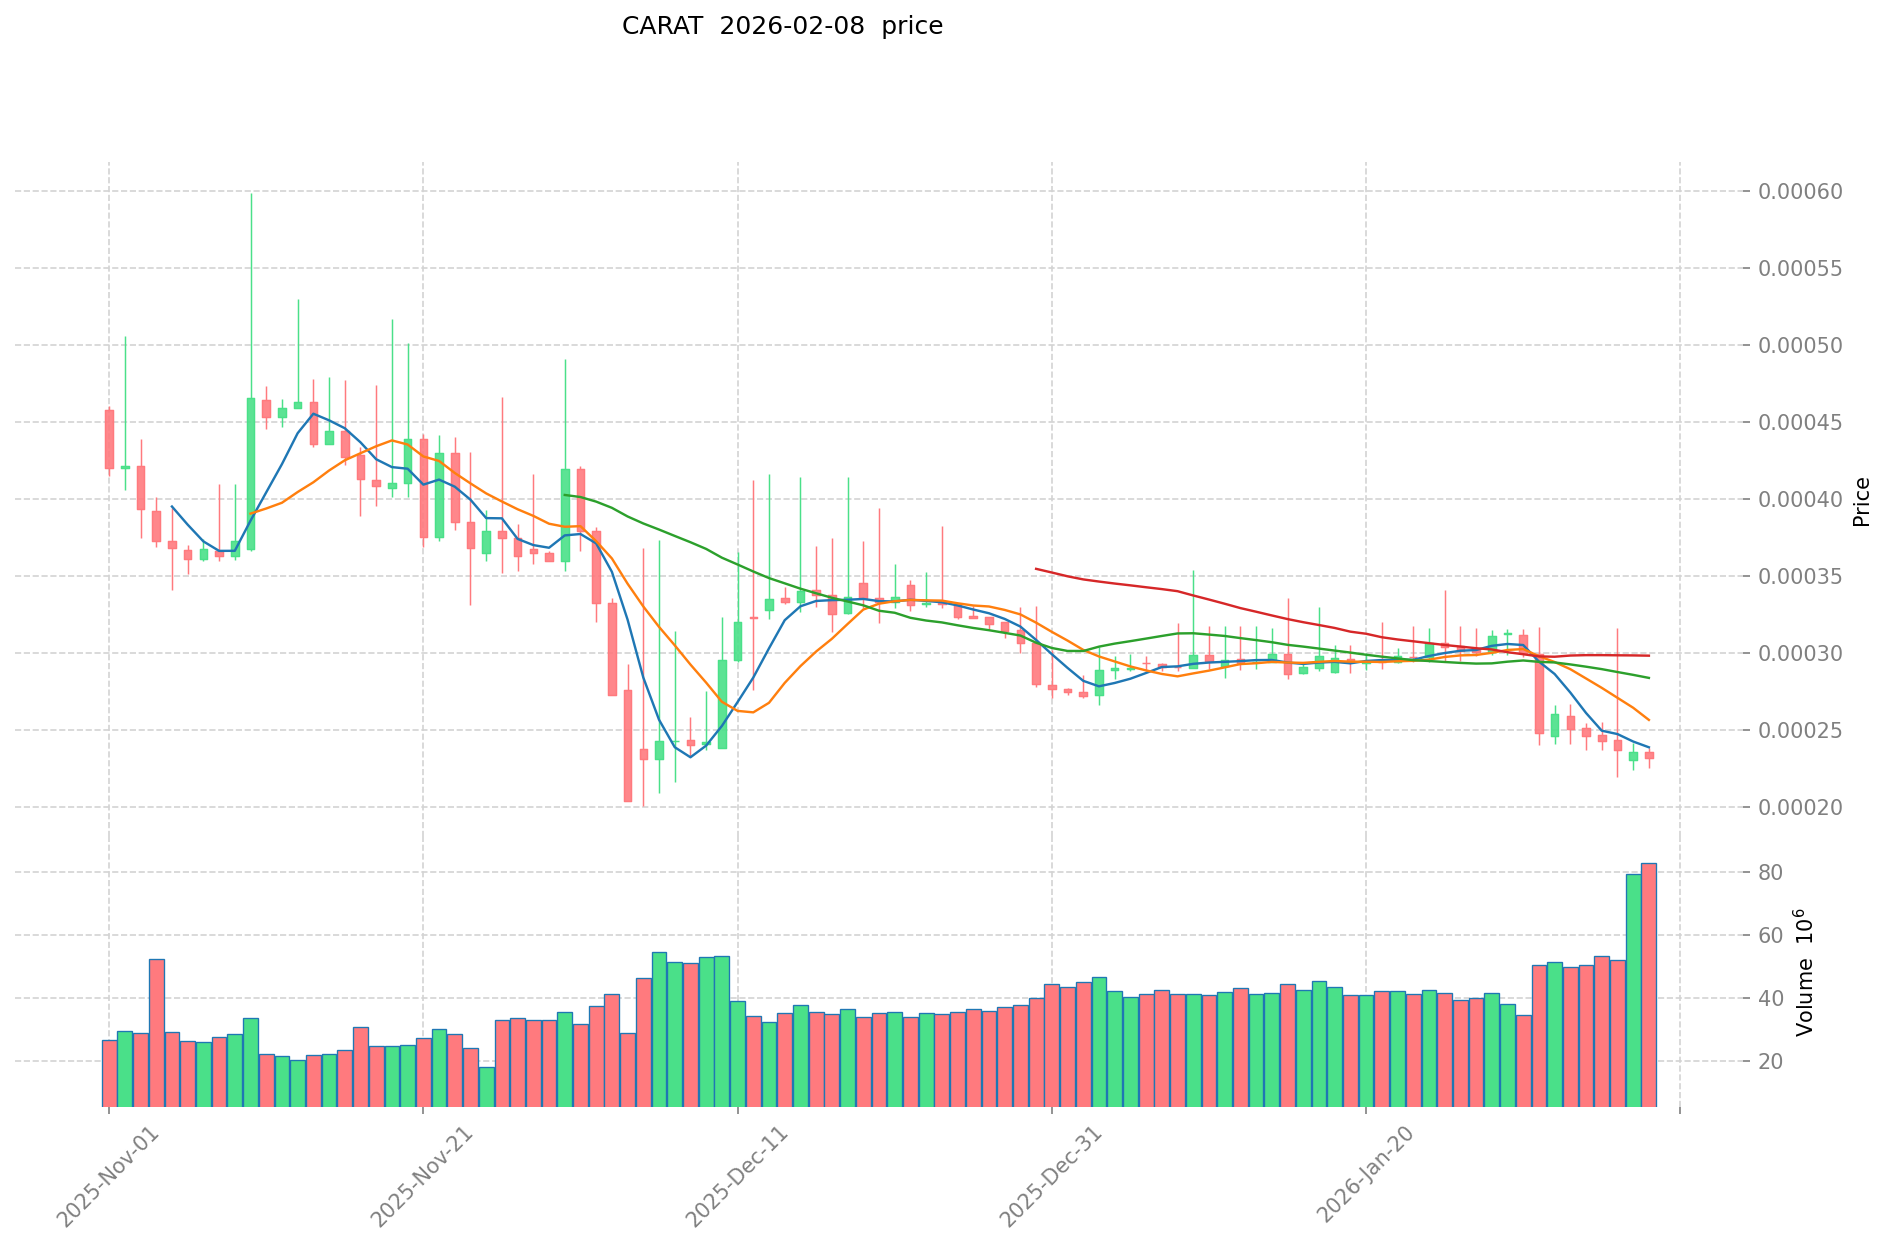
- December 2025: Price dropped to $0.00020858 on December 5, 2025, marking the lowest point in trading history
- 2025-2026: Price demonstrated a downward trend with an 87.85% decline over the past year
CARAT Current Market Status
As of February 8, 2026, CARAT is trading at $0.0002321, representing a 97.68% decrease from its initial offering price of $0.01. The token has shown negative momentum across multiple timeframes, with a 0.21% decline over the past hour, 0.42% decrease in the last 24 hours, and 6.15% drop over the past week. The 30-day performance indicates a 20.13% reduction in value.
The current market capitalization stands at approximately $205,860, with a 24-hour trading volume of $14,483.57. The circulating supply represents 886.95 million tokens, accounting for 88.69% of the total supply of 910.36 million tokens. The maximum supply is capped at 1 billion tokens. The fully diluted valuation is calculated at $211,295.
The 24-hour price range fluctuated between $0.0002278 and $0.0002383. The token holder base consists of 7,089 addresses. Market dominance remains minimal at 0.0000084%. Current trading activity indicates limited liquidity with relatively low trading volumes compared to historical levels.
Click to view the current CARAT market price
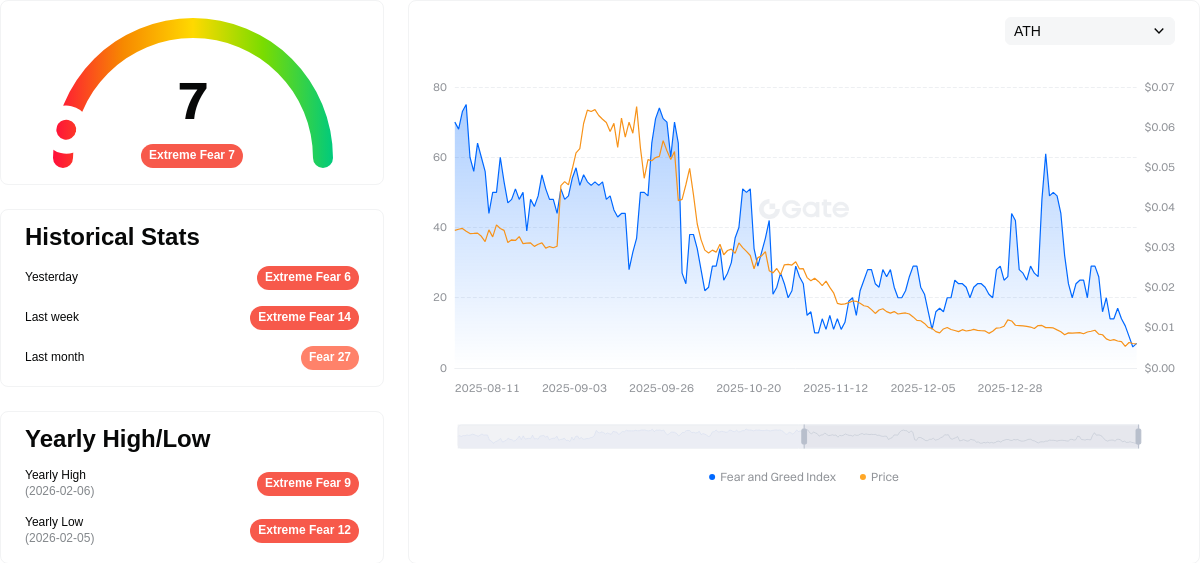
CARAT Market Sentiment Indicator
2026-02-08 Fear & Greed Index: 7(Extreme Fear)
Click to view current Fear & Greed Index
The crypto market is experiencing extreme fear, with the Fear & Greed Index reaching a critically low level of 7. This indicates heightened pessimism and risk aversion among investors, suggesting potential capitulation selling pressure. Such extreme readings historically present contrarian opportunities for long-term investors, as panic-driven declines often create asymmetric risk-reward setups. However, caution remains warranted as downward momentum may continue in the near term. Monitor key support levels closely and consider dollar-cost averaging strategies during periods of extreme fear to optimize entry points.
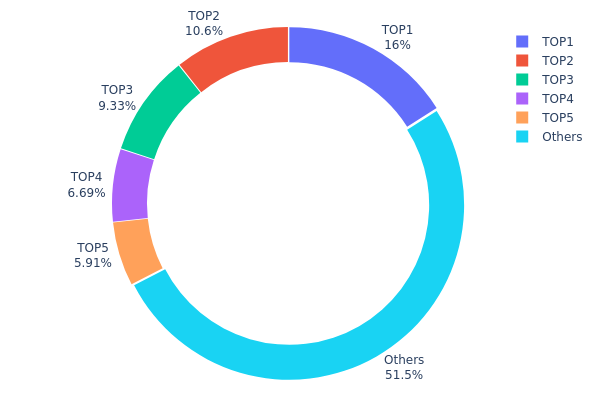
CARAT Holding Distribution
The holding distribution chart reveals the allocation of CARAT tokens across different wallet addresses, serving as a critical indicator of token concentration and decentralization levels. By analyzing the proportion held by top addresses versus smaller holders, investors can assess potential market manipulation risks and the overall health of the token's ecosystem structure.
Current data indicates a relatively balanced distribution pattern for CARAT. The top holder controls 15.95% of total supply (145,222.22K tokens), while the top five addresses collectively hold 48.52% (441,903.66K tokens). This concentration level suggests moderate centralization, positioning CARAT between highly concentrated projects and fully decentralized assets. The "Others" category, representing numerous smaller addresses, accounts for 51.48% of supply, demonstrating meaningful participation from retail investors and smaller institutional players across the ecosystem.
From a market structure perspective, this distribution pattern presents both stability factors and potential volatility triggers. The presence of several large holders could provide liquidity during market fluctuations, but simultaneous selling pressure from top addresses might generate significant downward momentum. The substantial proportion held by smaller addresses (over 51%) indicates reasonable decentralization, reducing single-point manipulation risks while suggesting grassroots community support. This balanced structure typically correlates with moderate price volatility and reflects a maturing token economy where both institutional and retail participants maintain active positions.
Click to view current CARAT Holding Distribution
| Top |
Address |
Holding Qty |
Holding (%) |
| 1 |
0x71b2...9f0407 |
145222.22K |
15.95% |
| 2 |
0x8e01...ea3752 |
96944.44K |
10.64% |
| 3 |
0x4988...9de11c |
84968.21K |
9.33% |
| 4 |
0xd222...559f2e |
60945.01K |
6.69% |
| 5 |
0x3840...5f8a4f |
53823.78K |
5.91% |
| - |
Others |
468458.57K |
51.48% |
II. Core Factors Influencing CARAT's Future Price
Supply Mechanism
- Diamond 4C Standards: CARAT price trends are fundamentally shaped by the globally recognized 4C grading system, which encompasses carat weight, color, clarity, and cut. These quality parameters directly determine diamond valuation, with higher grades commanding premium prices in the market.
- Production Technology Evolution: The emergence of lab-grown diamond production technologies, particularly High Temperature High Pressure (HTHP) and Chemical Vapor Deposition (CVD) methods, has significantly altered supply dynamics. HTHP technology enables mass production of 3-6 carat rough diamonds, while CVD methods produce diamonds with superior clarity reaching VVS grades.
- Current Supply Landscape: Global production capacity has experienced substantial expansion, with China accounting for approximately 40-50% of gem-quality lab-grown diamond output. Annual production reached around 7 million carats in recent periods, representing a compound annual growth rate exceeding 100% over recent years, which may exert downward pressure on pricing structures.
Market Demand Dynamics
- Consumer Preference Shifts: The diamond market has witnessed evolving consumer attitudes, with growing acceptance of lab-grown alternatives alongside traditional natural diamonds. Major jewelry retailers have increasingly incorporated lab-grown options into their product portfolios.
- Brand Strategy Transformation: Industry leaders have pivoted from initial resistance to active promotion of lab-grown diamonds. Notable examples include De Beers launching the Lightbox brand and Swarovski establishing dedicated lab-grown diamond lines, signaling mainstream market validation.
- Price Positioning: Lab-grown diamonds typically range from $1,500 to $4,000 per carat, offering substantial discounts compared to natural diamond equivalents. This pricing differential continues to influence consumer purchasing decisions and market segmentation.
Macroeconomic Environment
- Economic Conditions: Global economic performance directly impacts luxury goods consumption, including diamond purchases. Economic expansion periods tend to stimulate demand for premium jewelry products, while downturns may constrain discretionary spending.
- Supply-Demand Imbalance: The diamond sector faces structural challenges as natural diamond mine production has declined while overall demand continues growing, creating potential supply constraints for natural stones while lab-grown production fills market gaps.
- Consumer Confidence: Broader consumer sentiment and purchasing power fluctuations affect diamond market dynamics, with economic uncertainty potentially driving preference shifts toward more affordable lab-grown alternatives.
Technology Development and Ecosystem
- Manufacturing Efficiency Improvements: Ongoing technological refinements in HTHP and CVD production methods continue enhancing output quality and cost efficiency. Recent breakthroughs enable producers to achieve D-color grades and VVS clarity levels previously difficult to replicate.
- Quality Standardization: Industry organizations have established comprehensive grading frameworks, with institutions like GIA updating certification terminology to encompass lab-grown diamonds. The Federal Trade Commission's 2018 definition revision officially recognized lab-grown diamonds alongside natural diamonds.
- Application Diversification: Beyond jewelry applications, diamond materials increasingly serve functional roles in optical, electronic, and industrial sectors, potentially broadening market foundations and supporting long-term demand stability.
III. 2026-2031 CARAT Price Prediction
2026 Outlook
- Conservative Prediction: $0.00022
- Neutral Prediction: $0.00023
- Optimistic Prediction: $0.00034 (requires favorable market conditions)
2027-2029 Outlook
- Market Stage Expectation: CARAT may enter a moderate growth phase as the cryptocurrency market matures and adoption expands
- Price Range Predictions:
- 2027: $0.00026 - $0.00038
- 2028: $0.0003 - $0.00036
- 2029: $0.0002 - $0.00045
- Key Catalysts: Potential drivers include broader market recovery, increased utility within its ecosystem, technological developments, and growing community engagement
2030-2031 Long-term Outlook
- Base Scenario: $0.00034 - $0.00054 (assuming steady ecosystem development and sustained market interest)
- Optimistic Scenario: $0.00041 - $0.00048 by 2031 (with enhanced adoption and favorable regulatory environment)
- Transformative Scenario: Prices may experience significant appreciation if breakthrough partnerships, major exchange listings on platforms like Gate.com, or substantial technological upgrades materialize
- 2026-02-08: CARAT shows relatively stable positioning with potential for gradual appreciation over the forecast period
| Year |
Predicted High Price |
Predicted Average Price |
Predicted Low Price |
Price Change |
| 2026 |
0.00034 |
0.00023 |
0.00022 |
0 |
| 2027 |
0.00038 |
0.00029 |
0.00026 |
23 |
| 2028 |
0.00036 |
0.00033 |
0.0003 |
43 |
| 2029 |
0.00045 |
0.00035 |
0.0002 |
50 |
| 2030 |
0.00054 |
0.0004 |
0.00034 |
71 |
| 2031 |
0.00048 |
0.00047 |
0.00041 |
100 |
IV. CARAT Professional Investment Strategy and Risk Management
CARAT Investment Methodology
(1) Long-term Holding Strategy
- Suitable for: Investors with a high risk tolerance who understand Web3 gaming ecosystems and are willing to hold through market volatility
- Operational Recommendations:
- Consider accumulating positions during market corrections when CARAT trades near its support levels
- Monitor the development progress of Alaska Gold Rush game features and Win2Earn economy implementation
- For secure storage, utilize Gate Web3 Wallet which supports BSC chain tokens and provides multi-layer security features
(2) Active Trading Strategy
- Technical Analysis Tools:
- Volume Analysis: Monitor the 24-hour trading volume (currently around $14,483) to identify potential trend reversals or breakouts
- Support and Resistance Levels: Track the 24-hour range between $0.0002278 and $0.0002383 to establish entry and exit points
- Swing Trading Key Points:
- Consider the token's recent volatility patterns, noting the 7-day decline of 6.15% and 30-day decline of 20.13%
- Set stop-loss orders to manage downside risk given the token's historical price range
CARAT Risk Management Framework
(1) Asset Allocation Principles
- Conservative Investors: 1-2% of crypto portfolio allocation
- Aggressive Investors: 3-5% of crypto portfolio allocation
- Professional Investors: Up to 5-8% with active risk monitoring
(2) Risk Hedging Solutions
- Portfolio Diversification: Balance CARAT exposure with established gaming tokens and major cryptocurrencies
- Position Sizing: Implement gradual entry strategies rather than lump-sum investments given the token's volatility
(3) Secure Storage Solutions
- Hot Wallet Recommendation: Gate Web3 Wallet for convenient trading access and BSC network compatibility
- Security Best Practices: Enable two-factor authentication, regularly update security settings, and never share private keys or seed phrases
V. CARAT Potential Risks and Challenges
CARAT Market Risks
- High Volatility: The token has experienced an 87.85% decline over the past year, indicating substantial price volatility and market risk
- Low Liquidity: With a 24-hour trading volume of approximately $14,483 and market cap of around $205,860, liquidity constraints may impact execution prices
- Gaming Sector Dependency: Token value is closely tied to the success and adoption of the Alaska Gold Rush game, which remains in development
CARAT Regulatory Risks
- Gaming Token Classification: Uncertainty around how gaming tokens with Win2Earn models may be classified by regulators in different jurisdictions
- BSC Network Regulations: Potential regulatory developments affecting BNB Smart Chain operations could impact CARAT accessibility
- Cross-border Gaming Regulations: Varying international regulations on blockchain gaming and crypto-earning mechanisms may affect project expansion
CARAT Technical Risks
- Smart Contract Vulnerabilities: The token operates on BSC (contract: 0x426c1c971fb00caaf1883bd801323a8becb0c919), requiring ongoing security audits
- Network Dependency: Reliance on BSC network stability and security for all token transactions and gaming operations
- Game Development Execution: Technical challenges in delivering the promised FPP Web3 gaming experience combining multiple game genres
VI. Conclusion and Action Recommendations
CARAT Investment Value Assessment
CARAT represents a speculative opportunity within the Web3 gaming sector, combining elements of popular game genres with a Win2Earn economic model. The token's long-term value proposition depends heavily on the successful development and adoption of the Alaska Gold Rush game platform. However, significant short-term risks include high price volatility (down 87.85% year-over-year), limited liquidity with low trading volumes, and the competitive nature of the blockchain gaming market. The current market cap of approximately $205,860 and circulating supply of 886.9 million tokens (88.69% of max supply) indicate a relatively small-cap project with corresponding high-risk characteristics.
CARAT Investment Recommendations
✅ Beginners: Avoid initial investment or allocate minimal amounts (under 1% of portfolio) only after thorough research into Web3 gaming risks. Consider starting with educational resources about blockchain gaming before committing capital.
✅ Experienced Investors: Consider small speculative positions (2-3% of crypto portfolio) with strict stop-loss protocols. Monitor game development milestones and community engagement metrics before increasing exposure.
✅ Institutional Investors: Conduct comprehensive due diligence on the development team, game mechanics, and competitive positioning. Consider waiting for clear adoption metrics and revenue generation before meaningful allocation.
CARAT Trading Participation Methods
- Spot Trading on Gate.com: Access CARAT trading pairs with competitive fees and liquidity aggregation
- Gate Web3 Wallet Integration: Store CARAT securely while maintaining control of private keys and easy access to BSC ecosystem
- Dollar-Cost Averaging: Implement systematic purchase plans to mitigate timing risk in this volatile asset
Cryptocurrency investment carries extremely high risks, and this article does not constitute investment advice. Investors should make prudent decisions based on their own risk tolerance and are advised to consult professional financial advisors. Never invest more than you can afford to lose.
FAQ
What is CARAT and how is its price determined?
CARAT is a unit measuring diamond weight in grams. Diamond prices are determined by multiple factors including carat weight, cut quality, color grade, and clarity. Market supply and demand fluctuations also influence price movements.
What are the main factors affecting CARAT price?
CARAT price is primarily influenced by market demand, supply dynamics, and underlying asset value. Increased adoption and positive market sentiment drive prices higher, while competition and macroeconomic conditions create downward pressure.
How to predict CARAT price? What analysis methods are available?
Use linear regression models and time series analysis to predict CARAT price. Machine learning algorithms help identify market trends. Historical data, trading volume, and market sentiment are key factors for accurate price forecasting.
How accurate is CARAT price prediction? What risks exist?
CARAT price prediction accuracy depends on market volatility and data quality. Key risks include sudden market fluctuations, liquidity variations, and historical data limitations. Predictions serve as reference only, not guaranteed outcomes.
What is the historical price trend of CARAT?
CARAT launched at $0.005 per token with significant early volatility. The token experienced dramatic price fluctuations with multiple peaks and valleys. In March, CARAT surged sharply, demonstrating strong market momentum and investor interest in the token's development trajectory.
What are professional institutions' predictions for CARAT's future price?
Professional institutions predict CARAT's future price based on historical data and market trends. Analysis of past market behavior helps identify patterns for informed price forecasts. However, specific price targets remain uncertain due to multiple influencing factors.
* The information is not intended to be and does not constitute financial advice or any other recommendation of any sort offered or endorsed by Gate.