This comprehensive guide analyzes Cere Network (CERE) token price dynamics from 2026 to 2031, providing expert market forecasts and actionable investment strategies. The article examines CERE's market position, historical price evolution, current valuation metrics, and core factors influencing future performance including supply mechanisms, institutional adoption, macroeconomic conditions, and ecosystem development. Through detailed price predictions—ranging from $0.00026 to $0.00077 across different scenarios—readers gain insights into potential growth trajectories. The guide addresses professional investment methodologies including long-term holding strategies and active trading approaches, alongside comprehensive risk management frameworks essential for cryptocurrency portfolios. Detailed analysis of market risks, regulatory challenges, and technical vulnerabilities enables investors to make informed decisions on Gate exchange and other platforms.
Introduction: CERE's Market Position and Investment Value
Cere Network (CERE), as a decentralized data cloud (DDC) platform supported by Binance Labs, has established cross-chain compatibility with major networks including Binance Smart Chain, Polkadot, Cosmos, and Ethereum since its inception. As of 2026, CERE maintains a market capitalization of approximately $2.19 million, with a circulating supply of about 6.64 billion tokens, and the price hovering around $0.0003303. This asset, designed to bridge enterprise companies with rapidly growing decentralized ecosystems, is playing an increasingly significant role in the data cloud infrastructure space.
This article will comprehensively analyze CERE's price trends from 2026 to 2031, combining historical patterns, market supply and demand dynamics, ecosystem development, and macroeconomic conditions to provide investors with professional price forecasts and practical investment strategies.
I. CERE Price History Review and Market Status
CERE Historical Price Evolution Trajectory
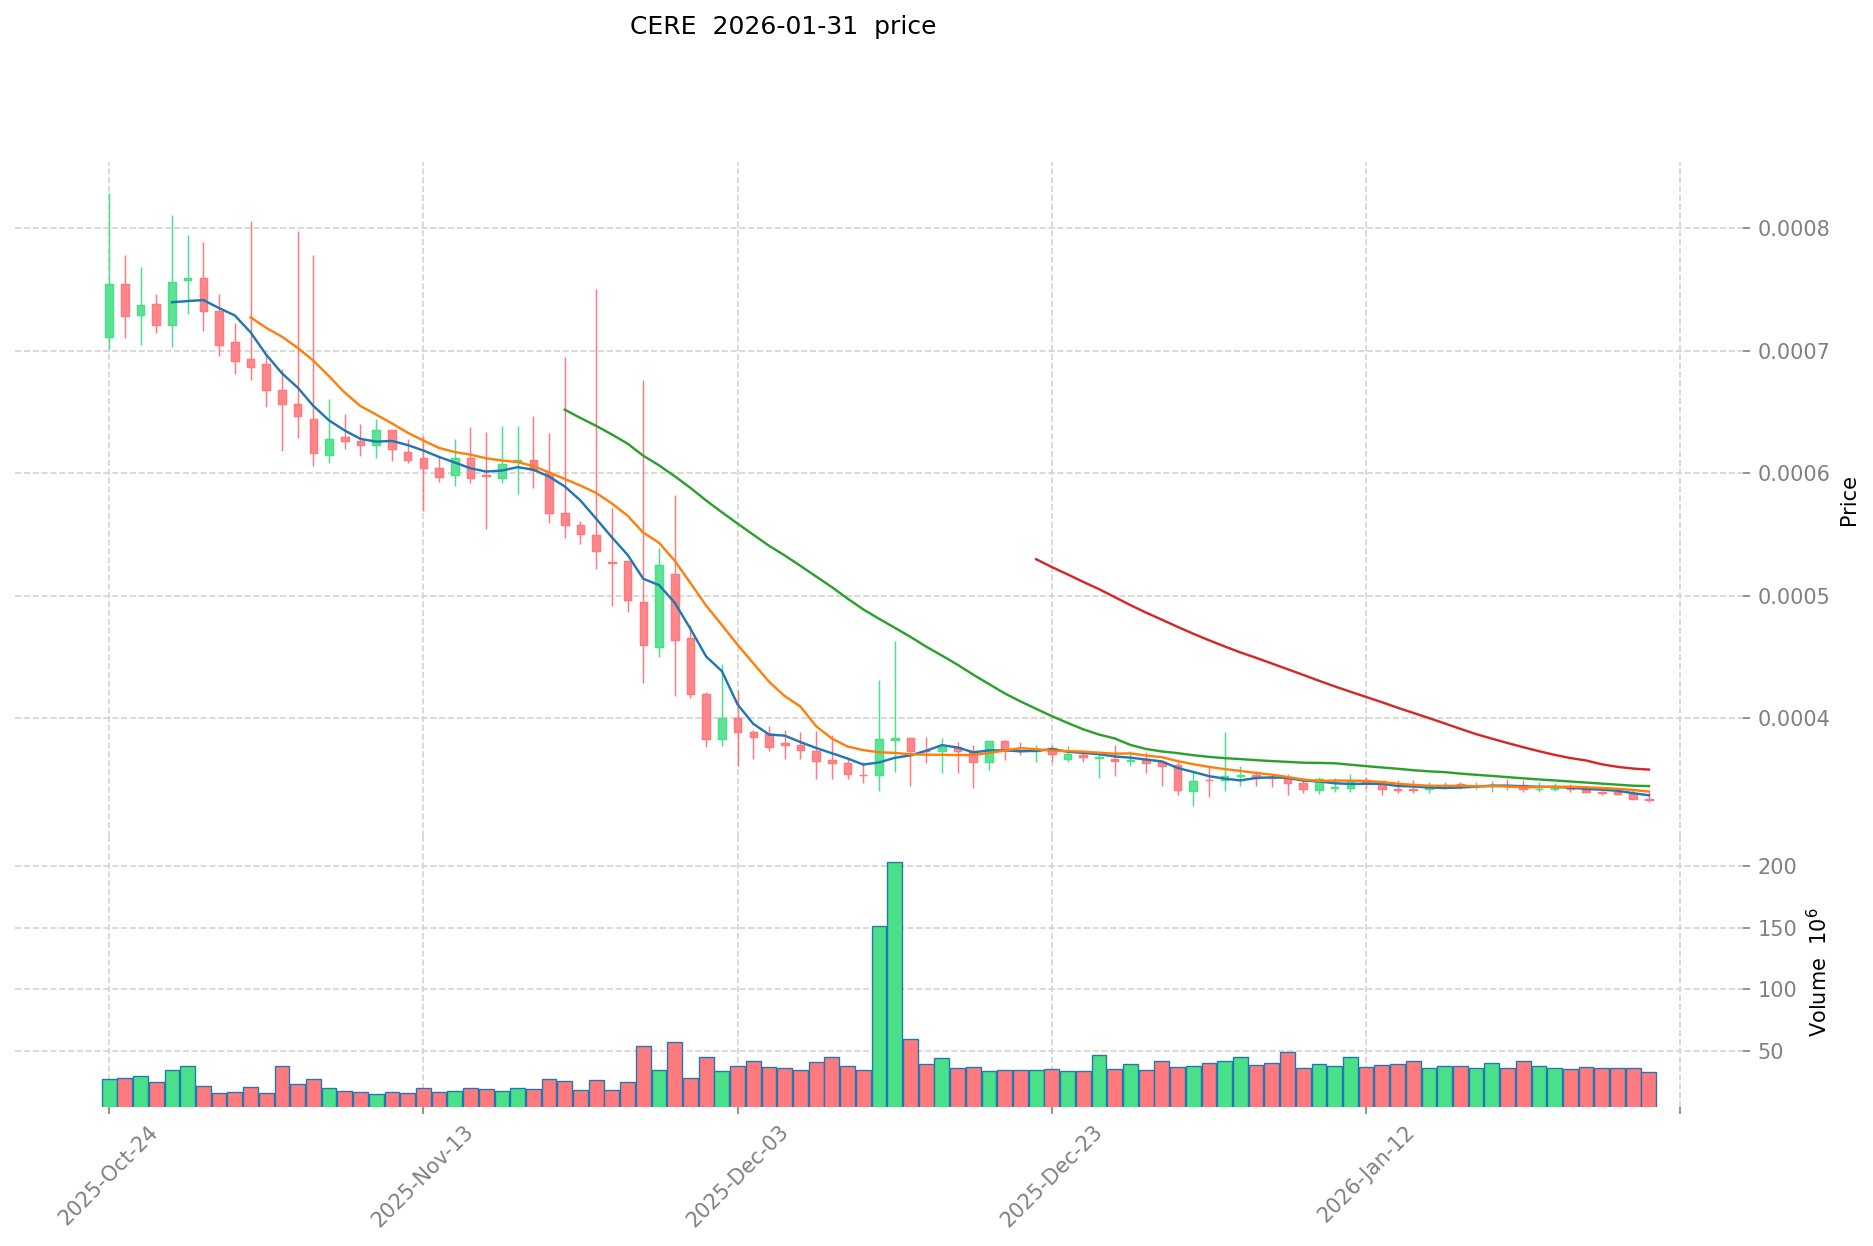
- 2021: CERE reached its historical peak on November 8, 2021, with the price climbing to $0.47126
- 2026: The token experienced significant price contraction, with the price declining to $0.00033119 on February 1, 2026
CERE Current Market Situation
As of February 1, 2026, CERE is trading at $0.0003303, reflecting a decline of approximately 99.93% from its all-time high. The 24-hour trading volume stands at $12,391.35, indicating relatively modest market activity.
Recent price movements show downward pressure across multiple timeframes. Over the past hour, CERE declined by 0.18%, while the 24-hour period saw a decrease of 1.4%. The weekly performance shows a 4.07% decline, and the monthly chart reflects a 6% drop. The most significant decline appears in the one-year performance, with an 85.50% decrease, illustrating substantial value erosion over the longer term.
The token's market capitalization currently sits at approximately $2.19 million, with a circulating supply of 6.64 billion tokens representing 66.38% of the maximum supply of 10 billion tokens. The fully diluted market cap stands at $3.30 million. CERE maintains a market dominance of 0.00011%, positioning it as a smaller-cap asset within the broader cryptocurrency ecosystem.
The 24-hour trading range shows CERE fluctuating between $0.0003291 and $0.0003364, indicating limited price volatility during this period. The market cap to fully diluted valuation ratio of 66.38% suggests that a significant portion of the total token supply is already in circulation.
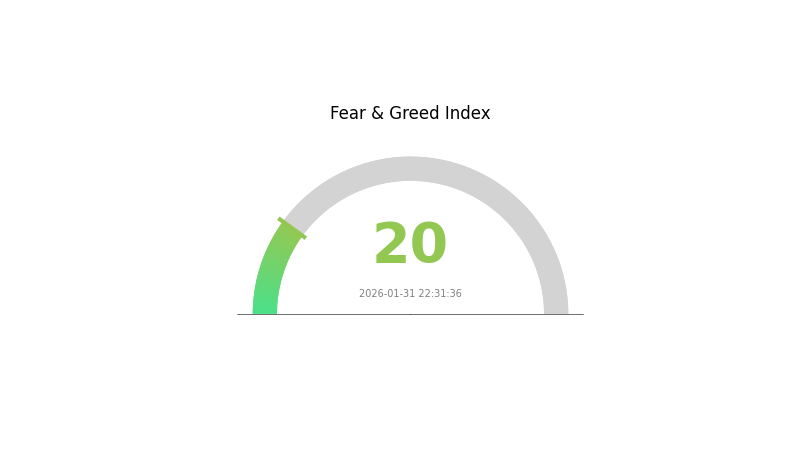
CERE is currently listed on 3 exchanges and has approximately 6,844 holders. The current market sentiment index reflects a reading of 1, with broader market indicators showing a VIX score of 20, characterized as "Extreme Fear" conditions, potentially influencing overall trading behavior across cryptocurrency markets.
Click to view current CERE market price
Market Sentiment Indicator
2026-01-31 Fear and Greed Index: 20 (Extreme Fear)
Click to view current Fear & Greed Index
The crypto market is currently experiencing extreme fear, with the index standing at 20. This reading indicates heightened market anxiety and pessimism among investors. During periods of extreme fear, market volatility typically increases as sellers dominate trading activity. Experienced traders often view such conditions as potential opportunities, as oversold assets may present attractive entry points. However, caution is warranted as prices may continue declining before stabilizing. Investors should closely monitor market developments and position sizing accordingly during this volatile period.
CERE Token Holding Distribution
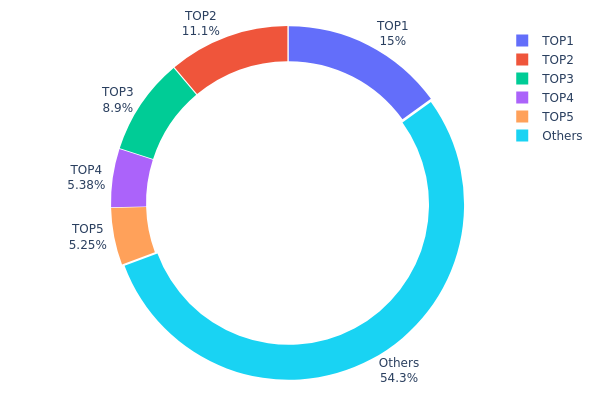
The token holding distribution chart serves as a critical indicator for assessing the degree of decentralization and structural health of a cryptocurrency's on-chain ecosystem. By analyzing the concentration of tokens across different wallet addresses, investors can gauge potential market manipulation risks, whale influence, and the overall democratization of token ownership. For CERE, this metric reveals fundamental characteristics about its network participants and governance structure.
According to the latest data, CERE exhibits a moderately concentrated holding pattern. The top five addresses collectively control approximately 45.69% of the total token supply, with the largest holder possessing 15.04% (1,504,733.24K tokens), followed by 11.14% and 8.89% respectively. While this concentration level is noteworthy, the "Others" category accounts for 54.31% of total holdings, suggesting a relatively balanced distribution compared to many emerging crypto projects where top addresses often exceed 60-70% concentration. However, the fact that nearly half of the circulating supply resides in just five addresses raises legitimate concerns about potential coordinated market movements and governance centralization.
This distribution structure presents a double-edged sword for market dynamics. On one hand, the presence of large holders can provide price stability during volatile periods, as these entities typically have long-term strategic interests. On the other hand, it creates inherent vulnerability to sudden liquidity shocks if any top holder decides to liquidate significant positions. The current configuration suggests CERE maintains adequate decentralization to prevent single-entity manipulation while still showing concentration patterns typical of projects in their growth phase, where early investors and institutional participants maintain substantial stakes.
Click to view current CERE Token Holding Distribution
| Top |
Address |
Holding Qty |
Holding (%) |
| 1 |
0x10e2...132335 |
1504733.24K |
15.04% |
| 2 |
0x218f...6d640f |
1114007.54K |
11.14% |
| 3 |
0x15b3...04cd34 |
889953.77K |
8.89% |
| 4 |
0xac7f...c5bae7 |
537500.00K |
5.37% |
| 5 |
0x8fe0...5b6f88 |
525195.22K |
5.25% |
| - |
Others |
5428610.23K |
54.31% |
II. Core Factors Influencing CERE's Future Price
Supply Mechanism
- Market-Driven Supply Dynamics: Cere Network's price trajectory is shaped by fundamental supply-demand equilibrium within decentralized networks. Token distribution mechanisms and circulation patterns directly impact market valuation.
- Growth Projections: Analysis suggests potential annual growth rates around 5%, reflecting measured expansion expectations within the broader digital asset landscape.
- Current Supply Considerations: Token availability and distribution models continue to influence near-term price formation as the network matures.
Institutional and Market Participation
- Adoption Trends: The digital asset sector shows evolving patterns of institutional engagement, with growing recognition of blockchain-based solutions for data management and decentralized infrastructure.
- Market Positioning: Cere Network operates within the competitive landscape of decentralized data protocols, where enterprise adoption remains a key value driver.
- Regulatory Environment: Global regulatory frameworks continue to develop, creating both challenges and opportunities for digital asset projects across jurisdictions.
Macroeconomic Environment
- Economic Uncertainty: Global economic conditions present multifaceted influences on digital asset valuations. Macroeconomic volatility, geopolitical tensions, and monetary policy shifts create complex market dynamics.
- Broader Economic Factors: The intersection of traditional financial markets and cryptocurrency sectors means that central bank policies, inflation trends, and economic growth patterns indirectly affect token valuations.
- Market Sentiment: Investor confidence and risk appetite fluctuate with broader economic indicators, influencing capital flows into digital assets.
Technology Development and Ecosystem Building
- Protocol Evolution: Cere Network's technical roadmap focuses on decentralized data solutions, with ongoing development aimed at enhancing network capabilities and use case expansion.
- Ecosystem Maturity: The growth of decentralized applications and infrastructure partnerships contributes to long-term value proposition, though specific technical milestones require continuous monitoring.
- Innovation Trajectory: Blockchain technology advancement, including improvements in scalability, interoperability, and security, shapes the competitive positioning of network protocols over time.
III. 2026-2031 CERE Price Forecast
2026 Outlook
- Conservative forecast: $0.00026 - $0.00033
- Neutral forecast: $0.00033 average price level
- Optimistic forecast: up to $0.00045 (requires favorable market conditions and ecosystem development)
2027-2029 Mid-term Outlook
- Market stage expectation: CERE may enter a gradual growth phase as the broader crypto market matures and adoption expands
- Price range forecast:
- 2027: $0.00022 - $0.00054, with an average around $0.00039
- 2028: $0.00032 - $0.00059, targeting $0.00046 on average
- 2029: $0.00049 - $0.00078, potentially reaching $0.00053 average
- Key catalysts: technological upgrades within the Cere ecosystem, increased adoption of decentralized data solutions, and overall crypto market recovery could drive price appreciation during this period
2030-2031 Long-term Outlook
- Baseline scenario: $0.00046 - $0.00077 (assuming steady ecosystem growth and stable market conditions)
- Optimistic scenario: $0.00065 - $0.00077 (driven by significant protocol adoption and favorable regulatory environment)
- Transformational scenario: approaching $0.00071 average levels by 2031 (contingent on breakthrough partnerships and widespread enterprise adoption)
- February 1, 2026: CERE begins its forecast period with an expected range of $0.00026 - $0.00045 (reflecting current market positioning and early-stage development)
| Year |
Predicted High Price |
Predicted Average Price |
Predicted Low Price |
Price Change |
| 2026 |
0.00045 |
0.00033 |
0.00026 |
0 |
| 2027 |
0.00054 |
0.00039 |
0.00022 |
18 |
| 2028 |
0.00059 |
0.00046 |
0.00032 |
40 |
| 2029 |
0.00078 |
0.00053 |
0.00049 |
59 |
| 2030 |
0.00077 |
0.00065 |
0.00046 |
98 |
| 2031 |
0.00073 |
0.00071 |
0.00041 |
115 |
IV. CERE Professional Investment Strategy and Risk Management
CERE Investment Methodology
(1) Long-Term Holding Strategy
- Suitable for: Investors with a multi-year investment horizon and belief in decentralized data cloud infrastructure
- Operational Recommendations:
- Consider gradual accumulation during periods of reduced volatility
- Monitor project development milestones and ecosystem expansion
- Utilize secure wallet solutions such as Gate Web3 Wallet for long-term storage
(2) Active Trading Strategy
- Technical Analysis Tools:
- Moving Averages: Track 50-day and 200-day moving averages to identify potential trend changes
- Volume Analysis: Monitor trading volume patterns to confirm price movements
- Swing Trading Key Points:
- Identify support and resistance levels based on historical price action
- Set stop-loss orders to manage downside risk
CERE Risk Management Framework
(1) Asset Allocation Principles
- Conservative Investors: 1-3% of crypto portfolio
- Aggressive Investors: 5-10% of crypto portfolio
- Professional Investors: Up to 15% with active monitoring
(2) Risk Hedging Solutions
- Portfolio Diversification: Distribute capital across multiple blockchain projects to reduce concentration risk
- Position Sizing: Avoid allocating excessive capital to any single asset
(3) Secure Storage Solutions
- Software Wallet Recommendation: Gate Web3 Wallet for convenient access and security features
- Multi-Signature Options: Consider multi-signature wallets for larger holdings
- Security Precautions: Never share private keys, enable two-factor authentication, and regularly update security protocols
V. CERE Potential Risks and Challenges
CERE Market Risks
- High Volatility: CERE has experienced significant price fluctuations, with a one-year decline of approximately 85.50%, indicating substantial market volatility
- Low Liquidity: With a 24-hour trading volume of approximately 12,391 units, liquidity may be limited, potentially resulting in wider bid-ask spreads
- Market Cap Position: Ranked around 1992 by market capitalization, CERE represents a smaller market cap asset with increased risk exposure
CERE Regulatory Risks
- Policy Uncertainty: Evolving cryptocurrency regulations globally may impact project operations and token utility
- Compliance Requirements: Changes in data privacy laws could affect the decentralized data cloud model
- Cross-Border Regulations: Operating across multiple blockchain networks may subject CERE to varied regulatory frameworks
CERE Technical Risks
- Smart Contract Vulnerabilities: Potential security flaws in contract code could expose users to exploitation risks
- Cross-Chain Integration Complexity: Interoperability with multiple networks may introduce technical challenges and integration risks
- Network Congestion: Performance issues on underlying blockchain networks could affect platform functionality
VI. Conclusion and Action Recommendations
CERE Investment Value Assessment
CERE represents a project focused on decentralized data cloud infrastructure with cross-chain compatibility features. However, the token has experienced considerable downward price pressure over the past year, declining approximately 85.50%. The project's relatively low market ranking and limited trading volume suggest it remains in an early development phase with elevated risk characteristics. Long-term value depends on successful ecosystem expansion, technological advancement, and broader market adoption of decentralized data solutions.
CERE Investment Recommendations
✅ Beginners: Approach with caution due to high volatility and limited liquidity; allocate only small amounts you can afford to lose entirely
✅ Experienced Investors: Consider as a speculative position within a diversified portfolio; conduct thorough research on project fundamentals
✅ Institutional Investors: Evaluate project viability, team credentials, and competitive positioning before committing capital; implement robust risk management protocols
CERE Trading Participation Methods
- Spot Trading: Purchase CERE tokens directly through cryptocurrency exchanges such as Gate.com
- Dollar-Cost Averaging: Systematically accumulate tokens over time to reduce timing risk
- Portfolio Integration: Include CERE as part of a broader blockchain infrastructure investment thesis
Cryptocurrency investment carries extremely high risks, and this article does not constitute investment advice. Investors should make prudent decisions based on their own risk tolerance and are advised to consult professional financial advisors. Never invest more than you can afford to lose.
FAQ
What is the CERE token? What is the main use of the Cere Network project?
CERE is the utility token of Cere Network, used for paying fees in the decentralized data marketplace and SaaS-DeFi ecosystem, as well as for staking and on-chain governance.
What is the CERE price prediction for 2024-2025?
Based on market analysis, CERE is projected to trade between $0.15 and $0.45 in 2024-2025, with potential growth driven by increased adoption and ecosystem development in the decentralized data cloud sector.
What is the historical price trend of CERE token? How does the current price compare to its all-time high?
CERE reached an all-time high of $0.481411. As of January 31, 2026, the current price remains below this historical peak. Check real-time market data for the latest pricing information.
What are the risks of investing in CERE tokens and what should I pay attention to?
CERE token investment carries market volatility and price fluctuation risks. Investors should assess their risk tolerance and investment capacity. Potential losses may occur. Evaluate your financial situation before investing.
What are the advantages of CERE token compared to other Web3 project tokens?
CERE token excels with fast transaction speeds, low fees, and multi-chain interoperability. Advanced consensus mechanisms ensure superior security and scalability. Its flexibility delivers significant advantages in decentralized applications across the Web3 ecosystem.
What is Cere Network's technology roadmap and future prospects?
Cere Network focuses on decentralized data cloud and cross-chain interoperability. The roadmap emphasizes secure data collaboration across blockchains and traditional systems. Future prospects are strong with potential to reach billion users across multiple industries and sectors.
* The information is not intended to be and does not constitute financial advice or any other recommendation of any sort offered or endorsed by Gate.