This comprehensive analysis examines Cere Network (CERE) token price dynamics and investment potential from 2026 to 2031. The article evaluates CERE's current market position at $0.0003316 with a $2.2 million market cap, exploring core factors including macroeconomic trends, adoption patterns, and cross-chain ecosystem development. Detailed price forecasts range from conservative to optimistic scenarios, with 2031 projections reaching $0.00061 on average. The guide provides actionable investment strategies for beginners, experienced traders, and institutional investors, emphasizing risk management through diversification and position sizing. Investors should carefully assess volatility risks, low liquidity conditions, and regulatory uncertainties before allocation. Trading opportunities available on Gate.com include spot trading and dollar-cost averaging approaches for decentralized infrastructure exposure.
Introduction: CERE's Market Position and Investment Value
Cere Network (CERE), as a decentralized data cloud (DDC) platform supported by Binance Labs, has established its unique position connecting enterprise companies with rapidly growing decentralized ecosystems since its inception. As of February 2026, CERE maintains a market capitalization of approximately $2.2 million, with a circulating supply of around 6.64 billion tokens, and the price hovering near $0.0003316. This asset, characterized by its cross-chain compatibility with Binance Smart Chain, Polkadot, Cosmos, and Ethereum networks, is playing an increasingly important role in the decentralized data infrastructure space.
This article will comprehensively analyze CERE's price trajectory from 2026 to 2031, combining historical patterns, market supply-demand dynamics, ecosystem development, and macroeconomic environment to provide investors with professional price forecasts and practical investment strategies.
I. CERE Price History Review and Current Market Status
CERE Historical Price Evolution Trajectory
- 2021: Reached a notable price level of $0.47126 on November 8, representing a significant milestone in the token's early trading history.
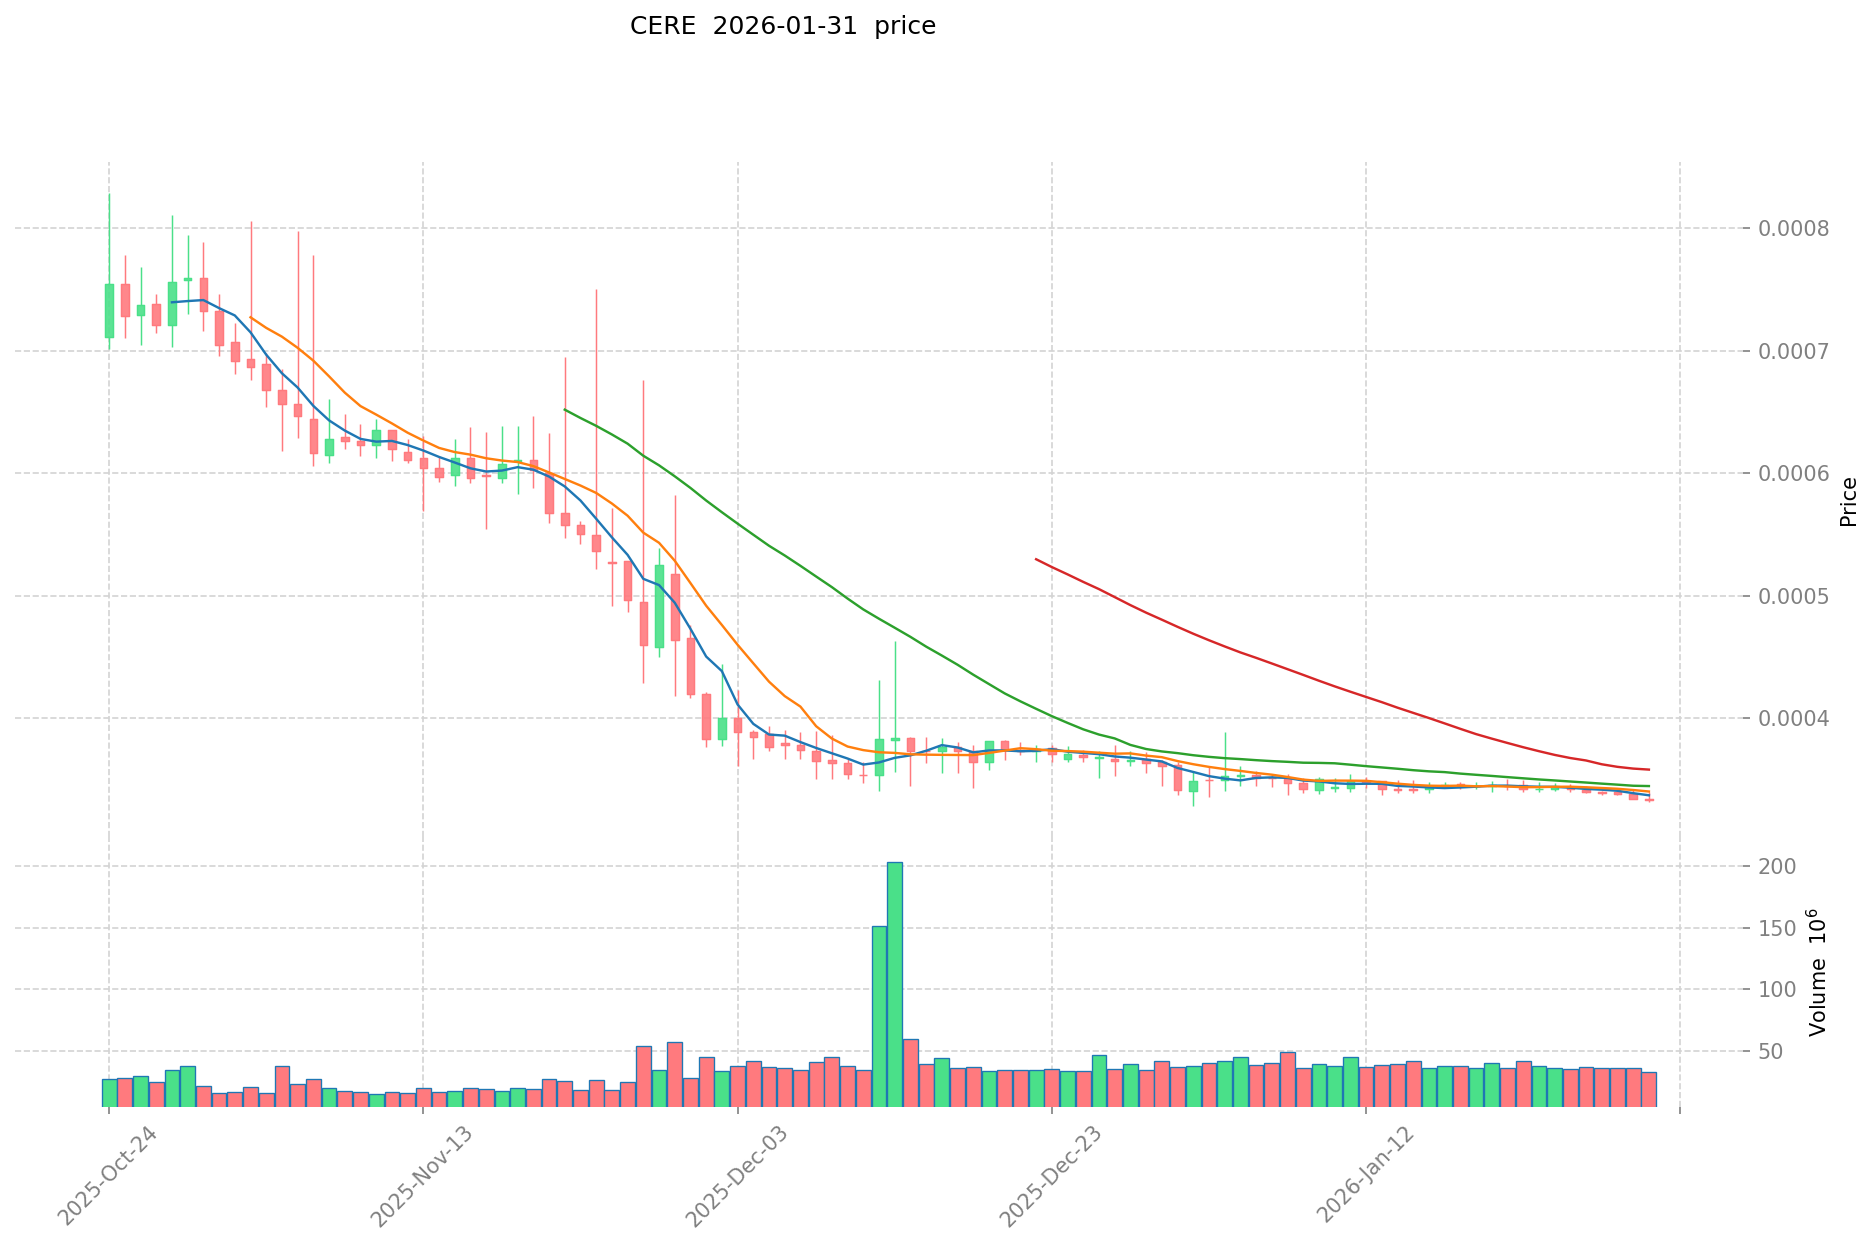
- 2026: Price declined to a low of $0.00033119 on February 1, marking a substantial correction from previous levels.
CERE Current Market Dynamics
As of February 1, 2026, CERE is trading at $0.0003316, with a 24-hour trading volume of $12,299.10. The token has experienced a decline of 1.19% over the past 24 hours, with intraday trading ranging between $0.0003291 and $0.0003364.
Over different timeframes, CERE has shown varied performance: a modest increase of 0.12% in the past hour, while experiencing declines of 3.86% over the past week and 5.83% over the past month. The one-year performance reflects a decrease of 85.49%.
The current circulating supply stands at 6,637,897,251.42 CERE tokens, representing approximately 66.38% of the maximum supply of 10 billion tokens. The market capitalization is approximately $2.20 million, with a fully diluted market cap of $3.32 million. The market cap to fully diluted valuation ratio stands at 66.38%.
The token holder count is recorded at 6,844, indicating a distributed ownership structure. CERE maintains a market dominance of 0.00012% within the broader cryptocurrency ecosystem.
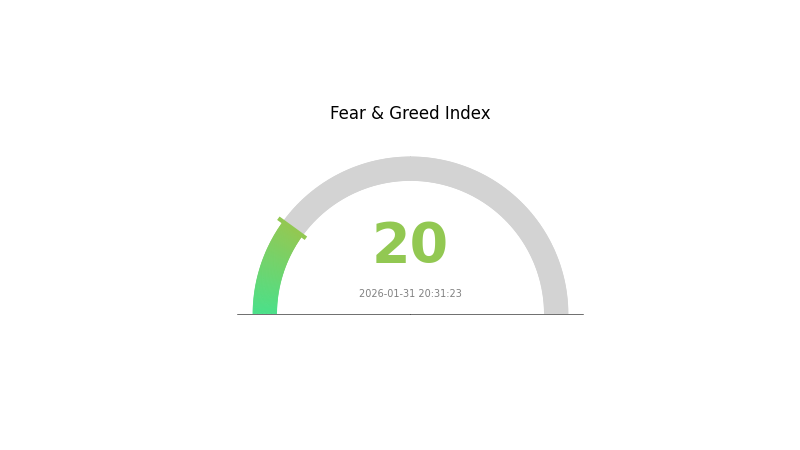
The current market sentiment indicator shows a reading of 20, suggesting an environment of extreme fear among market participants.
Click to view the current CERE market price
Market Sentiment Indicator
02-01-2026 Fear and Greed Index: 20 (Extreme Fear)
Click to view the current Fear & Greed Index
The crypto market is experiencing extreme fear sentiment today. With the Fear and Greed Index at 20, investors are showing significant pessimism and risk aversion. This represents a deeply bearish market condition where selling pressure dominates. Such extreme fear levels historically present potential contrarian opportunities for long-term investors, as excessive fear often precedes market reversals. However, caution remains essential as downside risks may continue in the near term. Monitor key support levels and manage risk accordingly during this volatile period.
CERE Holding Distribution
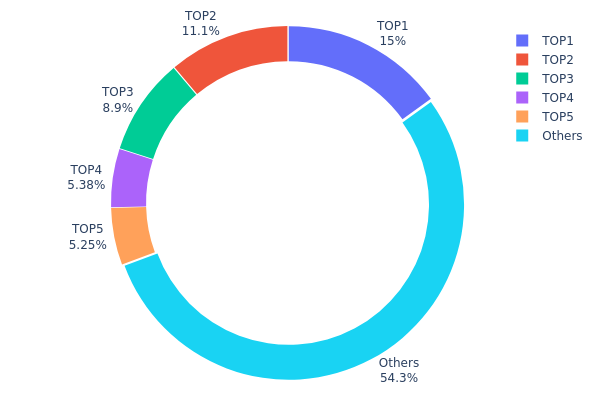
The holding distribution chart reveals the allocation of CERE tokens across different wallet addresses, serving as a key indicator of token concentration and decentralization level within the ecosystem. By analyzing the distribution pattern among top holders and retail participants, we can assess the structural health of the token economy and potential vulnerabilities to market manipulation.
Current data shows a moderate concentration pattern in CERE's holding structure. The top holder controls 1,504,733.24K tokens (15.04%), while the second and third largest addresses hold 11.14% and 8.89% respectively. The top five addresses collectively account for 45.69% of total supply, with the remaining 54.31% distributed among other participants. This distribution suggests a relatively balanced ownership structure compared to many newly launched tokens, where top holders often control over 60-70% of supply.
From a market structure perspective, this holding pattern presents both stability factors and potential risks. The absence of extreme concentration reduces the likelihood of single-entity manipulation, while the substantial holding by top addresses (over 45%) still provides liquidity anchors during volatile periods. However, coordinated actions by major holders could significantly impact price discovery. The 54.31% distribution among smaller addresses indicates healthy retail participation, which typically contributes to price stability and organic market dynamics. This distribution framework suggests CERE maintains an acceptable decentralization level while retaining strategic stakeholder involvement, positioning the token for sustainable long-term development.
Click to view current CERE Holding Distribution
| Top |
Address |
Holding Qty |
Holding (%) |
| 1 |
0x10e2...132335 |
1504733.24K |
15.04% |
| 2 |
0x218f...6d640f |
1114007.54K |
11.14% |
| 3 |
0x15b3...04cd34 |
889953.77K |
8.89% |
| 4 |
0xac7f...c5bae7 |
537500.00K |
5.37% |
| 5 |
0x8fe0...5b6f88 |
525195.22K |
5.25% |
| - |
Others |
5428610.23K |
54.31% |
II. Core Factors Influencing CERE's Future Price
Macroeconomic Environment
-
Monetary Policy Impact: Broader economic factors play a significant role in shaping CERE's price trajectory. Central bank policies and global financial conditions create the backdrop against which cryptocurrency markets operate, influencing investor risk appetite and capital flows into digital assets.
-
Geopolitical Factors: Global economic uncertainties and geopolitical tensions have become increasingly important drivers of market dynamics. These factors can trigger shifts in investment sentiment, affecting both institutional and retail participation in cryptocurrency markets. The interplay between international relations and financial markets creates volatility that extends to digital asset valuations.
Market Demand and Adoption Trends
-
Adoption Patterns: Market demand represents a fundamental driver of CERE's price prospects. As adoption trends evolve, they directly influence the network's utility and perceived value. The growth trajectory depends on how effectively the platform attracts users and demonstrates real-world applications.
-
Institutional Involvement: Institutional participation continues to shape market dynamics. The level of institutional engagement, including investment flows and strategic partnerships, serves as a key indicator of market maturity and confidence. Institutional involvement can provide stability and legitimacy to the ecosystem.
-
Risk and Opportunity Assessment: Climate-related factors have emerged as considerations for financial performance evaluation. Organizations increasingly assess how environmental risks and opportunities might impact their operations and asset valuations. This consideration extends to the cryptocurrency sector, where energy consumption and sustainability practices attract attention from investors and regulators.
-
Financial Impact: Climate considerations can influence operational costs, regulatory compliance requirements, and market positioning. The growing emphasis on sustainable practices may affect how projects are perceived and valued by environmentally conscious investors.
III. 2026-2031 CERE Price Prediction
2026 Outlook
- Conservative Prediction: $0.00021 - $0.00033
- Neutral Prediction: Around $0.00033
- Optimistic Prediction: Up to $0.00043 (requires favorable market conditions)
2027-2029 Outlook
- Market Stage Expectation: Potential gradual growth phase with increasing adoption
- Price Range Predictions:
- 2027: $0.00031 - $0.00054 (projected 14% average increase)
- 2028: $0.00028 - $0.0005 (projected 38% average increase)
- 2029: $0.0004 - $0.00066 (projected 44% average increase)
- Key Catalysts: Platform development progress, ecosystem expansion, and broader crypto market sentiment
2030-2031 Long-term Outlook
- Base Scenario: $0.00044 - $0.00065 (assuming steady ecosystem development)
- Optimistic Scenario: $0.00051 - $0.00077 (with enhanced platform adoption and favorable market conditions)
- Transformative Scenario: Approaching $0.00077 (with significant technological breakthroughs and mass adoption)
- 2031-12-31: CERE potentially reaching $0.00061 average (representing 83% cumulative growth from 2026 baseline)
| Year |
Predicted High Price |
Predicted Average Price |
Predicted Low Price |
Price Change |
| 2026 |
0.00043 |
0.00033 |
0.00021 |
0 |
| 2027 |
0.00054 |
0.00038 |
0.00031 |
14 |
| 2028 |
0.0005 |
0.00046 |
0.00028 |
38 |
| 2029 |
0.00066 |
0.00048 |
0.0004 |
44 |
| 2030 |
0.00065 |
0.00057 |
0.00044 |
71 |
| 2031 |
0.00077 |
0.00061 |
0.00051 |
83 |
IV. CERE Professional Investment Strategy and Risk Management
CERE Investment Methodology
(1) Long-term Holding Strategy
- Target Investors: Believers in decentralized data cloud infrastructure and cross-chain interoperability
- Operational Recommendations:
- Build positions gradually during market corrections to reduce average entry cost
- Monitor the development progress of Cere Network's Decentralized Data Cloud (DDC) platform and cross-chain ecosystem expansion
- Utilize Gate Web3 Wallet for secure storage to ensure asset safety
(2) Active Trading Strategy
- Technical Analysis Tools:
- Moving Averages: Use 50-day and 200-day moving averages to identify trend reversals
- Relative Strength Index (RSI): Monitor oversold conditions below 30 and overbought conditions above 70
- Swing Trading Key Points:
- Pay attention to short-term volatility, as CERE showed -1.19% change in 24 hours and -3.86% over 7 days
- Set stop-loss levels to limit potential losses, especially given the token's high volatility
CERE Risk Management Framework
(1) Asset Allocation Principles
- Conservative Investors: 1-2%
- Aggressive Investors: 3-5%
- Professional Investors: 5-10%
(2) Risk Hedging Solutions
- Diversification: Allocate across multiple blockchain infrastructure projects to reduce concentration risk
- Position Sizing: Limit CERE exposure relative to total portfolio size given its lower market capitalization
(3) Secure Storage Solutions
- Web3 Wallet Recommendation: Gate Web3 Wallet for convenient and secure asset management
- Hardware Wallet Solution: Consider hardware wallets for long-term holdings to minimize online exposure risks
- Security Precautions: Enable two-factor authentication, never share private keys, and regularly verify wallet addresses before transactions
V. CERE Potential Risks and Challenges
CERE Market Risks
- High Volatility: CERE has experienced significant price fluctuations, declining 85.49% over the past year
- Low Liquidity: With 24-hour trading volume of approximately $12,299, the token may face liquidity constraints during large transactions
- Market Capitalization: Ranked #1978 with a market cap of approximately $2.2 million, indicating limited market depth
CERE Regulatory Risks
- Evolving Regulatory Landscape: Decentralized data cloud platforms may face increased scrutiny as regulators examine data storage and cross-chain operations
- Compliance Requirements: Changes in data protection regulations across different jurisdictions could impact Cere Network's operational model
- Cross-Chain Regulatory Complexity: Multi-chain interoperability may subject the project to varying regulatory frameworks
CERE Technical Risks
- Cross-Chain Security: Integration with multiple networks including Binance Smart Chain, Polkadot, Cosmos, and Ethereum increases potential attack surfaces
- Platform Development Risks: Delays or failures in developing the Decentralized Data Cloud infrastructure could impact token utility
- Competition: The decentralized data storage sector faces competition from established projects, which may affect Cere's market position
VI. Conclusion and Action Recommendations
CERE Investment Value Assessment
Cere Network presents a specialized investment opportunity in the decentralized data cloud sector with cross-chain capabilities. The project's support from Binance Labs and its positioning at the intersection of enterprise solutions and decentralized ecosystems provide potential long-term value. However, the token faces significant short-term challenges including high volatility, limited liquidity, and a substantial year-over-year price decline of 85.49%. The relatively small market capitalization and circulating supply of 66.38% suggest both growth potential and elevated risk.
CERE Investment Recommendations
✅ Beginners: Exercise extreme caution; only allocate a minimal portion (1-2%) of speculative capital after thorough research and understanding of decentralized infrastructure projects
✅ Experienced Investors: Consider small position sizing (2-5%) as part of a diversified blockchain infrastructure portfolio, monitoring development milestones and ecosystem growth
✅ Institutional Investors: Conduct comprehensive due diligence on the Decentralized Data Cloud platform, evaluate cross-chain technical architecture, and assess long-term competitive positioning before allocation
CERE Trading Participation Methods
- Spot Trading: Purchase CERE tokens directly on Gate.com to participate in potential upside while maintaining full ownership
- Dollar-Cost Averaging: Implement systematic investment plans to reduce the impact of short-term price volatility
- Portfolio Diversification: Combine CERE with other blockchain infrastructure tokens to balance risk exposure
Cryptocurrency investment carries extremely high risks, and this article does not constitute investment advice. Investors should make prudent decisions based on their own risk tolerance and are advised to consult professional financial advisors. Never invest more than you can afford to lose.
FAQ
What is the CERE token? What is the core value of Cere Network project?
CERE token powers Cere Network's decentralized data marketplace and SaaS-DeFi ecosystem. It facilitates payments, enables staking, and supports on-chain governance, creating a utility-driven infrastructure for enterprise data solutions.
What is the CERE price prediction for 2024-2025? What are the main influencing factors?
CERE price is projected to reach $0.50-$1.20 during 2024-2025. Key factors include ecosystem adoption growth, blockchain scalability improvements, market sentiment shifts, and overall crypto market performance trends.
What is the historical price trend of CERE token and what stage is it currently in?
CERE reached an all-time high of $0.2257 and currently trades at $0.00052727, in a bottom accumulation phase. The 30-day high stands at $0.00082689, indicating significant price consolidation from historical peaks.
What are the main risks of investing in CERE tokens? What factors should I pay attention to?
CERE token investments carry market volatility risks and potential price fluctuations. Key factors include your risk tolerance, market conditions, and investment experience. Investors should only commit funds they can afford to lose, as partial or total loss is possible.
What are the advantages and disadvantages of CERE compared to other distributed storage projects such as Filecoin and Arweave?
CERE offers lower fees and faster transaction speeds compared to Filecoin and Arweave, with better scalability. However, it has lower market maturity and smaller ecosystem scale. Filecoin excels in maturity and decentralization, while Arweave specializes in permanent storage. CERE is better for cost-effective, high-speed storage solutions.
* The information is not intended to be and does not constitute financial advice or any other recommendation of any sort offered or endorsed by Gate.


