This comprehensive analysis examines Manchester City Fan Token (CITY) price dynamics from 2026 to 2031, providing investors with professional forecasts and actionable strategies. Currently trading at $0.59 with a $7.42 million market cap, CITY operates as a blockchain-based fan engagement utility token on the Socios platform. The article evaluates supply-demand dynamics, macroeconomic conditions, and ecosystem development to project conservative ($0.36-$0.59), neutral ($0.59), and optimistic ($0.73) scenarios for 2026, with potential growth to $1.13-$1.46 by 2031. Key sections address investment methodologies including long-term holding and active trading strategies, comprehensive risk management frameworks for conservative to experienced investors, and crucial technical risks tied to Chiliz Chain dependency. With 12.52 million tokens circulating and trading available on Gate and 16 other exchanges, investors should recognize CITY's value derives primarily from Manchester City club performance and fan sentime
Introduction: CITY's Market Position and Investment Value
Manchester City Fan Token (CITY) serves as a blockchain-based fan engagement and governance token for Manchester City Football Club, providing fans with tokenized participation rights in club decisions through the Socios platform. Since its launch in 2021, CITY has established itself within the sports fan token ecosystem. As of 2026, CITY maintains a market capitalization of approximately $7.42 million, with a circulating supply of around 12.52 million tokens, and the price stabilizing at approximately $0.59. This asset, positioned as a "fan engagement utility token", is playing an increasingly important role in bridging the connection between sports organizations and their global fanbase through blockchain technology.
This article will comprehensively analyze CITY's price trends from 2026 to 2031, combining historical patterns, market supply and demand dynamics, ecosystem development, and macroeconomic conditions to provide investors with professional price forecasts and practical investment strategies.
I. CITY Price History Review and Market Status
CITY Historical Price Evolution Trajectory
- 2021: Token launched in May and reached its peak price of $36.19 in August, demonstrating strong initial market enthusiasm during the project's early phase.
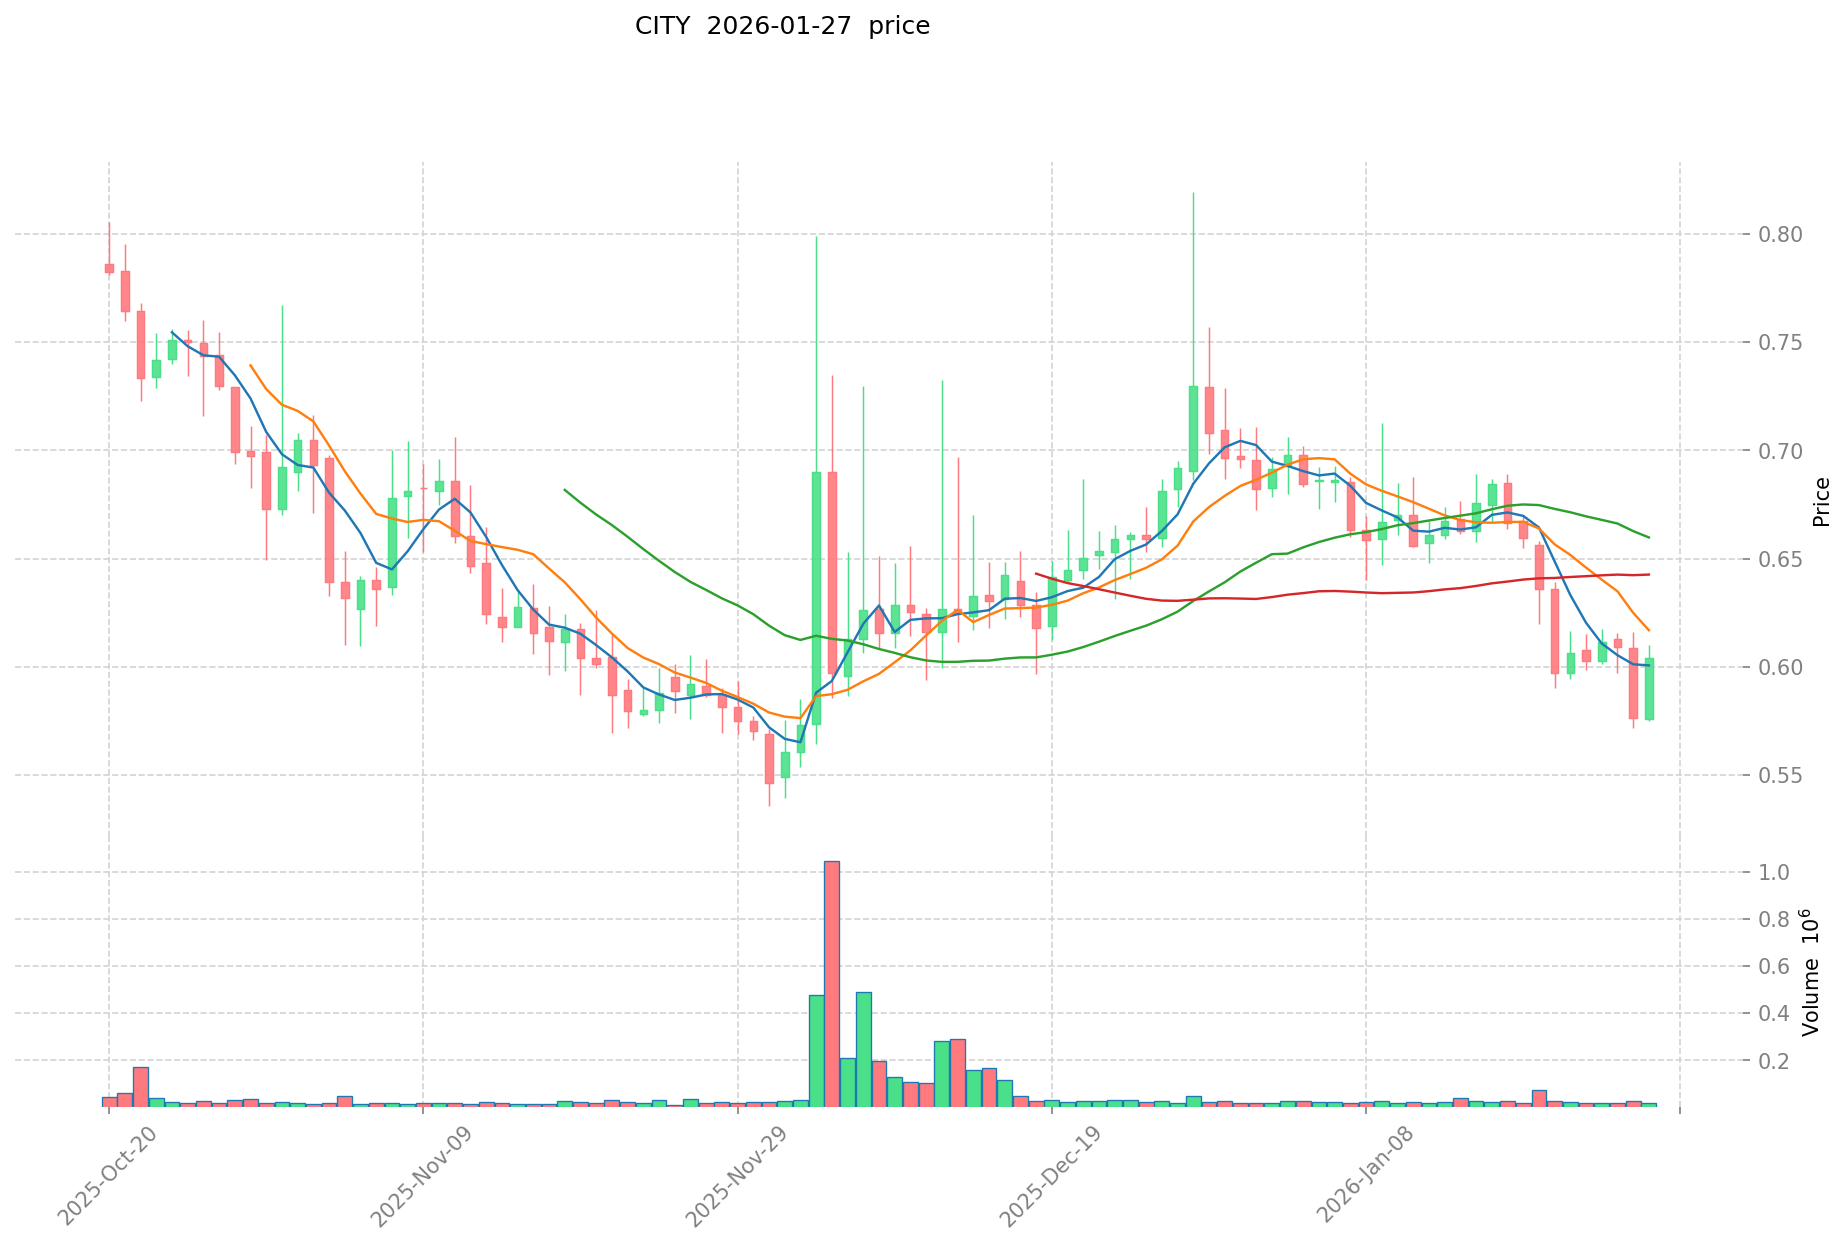
- 2025: Price experienced significant decline, reaching a historical low of $0.514957 in October, reflecting broader market correction and reduced trading activity.
- 2026: Price stabilized around $0.59 level in January, showing modest recovery from previous lows with limited volatility in recent trading sessions.
CITY Current Market Situation
As of January 27, 2026, Manchester City Fan Token (CITY) is trading at $0.5927, representing a 0.13% increase over the past 24 hours. The token's 24-hour trading range spans from $0.5842 to $0.6109, with total trading volume reaching $11,948.35.
The token currently holds a market capitalization of approximately $7.42 million, with 12,516,034 tokens in circulation out of a maximum supply of 19,740,000 tokens, representing a circulation ratio of 63.4%. CITY ranks #1345 in the cryptocurrency market, maintaining a market dominance of 0.00037%.
Looking at broader timeframes, CITY has declined 4.71% over the past week and 17.18% over the past month. The one-year performance shows a 62.72% decrease from previous levels. The token is currently trading approximately 98.4% below its historical peak price, while maintaining a position above its recent historical low recorded in October 2025.
The fully diluted market capitalization stands at $11.7 million, with the market cap to FDV ratio at 63.4%, indicating a substantial portion of total supply is already in circulation. The token is currently traded on 17 exchanges and has approximately 221 holders according to available data.
Click to view current CITY market price
Market Sentiment Indicator
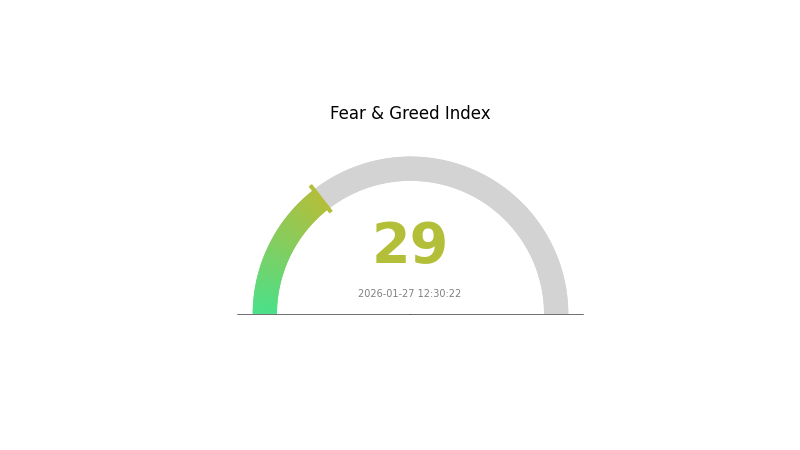
2026-01-27 Fear and Greed Index: 29 (Fear)
Click to view the current Fear & Greed Index
Today's crypto market sentiment shows a fear reading of 29, indicating heightened caution among investors. This level suggests market participants are experiencing significant anxiety about price movements and potential downside risks. When the index is in the fear zone, it often presents contrarian opportunities for experienced traders, as extreme fear typically precedes market reversals. However, risk management remains crucial during periods of elevated market uncertainty. Monitor key support levels and consider your portfolio allocation carefully. This sentiment reading reflects broader market concerns and warrants close attention to upcoming economic data and regulatory developments.
CITY Holding Distribution
The holding distribution chart illustrates the concentration of CITY tokens across different wallet addresses, providing crucial insights into the token's ownership structure and decentralization level. This metric serves as a key indicator for assessing potential market manipulation risks and the overall health of the token's on-chain ecosystem.
Based on current data analysis, CITY demonstrates a relatively concentrated holding pattern among top addresses. The distribution reveals that a significant portion of the token supply is controlled by a limited number of wallets, which typically indicates moderate centralization. Such concentration levels can create substantial price volatility, as large holders possess the capability to influence market dynamics through their trading activities. This structure may expose the token to increased susceptibility to coordinated price movements or potential manipulation scenarios.
From a market structure perspective, this holding distribution pattern reflects a developing ecosystem that has not yet achieved optimal decentralization. While concentration among major holders can provide stability during market downturns, it simultaneously introduces heightened systemic risks. The current on-chain architecture suggests that CITY's price discovery mechanism remains vulnerable to decisions made by a relatively small group of participants, warranting careful attention from both retail and institutional investors when evaluating entry positions.
Click to view current CITY Holding Distribution

| Top |
Address |
Holding Qty |
Holding (%) |
II. Core Factors Influencing CITY's Future Price
Supply and Demand Dynamics
- Economic Growth: Urban economic growth serves as the fundamental driver of price trends. When economies experience sustained expansion, market values tend to move upward correspondingly. Conversely, when economic growth slows, price movements may stabilize or face downward pressure.
- Population Movements: Demographic shifts play a significant role in market dynamics. Cities experiencing net population outflows may face challenges in maintaining price levels, as reduced demand impacts overall market sentiment.
- Historical Patterns: Long-term data suggests that supply-demand relationships remain the primary determinant of price trajectories. Market liquidity and available capital directly correlate with price formation mechanisms.
Industrial Development Impact
- Industry as Primary Driver: Industrial development stands as the most crucial factor affecting urban economic vitality. The productive output from various sectors directly translates into market value indicators.
- Infrastructure Development: Urban transportation networks and infrastructure projects contribute to overall market accessibility and efficiency. Inter-city rail connections and improved transportation systems can reshape market dynamics over time.
- Collaboration Efficiency: The effectiveness of cross-sector cooperation and economic coordination influences long-term market sustainability and growth potential.
Macroeconomic Environment
- Monetary Policy Influence: The quantity of circulating capital in the market environment affects price levels. When available liquidity increases, market valuations may adjust accordingly, though fundamental utility values remain consistent.
- Market Maturity: The development stage of the broader market ecosystem influences price stability and volatility patterns. More mature markets tend to demonstrate different characteristics compared to emerging ones.
- Investment Channel Development: The availability and sophistication of investment mechanisms impact capital flow patterns and market participant behavior.
Demographic Considerations
- Long-term Demographic Trends: Population aging represents a gradual process that may influence market dynamics over extended periods. However, such demographic shifts typically require decades to materially impact market fundamentals.
- Urban Concentration: Analysis of developed markets suggests a trend toward population concentration in major metropolitan areas. This pattern may create varying outcomes across different market tiers, with core urban centers potentially maintaining stronger fundamentals.
- Generational Cycles: The time required for demographic changes to impact markets extends across multiple decades, suggesting that near-term effects may remain limited while long-term structural shifts continue to unfold.
III. 2026-2031 CITY Price Predictions
2026 Outlook
- Conservative Forecast: $0.36 - $0.59
- Neutral Forecast: $0.59 (average market scenario)
- Optimistic Forecast: $0.73 (requires favorable market momentum and increased adoption)
2027-2029 Mid-term Outlook
- Market Stage Expectations: Potential growth phase with gradual price appreciation as the cryptocurrency market matures and CITY gains broader recognition
- Price Range Forecasts:
- 2027: $0.40 - $0.85 (approximately 11% increase from 2026 baseline)
- 2028: $0.46 - $0.95 (approximately 27% increase from 2026 baseline)
- 2029: $0.83 - $1.04 (approximately 43% increase from 2026 baseline)
- Key Catalysts: Market expansion, technological developments, and growing ecosystem participation may contribute to upward price momentum
2030-2031 Long-term Outlook
- Baseline Scenario: $0.67 - $0.95 in 2030 (assuming steady market conditions and continued project development)
- Optimistic Scenario: $1.32 in 2030 (requires significant adoption milestones and favorable regulatory environment)
- Growth Scenario: $0.85 - $1.47 in 2031 (projected 91% increase from 2026 baseline, contingent on sustained market growth and ecosystem expansion)
- January 27, 2026: CITY price forecasts indicate potential multi-year growth trajectory
| Year |
Predicted High Price |
Predicted Average Price |
Predicted Low Price |
Price Change |
| 2026 |
0.7305 |
0.5939 |
0.35634 |
0 |
| 2027 |
0.85424 |
0.6622 |
0.40394 |
11 |
| 2028 |
0.94777 |
0.75822 |
0.46251 |
27 |
| 2029 |
1.04065 |
0.85299 |
0.8274 |
43 |
| 2030 |
1.32555 |
0.94682 |
0.67224 |
59 |
| 2031 |
1.46568 |
1.13619 |
0.85214 |
91 |
IV. CITY Professional Investment Strategy and Risk Management
CITY Investment Methodology
(1) Long-term Holding Strategy
- Suitable for: Fan token enthusiasts and supporters of Manchester City Football Club seeking long-term engagement with the club's ecosystem
- Operational recommendations:
- Consider accumulating CITY tokens during market corrections when trading volumes suggest reduced speculative activity
- Monitor Manchester City's performance and major club announcements that may influence fan engagement levels
- Utilize Gate Web3 Wallet for secure storage with multi-signature authentication enabled
(2) Active Trading Strategy
- Technical analysis tools:
- Volume analysis: Monitor the 24-hour trading volume (currently $11,948.35) relative to market cap to identify liquidity patterns
- Support/resistance levels: Track the 24-hour range ($0.5842-$0.6109) to establish short-term trading boundaries
- Swing trading considerations:
- Pay attention to major football events and club announcements that may trigger price volatility
- Set stop-loss orders given the token's historical volatility range
CITY Risk Management Framework
(1) Asset Allocation Principles
- Conservative investors: 0.5-1% of crypto portfolio allocation
- Moderate investors: 1-2% of crypto portfolio allocation
- Experienced investors: 2-5% of crypto portfolio allocation with active monitoring
(2) Risk Hedging Solutions
- Portfolio diversification: Combine CITY with broader crypto market exposures to reduce concentration risk
- Position sizing: Limit initial exposure given the token's circulating supply represents 63.4% of maximum supply
(3) Secure Storage Solutions
- Hot wallet recommendation: Gate Web3 Wallet for active trading and governance participation
- Cold storage option: Hardware wallet solutions for long-term holdings exceeding $1,000
- Security precautions: Enable two-factor authentication, regularly update wallet software, and verify contract addresses (0x6401b29F40a02578Ae44241560625232A01B3F79 on Chiliz Chain)
V. CITY Potential Risks and Challenges
CITY Market Risks
- Limited liquidity: With daily trading volume of $11,948.35 against a market cap of $7.42 million, large orders may experience significant slippage
- High volatility exposure: The token has experienced a 62.72% decline over the past year, reflecting sensitivity to broader market conditions
- Niche market positioning: As a fan token, CITY's value is closely tied to Manchester City's performance and fan engagement levels
CITY Regulatory Risks
- Fan token classification uncertainty: Evolving regulatory frameworks may affect how fan tokens are classified across different jurisdictions
- Cross-border compliance challenges: Operations spanning multiple regions may face varying regulatory requirements
- Platform dependency: Reliance on the Socios platform for core utility functions creates regulatory exposure through third-party relationships
CITY Technical Risks
- Smart contract vulnerabilities: Despite operating on Chiliz Chain (an Ethereum-based Proof-of-Authority sidechain), smart contract risks remain inherent
- Sidechain dependency: Performance and security depend on the stability of the underlying Chiliz Chain infrastructure
- Limited exchange availability: Trading on 17 exchanges may restrict liquidity compared to more widely distributed tokens
VI. Conclusion and Action Recommendations
CITY Investment Value Assessment
CITY represents a specialized investment opportunity within the sports fan engagement sector, offering utility through governance participation and reward mechanisms on the Socios platform. The token's value proposition centers on its ability to provide Manchester City supporters with tokenized engagement rights. However, the recent price performance shows significant challenges, with the token trading 98.4% below its all-time high of $36.19 (August 2021) at the current price of $0.5927. The circulating supply of 12.52 million tokens (63.4% of maximum supply) suggests moderate inflation risk. While the fan token sector demonstrates innovative use cases for blockchain technology in sports, investors should recognize that CITY's value is intrinsically linked to club performance, fan sentiment, and platform adoption rather than broader crypto market dynamics.
CITY Investment Recommendations
✅ Beginners: Consider starting with minimal allocation (under 1% of total crypto portfolio) to understand fan token mechanics and governance participation before increasing exposure
✅ Experienced investors: Approach CITY as a specialized position within a diversified crypto portfolio, focusing on events-based trading around major club announcements and football season developments
✅ Institutional investors: Evaluate CITY within the context of sports and entertainment blockchain adoption, considering correlation analysis with traditional sports assets and fan engagement metrics
CITY Trading Participation Methods
- Spot trading: Access CITY trading pairs on Gate.com and 16 other supporting exchanges with attention to liquidity depth
- Staking opportunities: Monitor future developments for NFT reward mechanisms through token staking as mentioned in project documentation
- Governance participation: Utilize holdings to vote on club decisions through Socios platform smart contracts, enhancing utility value
Cryptocurrency investments carry extremely high risks, and this article does not constitute investment advice. Investors should make cautious decisions based on their own risk tolerance and are advised to consult professional financial advisors. Never invest more than you can afford to lose.
FAQ
What is CITY coin and what practical application value does it have?
CITY coin is an emerging digital currency utilized in urban smart infrastructure projects. It demonstrates real-world applications in sustainable city development initiatives, showcasing significant investment potential and broad development prospects in the Web3 ecosystem.
What is CITY's historical price trend? What is the current price?
CITY is currently trading at $0.6742, up 1.16%. The 24-hour high is $0.6804 and low is $0.6614. The token has shown steady performance with a 24-hour trading volume of 1.2411 million units.
How to analyze CITY coin price trends? What technical indicators can be referenced?
Analyze CITY price trends using MACD, RSI, moving averages, and Bollinger Bands. These indicators help identify trend directions, momentum strength, and potential trading signals for better market entry and exit timing.
What are the main risks of investing in CITY coin?
CITY coin investment risks include significant price volatility, market uncertainty, and regulatory challenges. Current price is substantially below historical highs and initial issuance price, resulting in negative returns. Market liquidity fluctuations and adoption uncertainty also pose risks to investors.
What are the advantages of CITY coin compared to similar tokens?
CITY coin offers unique advantages through its direct partnership with Manchester City Football Club, enabling fans to participate in club governance and access exclusive benefits. With limited total supply ensuring scarcity and transparent market circulation similar to listed stocks, CITY provides distinctive value proposition in the fan token sector.
How do experts predict CITY coin's future price?
Industry experts forecast CITY coin showing strong growth potential, with predictions suggesting significant appreciation driven by increasing adoption, growing transaction volume, and strengthening market fundamentals through 2026 and beyond.
* The information is not intended to be and does not constitute financial advice or any other recommendation of any sort offered or endorsed by Gate.